ArxivLens

Quick Summary:

The Infographics Wizard framework offers a semi-automated solution for generating structured and flow-based infographics, enabling both novice and expert designers to create high-quality infographics more efficiently. The framework includes a dataset for visual group designs and complete infographics, facilitating faster and more effective infographic design.

Journal Reference: Computer Graphics Forum, 2022, 41: 121-132
DOI: 10.1111/cgf.14527
arXiv Id: 2204.09904
Comments: Preprint of the EUROVIS 22 accepted paper. arXiv admin note: substantial text overlap with arXiv:2108.11914
Date Published: 2022-08-23
Date Updated: 2022-08-23

Key Terms (TF-IDF):

designs (0.309)
design (0.229)
visual (0.215)
dataset (0.180)
framework (0.178)
templates (0.167)
expert (0.164)
experts (0.157)
perception (0.155)
designing (0.150)
time consuming (0.148)
consuming (0.146)
maintaining (0.145)
requirement (0.144)
automated (0.143)
inputs (0.139)
structured (0.135)
existing methods (0.135)
automatically (0.135)
faster (0.133)
License: http://creativecommons.org/licenses/by/4.0/

Summary:

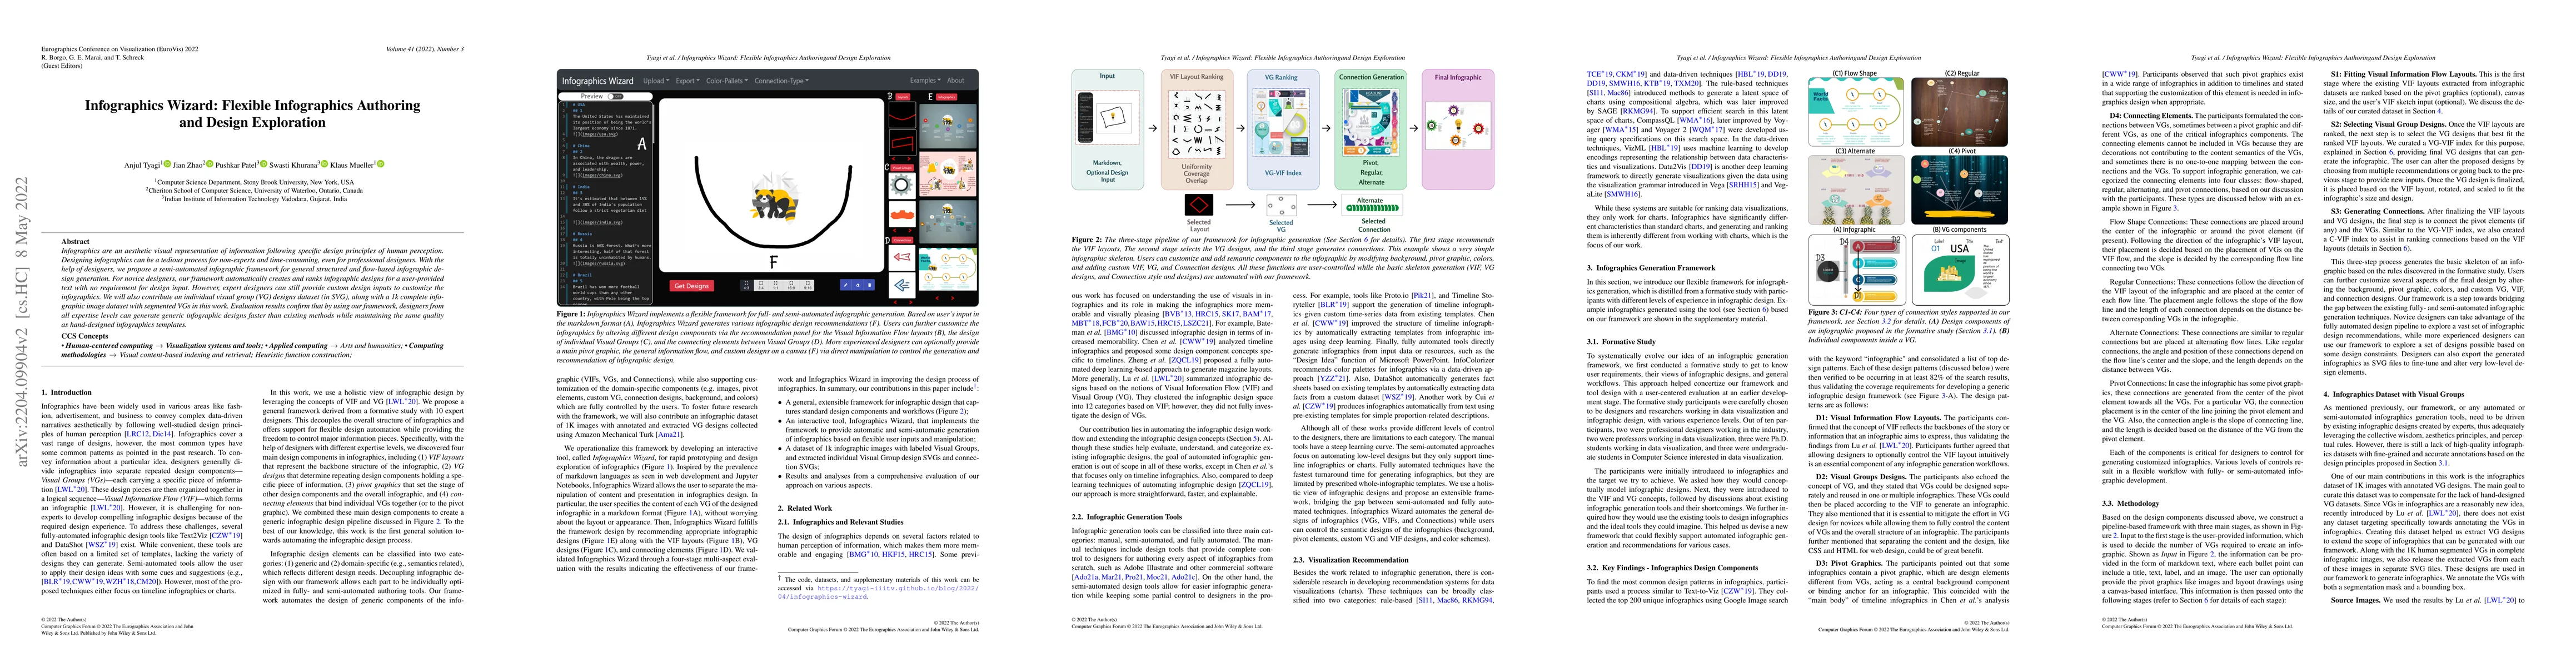
Infographics are an aesthetic visual representation of information following specific design principles of human perception. Designing infographics can be a tedious process for non-experts and time-consuming, even for professional designers. With the help of designers, we propose a semi-automated infographic framework for general structured and flow-based infographic design generation. For novice designers, our framework automatically creates and ranks infographic designs for a user-provided text with no requirement for design input. However, expert designers can still provide custom design inputs to customize the infographics. We will also contribute an individual visual group (VG) designs dataset (in SVG), along with a 1k complete infographic image dataset with segmented VGs in this work. Evaluation results confirm that by using our framework, designers from all expertise levels can generate generic infographic designs faster than existing methods while maintaining the same quality as hand-designed infographics templates.

Citation & Reference Network Visualization

This graph shows how this paper is connected to other research. The current paper is shown in dark gray, papers that cite it are in green, and papers it references are in blue. You can:

Current Paper
Papers citing this work (Citations)
Papers cited by this work (References)

• Hover over any node to see the paper title

• Click a node to view that paper's details

• Drag nodes to rearrange the graph

• Use the zoom controls (bottom right) to zoom in/out

Citations and References

Title Authors Year Actions
Characterizing Creativity in Visualization Design
Naimul Hoque, Zinat Ara, Safwat Ali Khan, Fanny Chevalier, Niklas Elmqvist
2025
View Paper
Exploring the hybrid image–text model in reconstructing idea-generation training methods of design education
Xiangtian Bai, Ming Zhong, Bo Ou, Yating Xie, Fanhao Li
2025
View Paper
IntelliCircos: A Data-driven and AI-powered Authoring Tool for Circos Plots
Mingyang Gu, Jiamin Zhu, Qipeng Wang, Fengjie Wang, Xiaolin Wen, Yong Wang, Min Zhu
2025
View Paper
Analisis Kualitatif Konten Infografis Buku Why? Seri Greece Sebagai Media Edukasi Sejarah
Gladi Pawestri Utami, Luqman Wahyudi, B. Bagja, Alfiandi Eka Kusuma
2024
View Paper
Constraint Representation Towards Precise Data-Driven Storytelling
Yu-Zhe Shi, Haotian Li, Lecheng Ruan, Huamin Qu
2024
View Paper
Influencer: Empowering Everyday Users in Creating Promotional Posts via AI-infused Exploration and Customization
Xuye Liu, Annie Sun, Pengcheng An, Tengfei Ma, Jian Zhao
2024
View Paper
Epigraphics: Message-Driven Infographics Authoring
Tongyu Zhou, Jeff Huang, G. Chan
2024
View Paper
GraphiMind: LLM-centric Interface for Information Graphics Design
Qiruin Huang, Min Lu, J. Lanir, D. Lischinski, D. Cohen-Or, Hui Huang
2024
View Paper
Awareness and Use of Infographic Tools among Librarians in Nigeria
J. K. Opele, T. Onayinka, Ikeoluwa Jesufisayomi Fagbami, Ndubuisi Friday Ugwu
2024
View Paper
Where Are We So Far? Understanding Data Storytelling Tools from the Perspective of Human-AI Collaboration
Haotian Li, Yun Wang, Huamin Qu
2023
View Paper
De-Stijl: Facilitating Graphics Design with Interactive 2D Color Palette Recommendation
Xinyu Shi, Ziqi Zhou, Jing Wen Zhang, Ali Neshati, Anjul Tyagi, R. Rossi, Shunan Guo, F. Du, J. Zhao
2023
View Paper
Content-Driven Layout for Visualization Design
Y. S. Kristiansen, L. Garrison, S. Bruckner
2022
View Paper
NAS-Navigator: Visual Steering for Explainable One-Shot Deep Neural Network Synthesis
Anjul Tyagi, C. Xie, Klaus Mueller
2020
View Paper
Infographics in Educational Settings: A Literature Review
Sameer Ahmad Bhat, Suzan Alyahya
2024
View Paper
Towards Automated Infographic Authoring From Natural Language Statement With Multiple Proportional Facts
Jianwei Lu, Guohua Wang, Yi Cai, Xin Wu
2024
View Paper

Comments (0)

This website uses cookies to ensure you get the best experience. Learn more