MapCraft: Dissecting and Designing Custom Geo-Infographics
Publication
Metrics
AI Quick Summary
MapCraft introduces a web-based authoring tool for designing custom geo-infographics by exploring a structured design space of four critical dimensions: basic map representations, encoding channels, label design and placement, and highlighting techniques. The tool's effectiveness was validated by a user study showing significant improvements in participants' understanding and application of these dimensions.
Paper Preview
Abstract
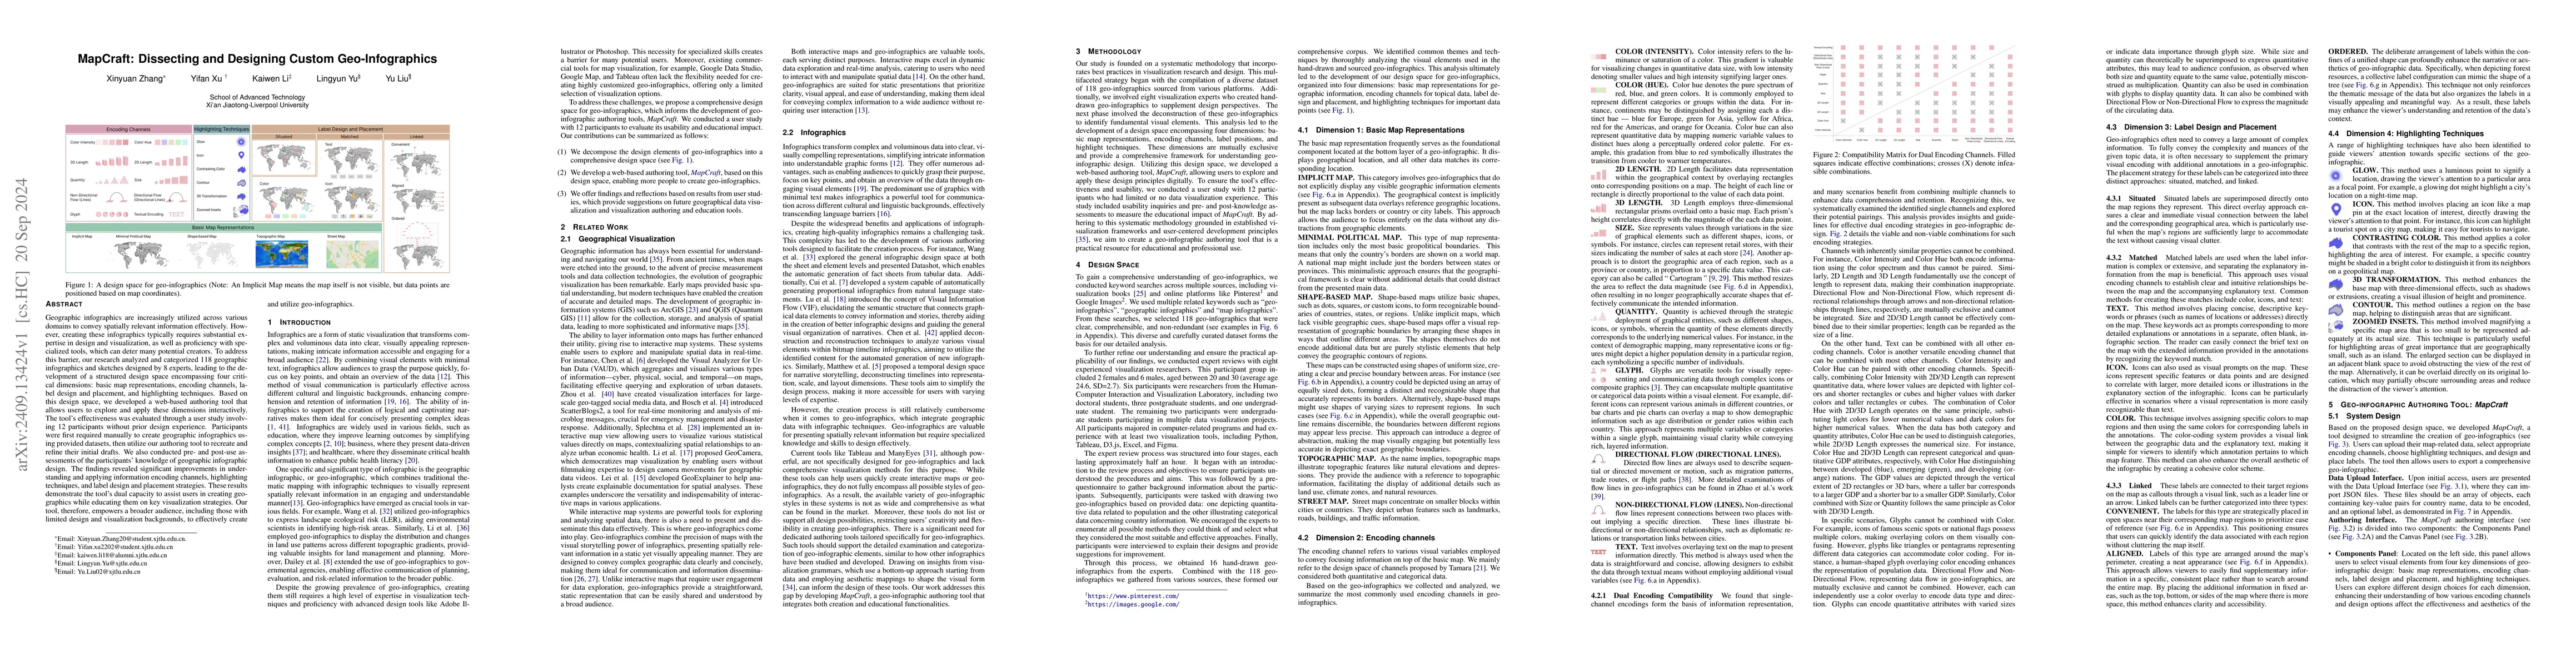
Geographic infographics are increasingly utilized across various domains to convey spatially relevant information effectively. However, creating these infographics typically requires substantial expertise in design and visualization, as well as proficiency with specialized tools, which can deter many potential creators. To address this barrier, our research analyzed and categorized 118 geographic infographics and sketches designed by 8 experts, leading to the development of a structured design space encompassing four critical dimensions: basic map representations, encoding channels, label design and placement, and highlighting techniques. Based on this design space, we developed a web-based authoring tool that allows users to explore and apply these dimensions interactively. The tool's effectiveness was evaluated through a user study involving 12 participants without prior design experience. Participants were first required manually to create geographic infographics using provided datasets, then utilize our authoring tool to recreate and refine their initial drafts. We also conducted pre- and post-use assessments of the participants' knowledge of geographic infographic design. The findings revealed significant improvements in understanding and applying information encoding channels, highlighting techniques, and label design and placement strategies. These results demonstrate the tool's dual capacity to assist users in creating geographics while educating them on key visualization strategies. Our tool, therefore, empowers a broader audience, including those with limited design and visualization backgrounds, to effectively create and utilize geo-infographics.
AI Key Findings
Get AI-generated insights about this paper's methodology, results, significance, and more — seven facets brought into focus.
Impact
Paper Details
Authors
PDF Preview
Citation Network
Current paper (gray), citations (green), references (blue)
Display is limited for performance on very large graphs.
Discussion 0