ArxivLens

Quick Summary:

Epigraphics is a web-based authoring system that prioritizes the message for infographic design, using text-based "epigraphs" to guide the creation and synchronization of visual assets, enhancing cohesiveness and enabling rapid prototyping, as demonstrated by a usability study with designers.

DOI: 10.1145/3613904.3642172
arXiv Id: 2404.10152
Comments: 18 pages, 9 figures
Date Published: 2024-04-17
Date Updated: 2024-04-17

Categories:

Key Terms (TF-IDF):

message (0.355)
text (0.214)
uses (0.210)
assets (0.181)
sourced (0.181)
highlighting (0.169)
filters (0.166)
case studies (0.166)
guide (0.163)
web (0.162)
creation (0.157)
big (0.157)
creating (0.156)
supports (0.153)
start (0.153)
fine tuning (0.151)
facilitate (0.150)
picture (0.150)
plays (0.145)
rapid (0.142)
License: http://arxiv.org/licenses/nonexclusive-distrib/1.0/

Summary:

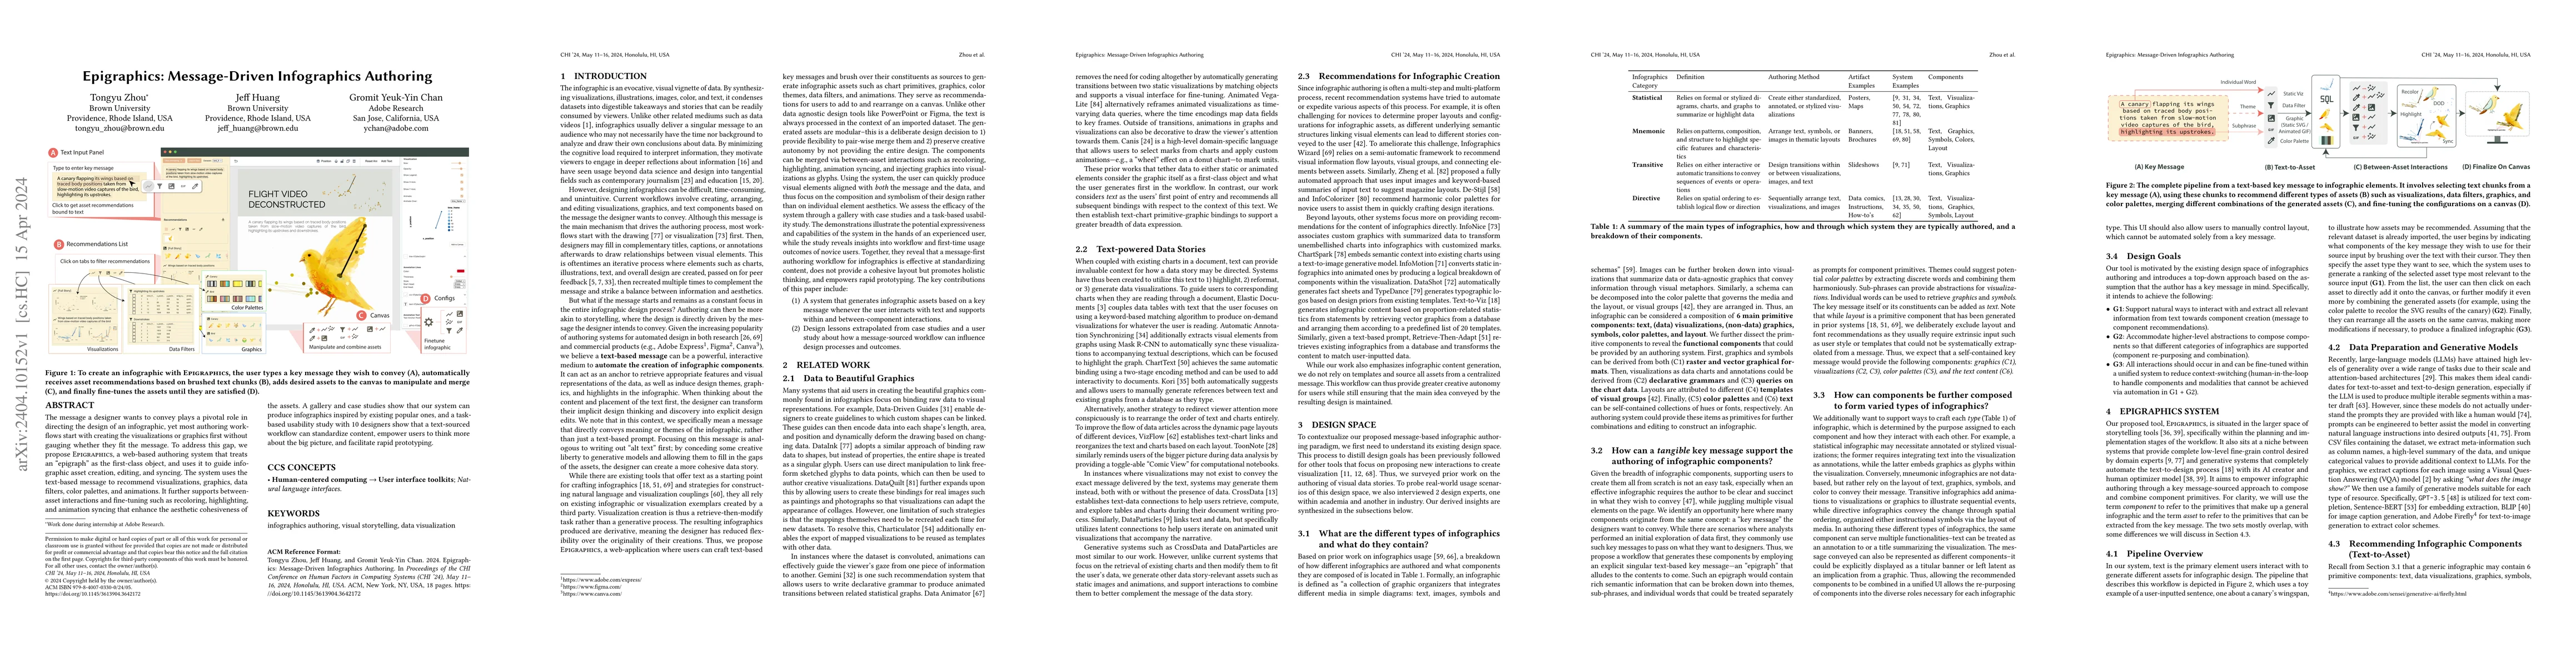
The message a designer wants to convey plays a pivotal role in directing the design of an infographic, yet most authoring workflows start with creating the visualizations or graphics first without gauging whether they fit the message. To address this gap, we propose Epigraphics, a web-based authoring system that treats an "epigraph" as the first-class object, and uses it to guide infographic asset creation, editing, and syncing. The system uses the text-based message to recommend visualizations, graphics, data filters, color palettes, and animations. It further supports between-asset interactions and fine-tuning such as recoloring, highlighting, and animation syncing that enhance the aesthetic cohesiveness of the assets. A gallery and case studies show that our system can produce infographics inspired by existing popular ones, and a task-based usability study with 10 designers show that a text-sourced workflow can standardize content, empower users to think more about the big picture, and facilitate rapid prototyping.

Citation & Reference Network Visualization

This graph shows how this paper is connected to other research. The current paper is shown in dark gray, papers that cite it are in green, and papers it references are in blue. You can:

Current Paper
Papers citing this work (Citations)
Papers cited by this work (References)

• Hover over any node to see the paper title

• Click a node to view that paper's details

• Drag nodes to rearrange the graph

• Use the zoom controls (bottom right) to zoom in/out

Citations and References

Title Authors Year Actions
House Advantage or House of Cards? Stacking the Deck for Data Videos Leads to Null Results
Jen Rogers, Leixian Shen, Abigail Mosca, Evan Peck, Mingwei Li, Anzu Hakone, Kristi Potter, Remco Chang
2025
View Paper
DATAWEAVER: Authoring Data-Driven Narratives through the Integrated Composition of Visualization and Text
Yu Fu, Dennis Bromley, V. Setlur
2025
View Paper
Reflecting on Design Paradigms of Animated Data Video Tools
Leixian Shen, Haotian Li, Yun Wang, Huamin Qu
2025
View Paper
Exploring Human Perception in Interactive Digital Advertising: A Genetic-Kansei Engineering Approach with Human-AI Collaboration
Danni Chang, Luyao Wang, Yan Xiang, Xinyu Zhu, Ching-Hung Lee
2025
View Paper
PortalInk: 2.5D Visual Storytelling with SVG Parallax and Waypoint Transitions
Tongyu Zhou, Joshua Kong Yang, V. H. Chan, Ji Won Chung, Jeffson Huang
2024
View Paper
“It's a Good Idea to Put It Into Words”: Writing ‘Rudders’ in the Initial Stages of Visualization Design
Chase Stokes, Clara Hu, Marti A. Hearst
2024
View Paper
Influencer: Empowering Everyday Users in Creating Promotional Posts via AI-infused Exploration and Customization
Xuye Liu, Annie Sun, Pengcheng An, Tengfei Ma, Jian Zhao
2024
View Paper
Leveraging Foundation Models for Crafting Narrative Visualization: A Survey.
Yi He, Ke Xu, Shixiong Cao, Yang Shi, Qing Chen, Nan Cao
2024
View Paper

Comments (0)

This website uses cookies to ensure you get the best experience. Learn more