Academic Profile
Statistics
Similar Authors
Papers on arXiv
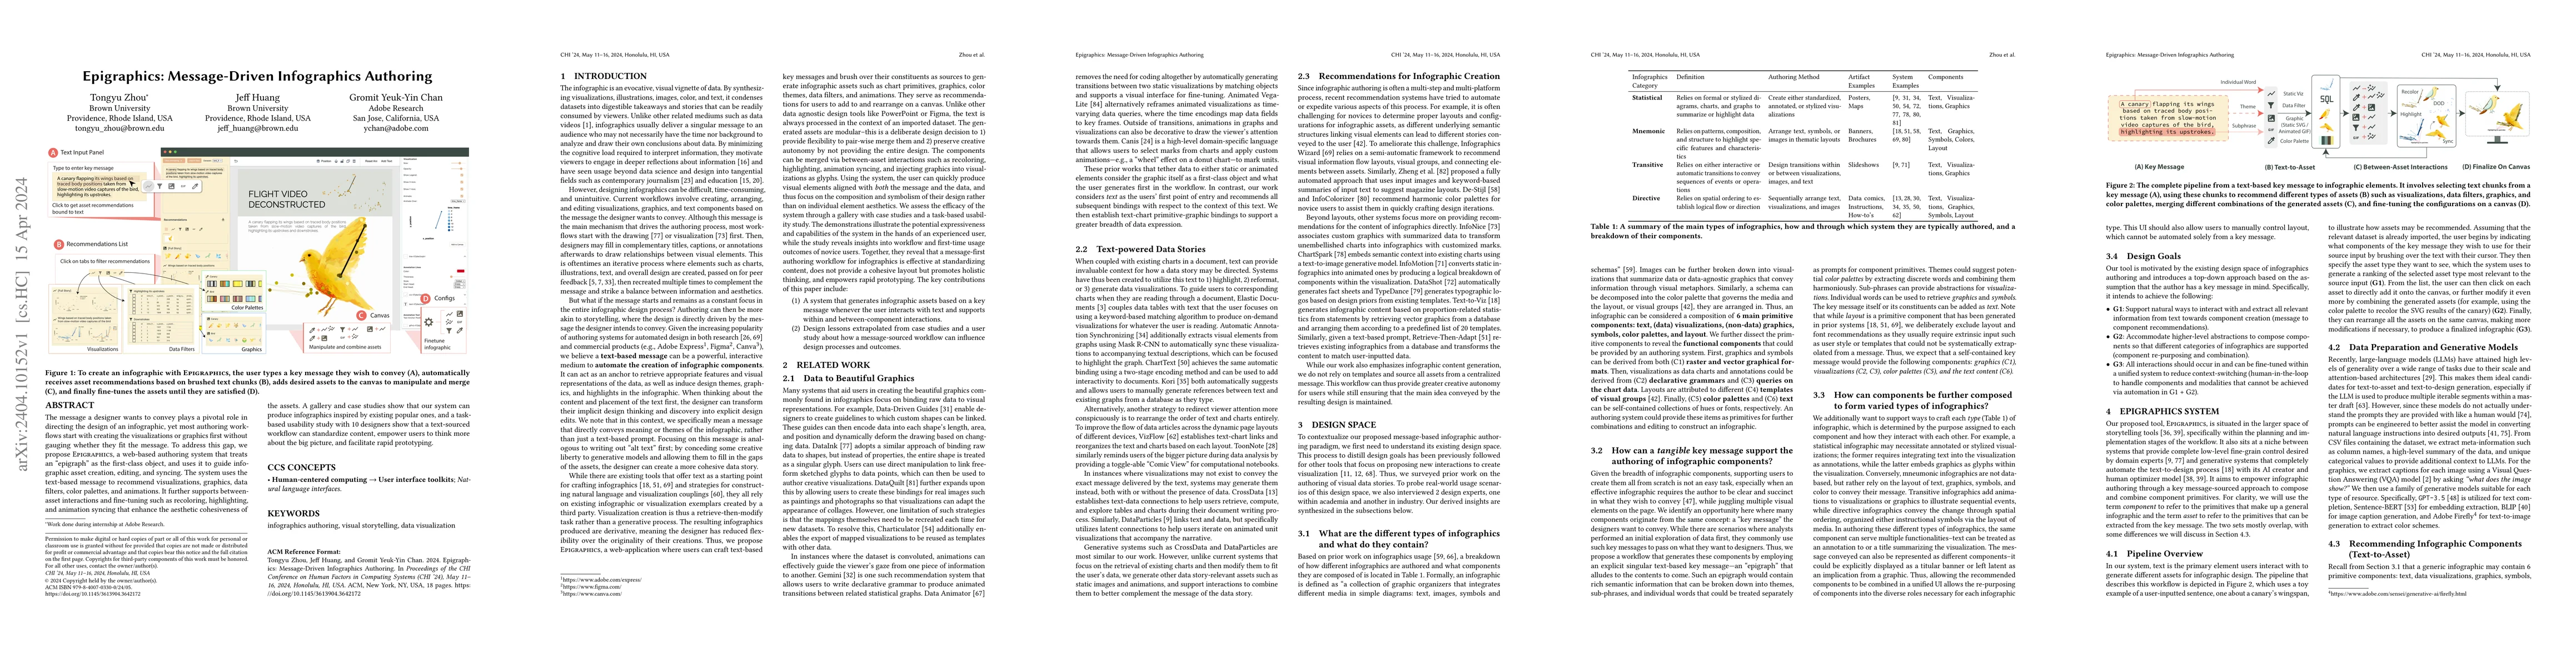
The message a designer wants to convey plays a pivotal role in directing the design of an infographic, yet most authoring workflows start with creating the visualizations or graphics first without g...
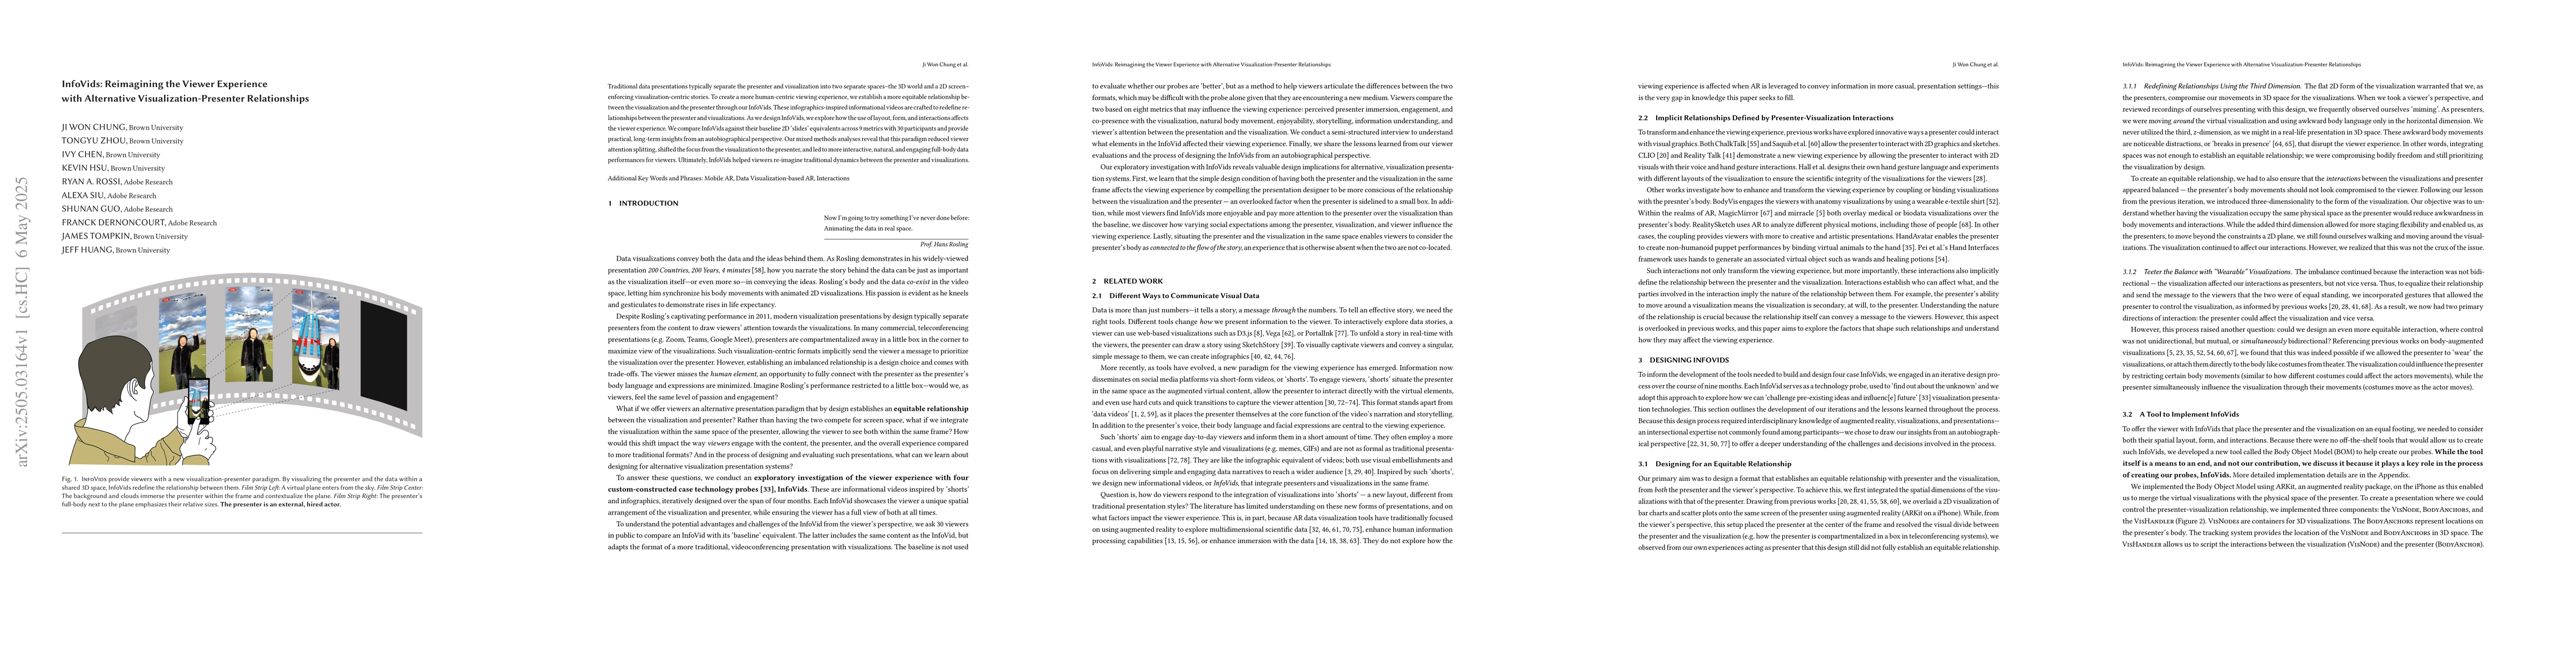
Traditional data presentations typically separate the presenter and visualization into two separate spaces--the 3D world and a 2D screen--enforcing visualization-centric stories. To create a more huma...
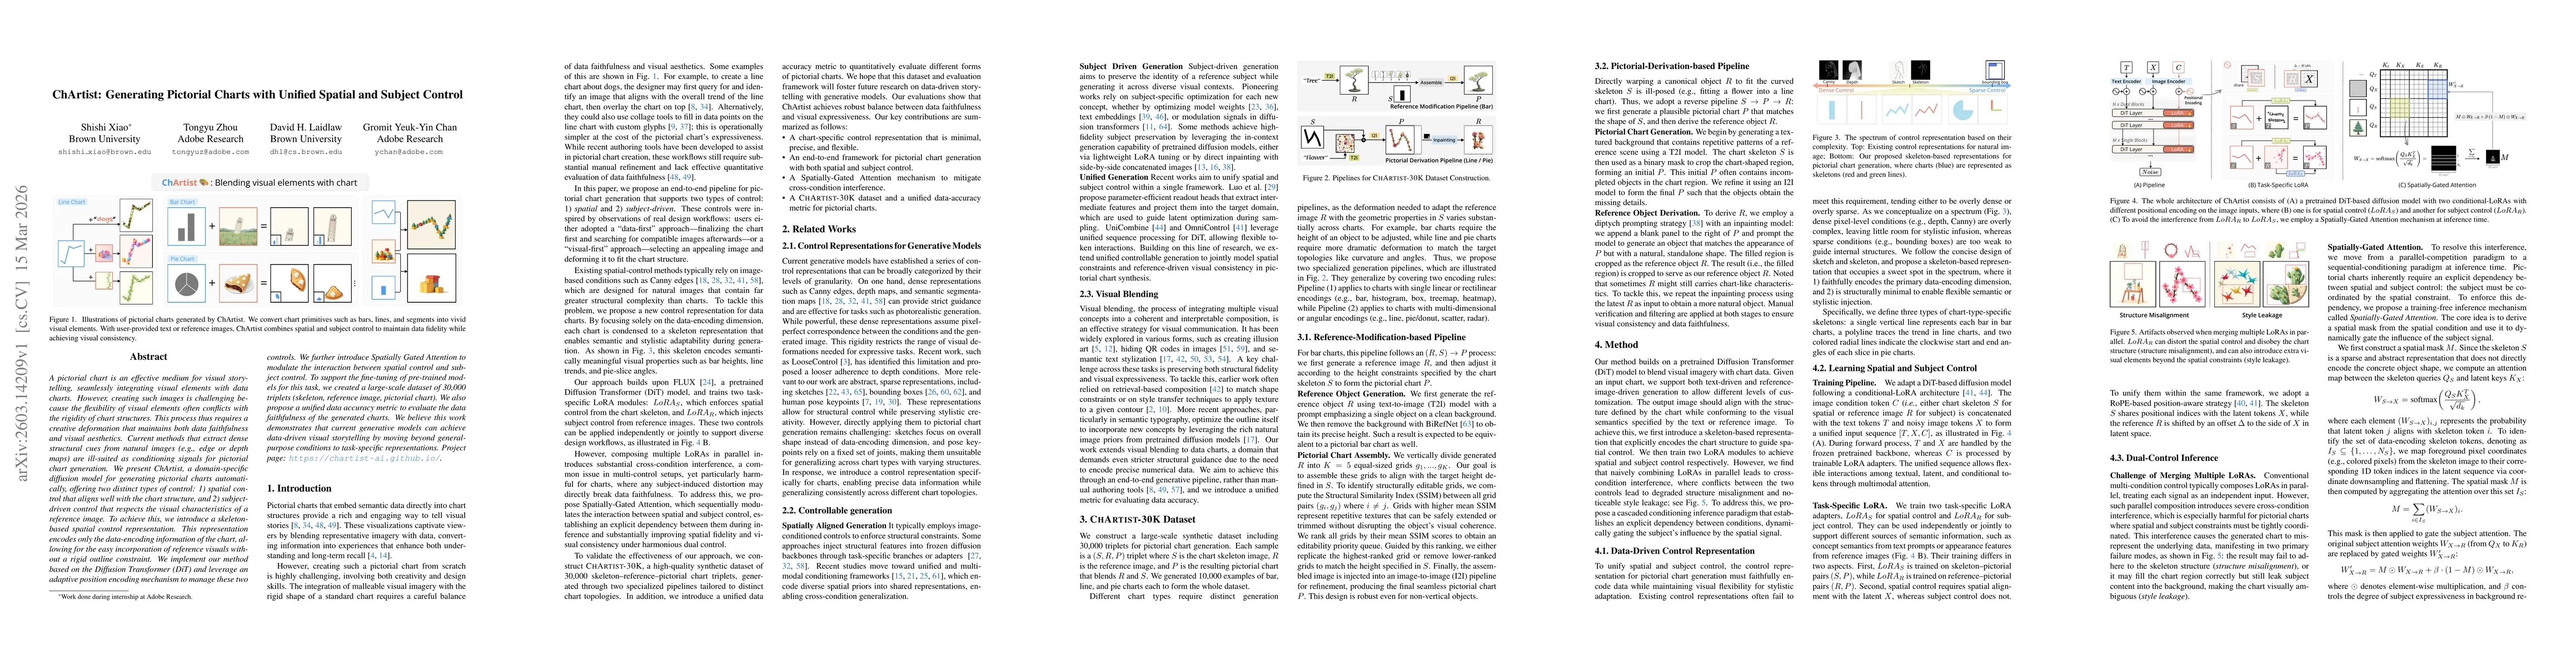
A pictorial chart is an effective medium for visual storytelling, seamlessly integrating visual elements with data charts. However, creating such images is challenging because the flexibility of visua...