InfoVids: Reimagining the Viewer Experience with Alternative Visualization-Presenter Relationships
Publication
Metrics
AI Quick Summary
InfoVids redefines the viewer experience by establishing a more human-centric relationship between presenters and visualizations, leading to more engaging and interactive presentations compared to traditional 2D slides. Our mixed methods analysis shows InfoVids reduce attention splitting and enhance full-body engagement.
Paper Preview
Abstract
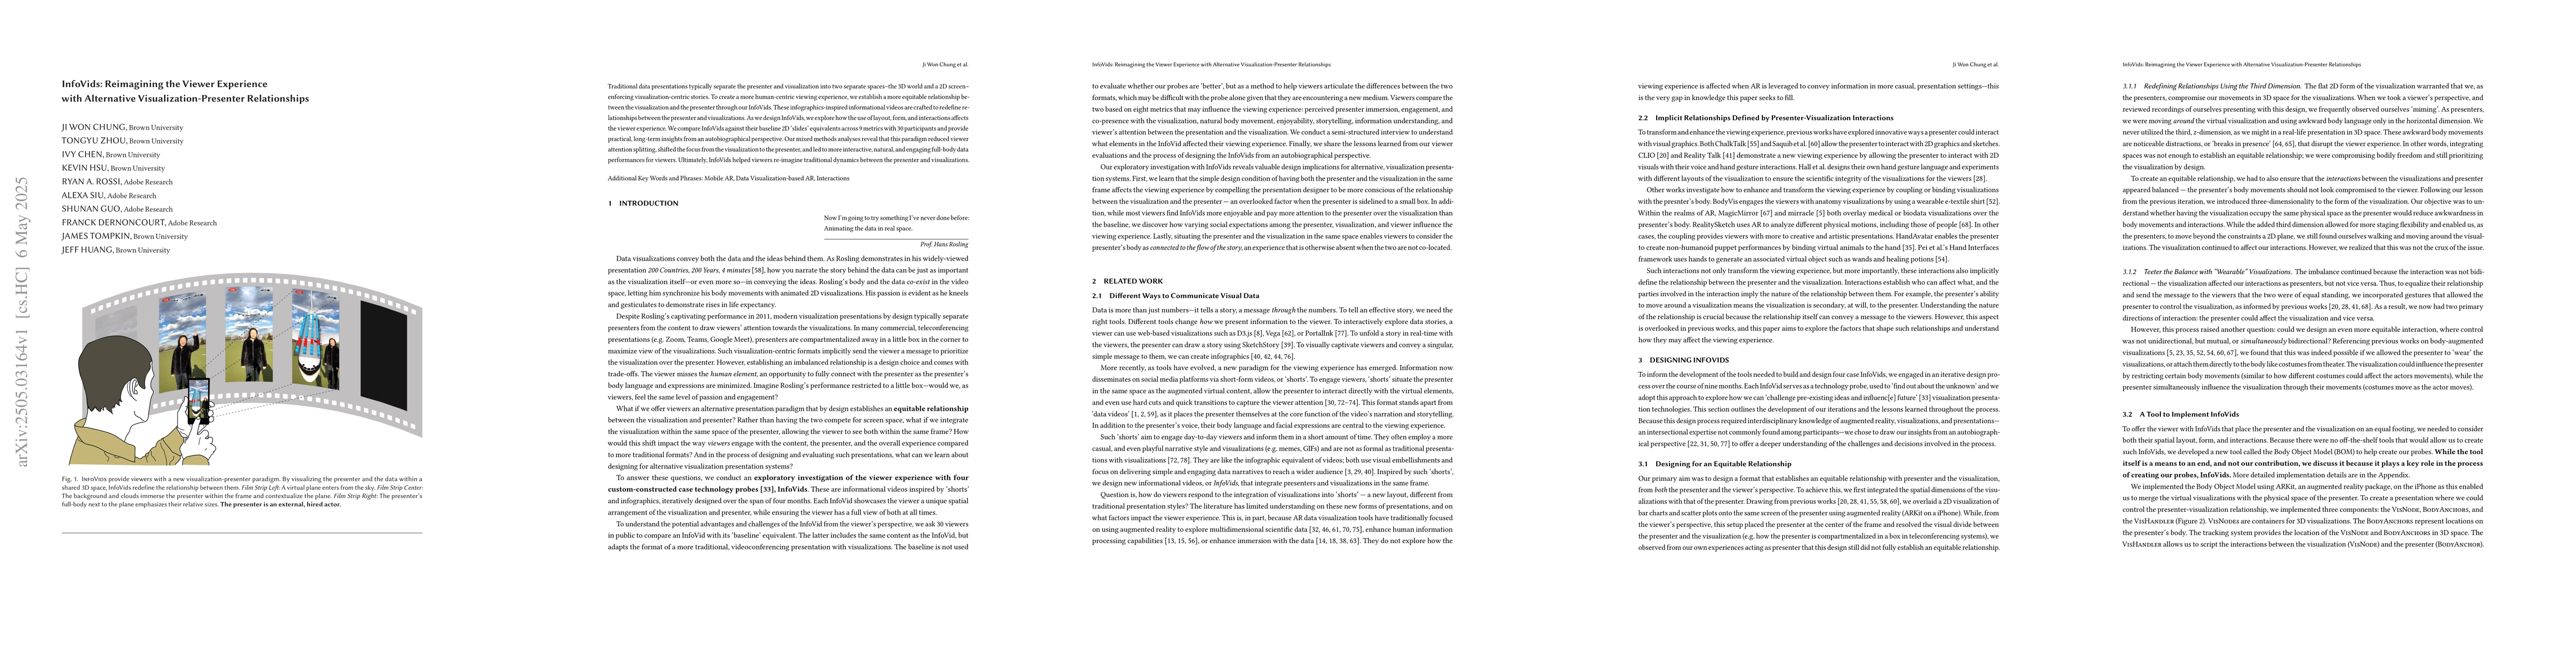
Traditional data presentations typically separate the presenter and visualization into two separate spaces--the 3D world and a 2D screen--enforcing visualization-centric stories. To create a more human-centric viewing experience, we establish a more equitable relationship between the visualization and the presenter through our InfoVids. These infographics-inspired informational videos are crafted to redefine relationships between the presenter and visualizations. As we design InfoVids, we explore how the use of layout, form, and interactions affects the viewer experience. We compare InfoVids against their baseline 2D `slides' equivalents across 9 metrics with 30 participants and provide practical, long-term insights from an autobiographical perspective. Our mixed methods analyses reveal that this paradigm reduced viewer attention splitting, shifted the focus from the visualization to the presenter, and led to more interactive, natural, and engaging full-body data performances for viewers. Ultimately, InfoVids helped viewers re-imagine traditional dynamics between the presenter and visualizations.
AI Key Findings
Get AI-generated insights about this paper's methodology, results, significance, and more — seven facets brought into focus.
Impact
Authors
PDF Preview
Citation Network
Current paper (gray), citations (green), references (blue)
Display is limited for performance on very large graphs.
Discussion 0