Academic Profile
Statistics
Similar Authors
Papers on arXiv
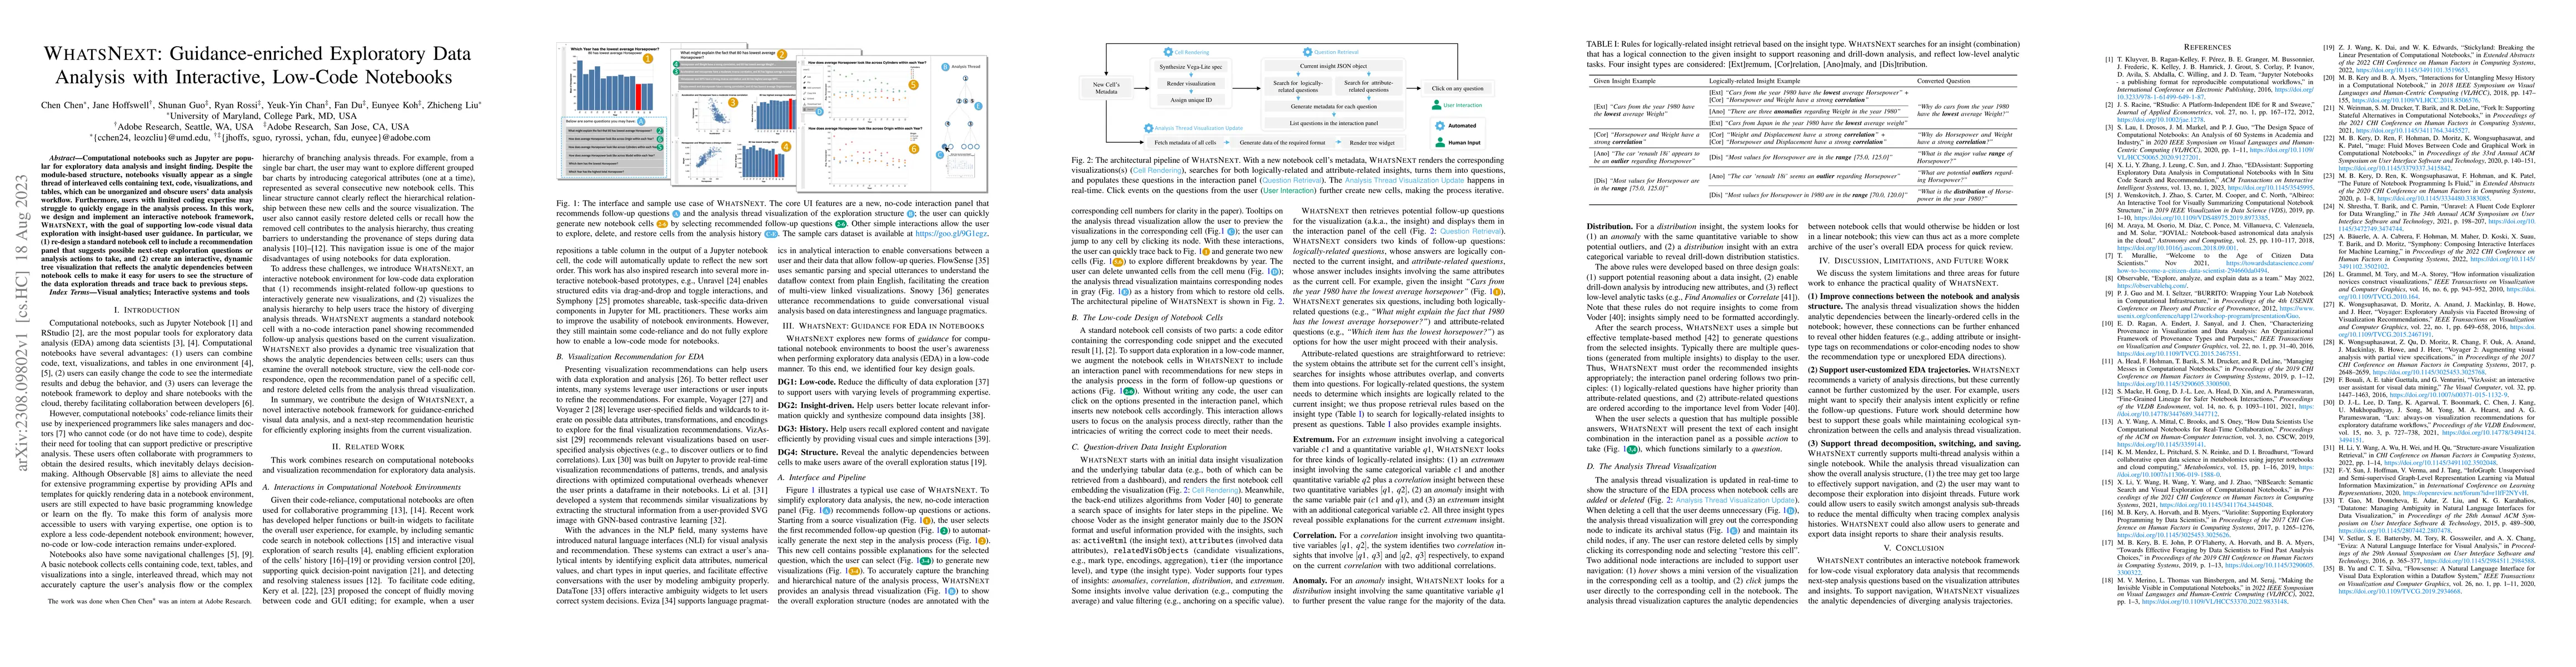
Computational notebooks such as Jupyter are popular for exploratory data analysis and insight finding. Despite the module-based structure, notebooks visually appear as a single thread of interleaved...
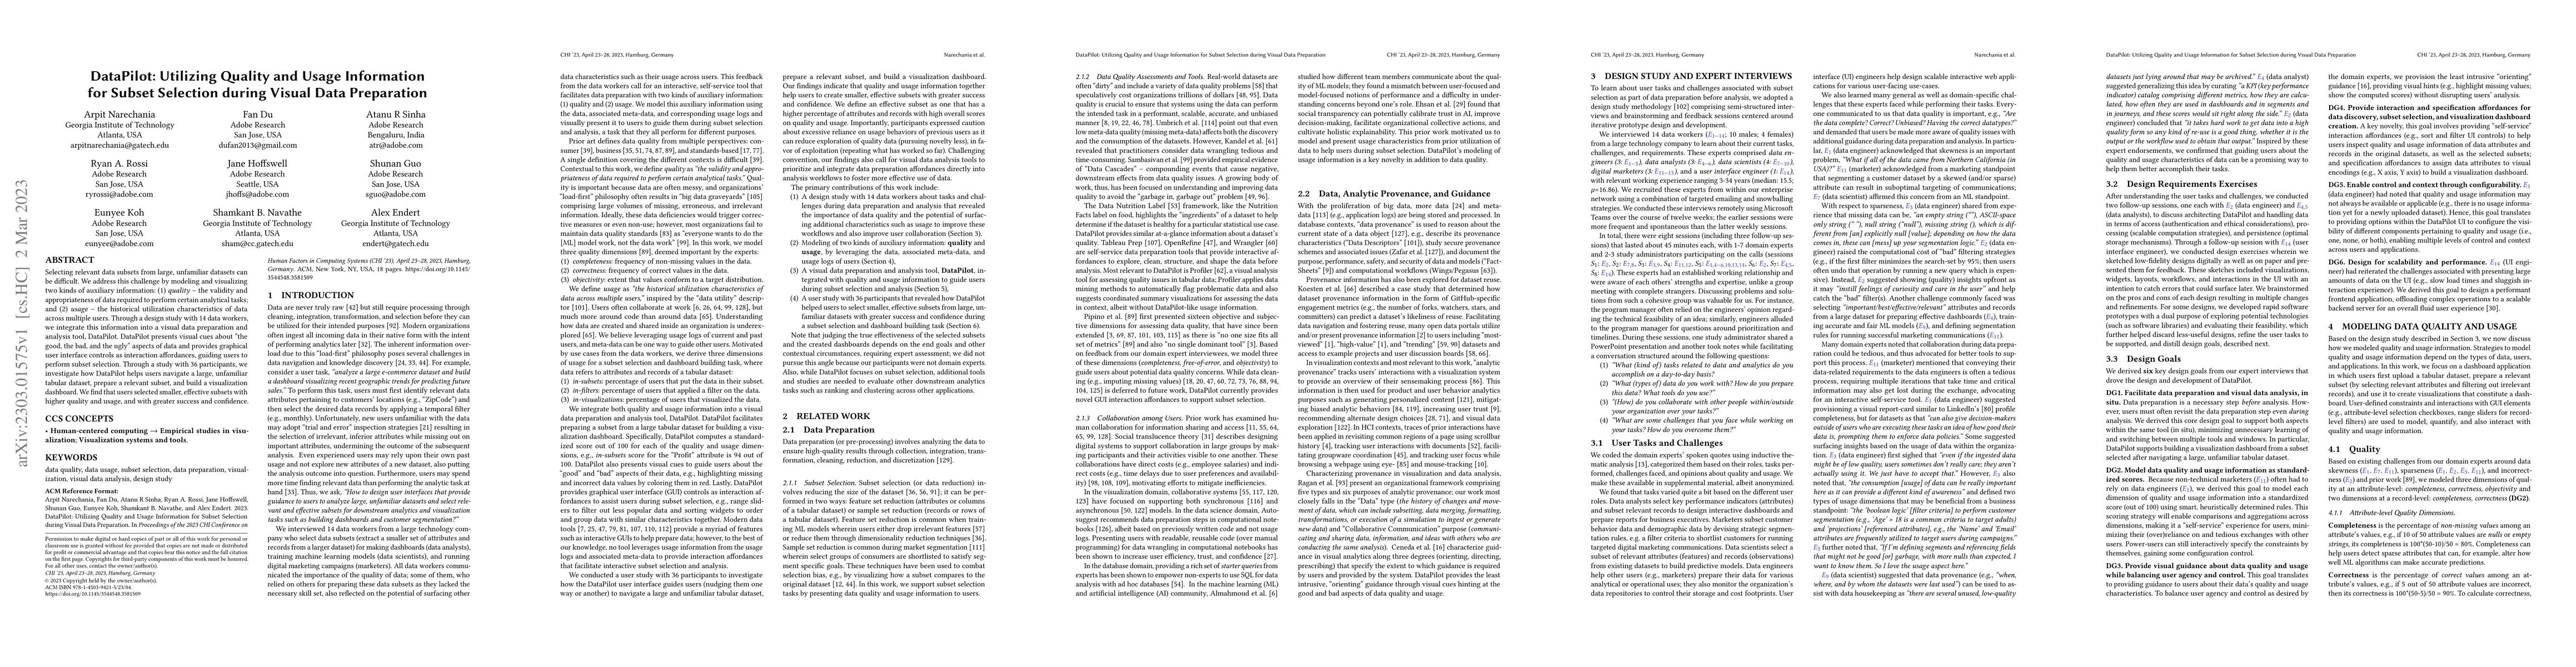
Selecting relevant data subsets from large, unfamiliar datasets can be difficult. We address this challenge by modeling and visualizing two kinds of auxiliary information: (1) quality - the validity...
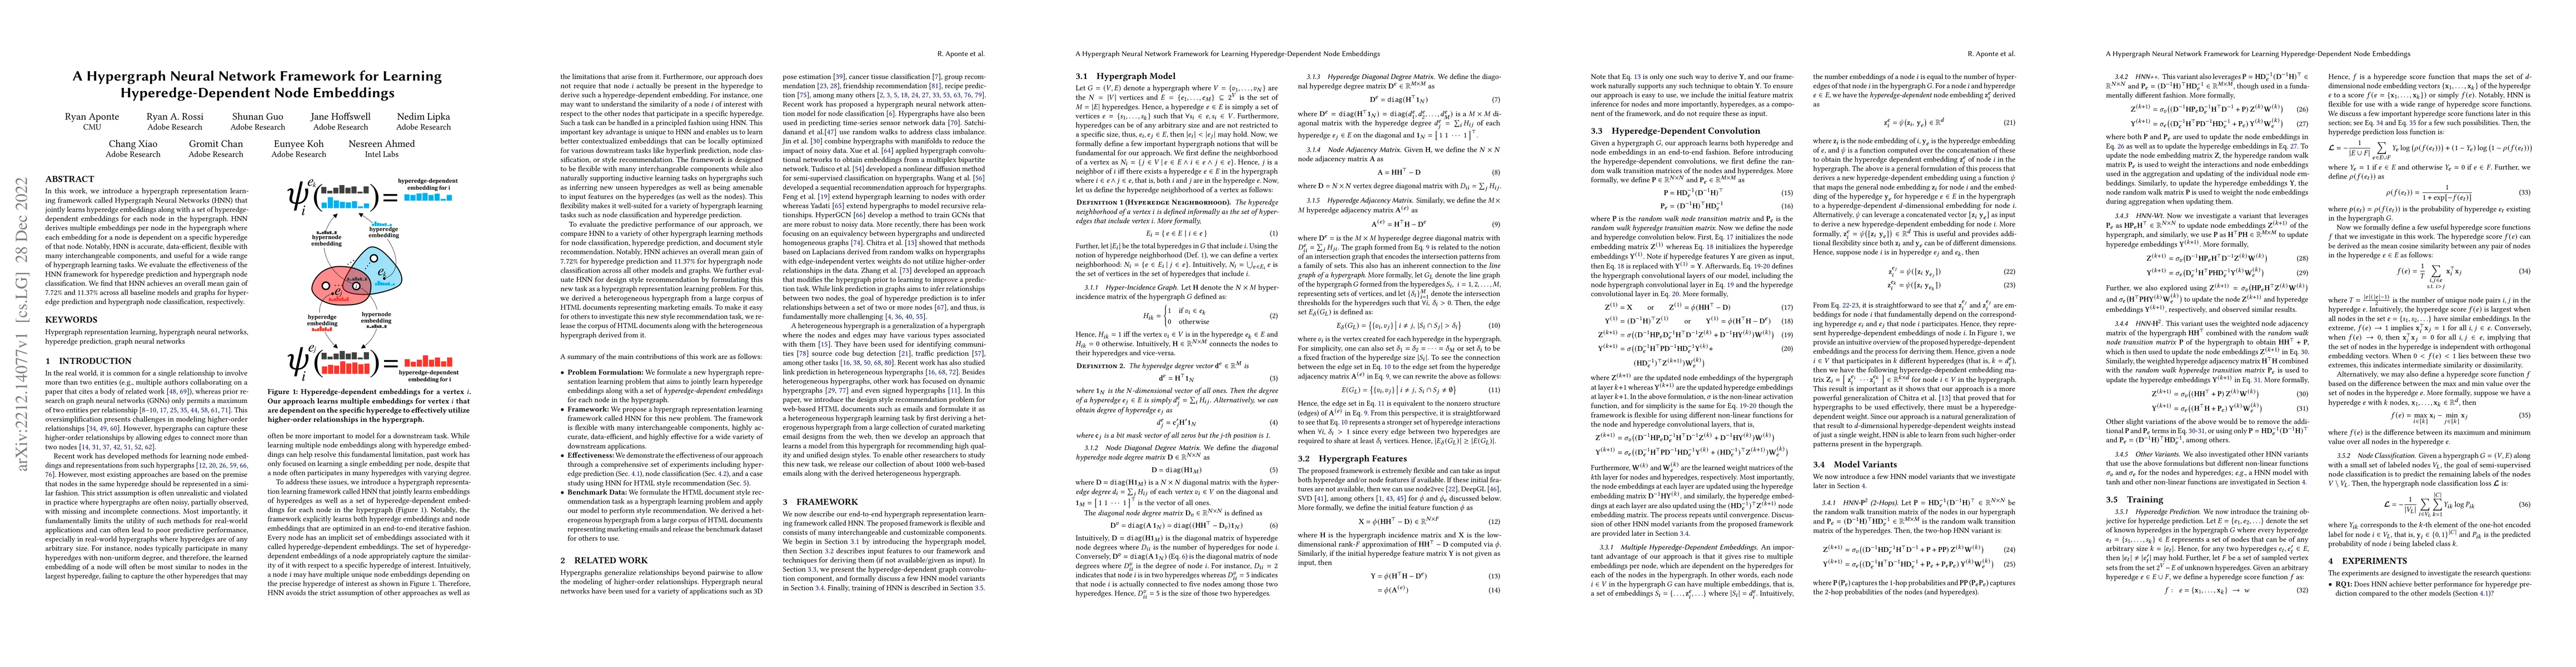
In this work, we introduce a hypergraph representation learning framework called Hypergraph Neural Networks (HNN) that jointly learns hyperedge embeddings along with a set of hyperedge-dependent emb...
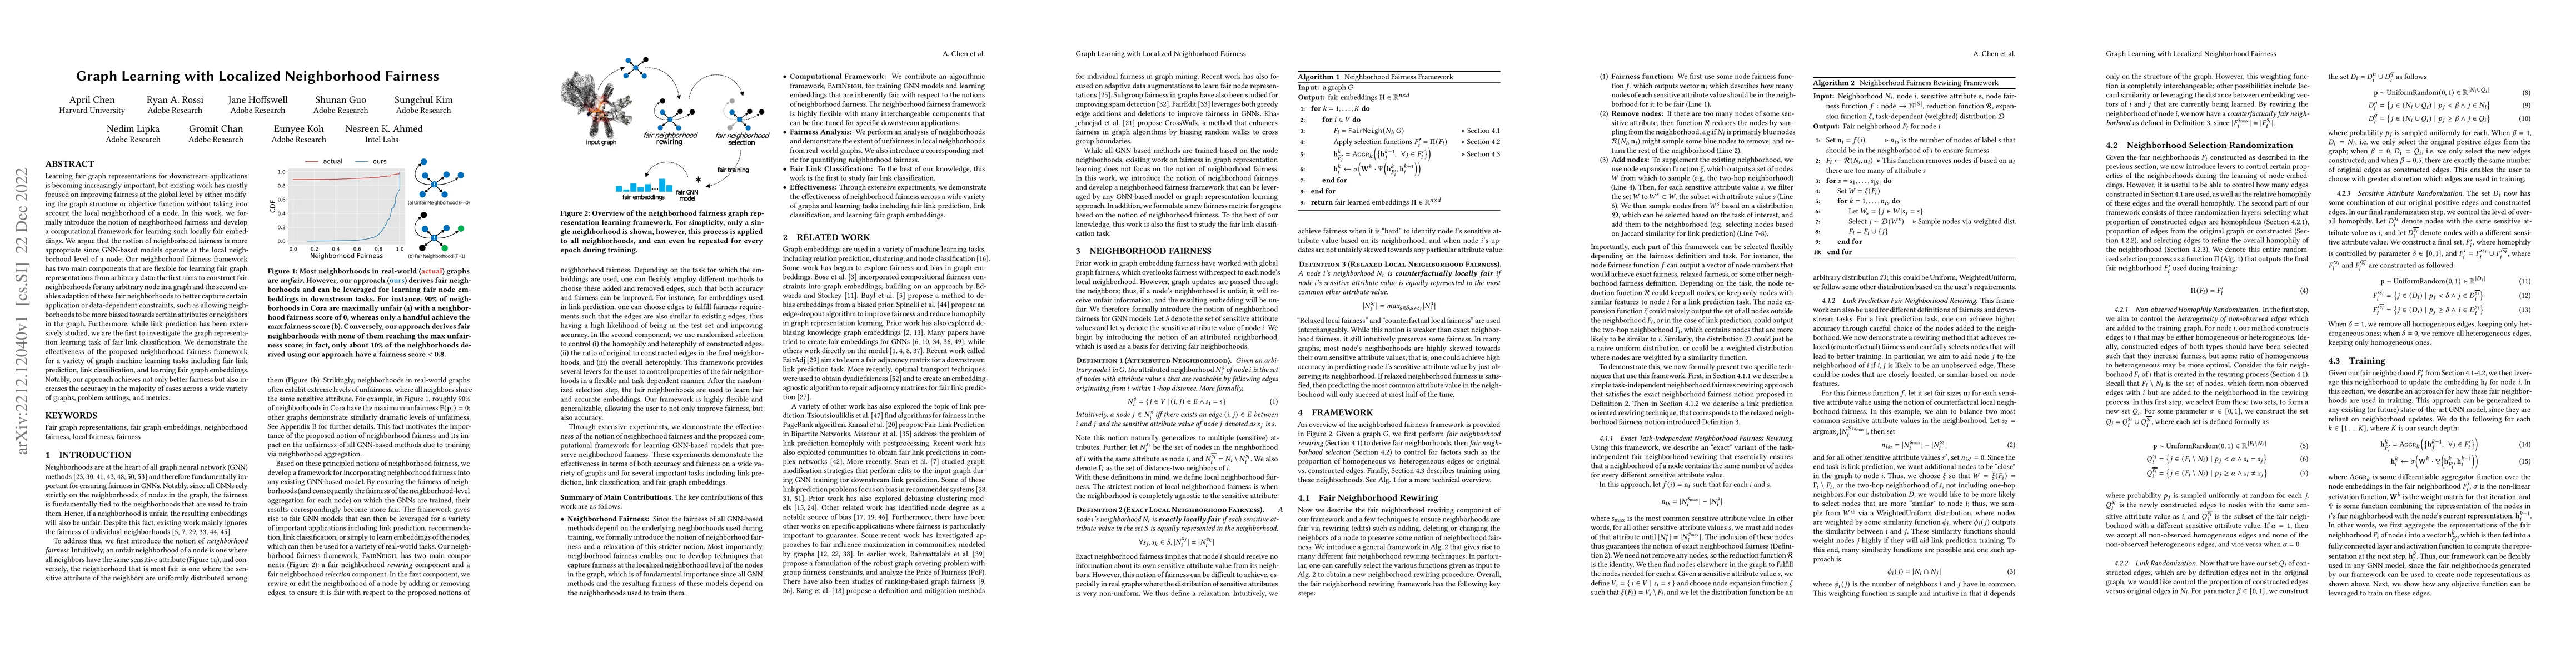
Learning fair graph representations for downstream applications is becoming increasingly important, but existing work has mostly focused on improving fairness at the global level by either modifying...
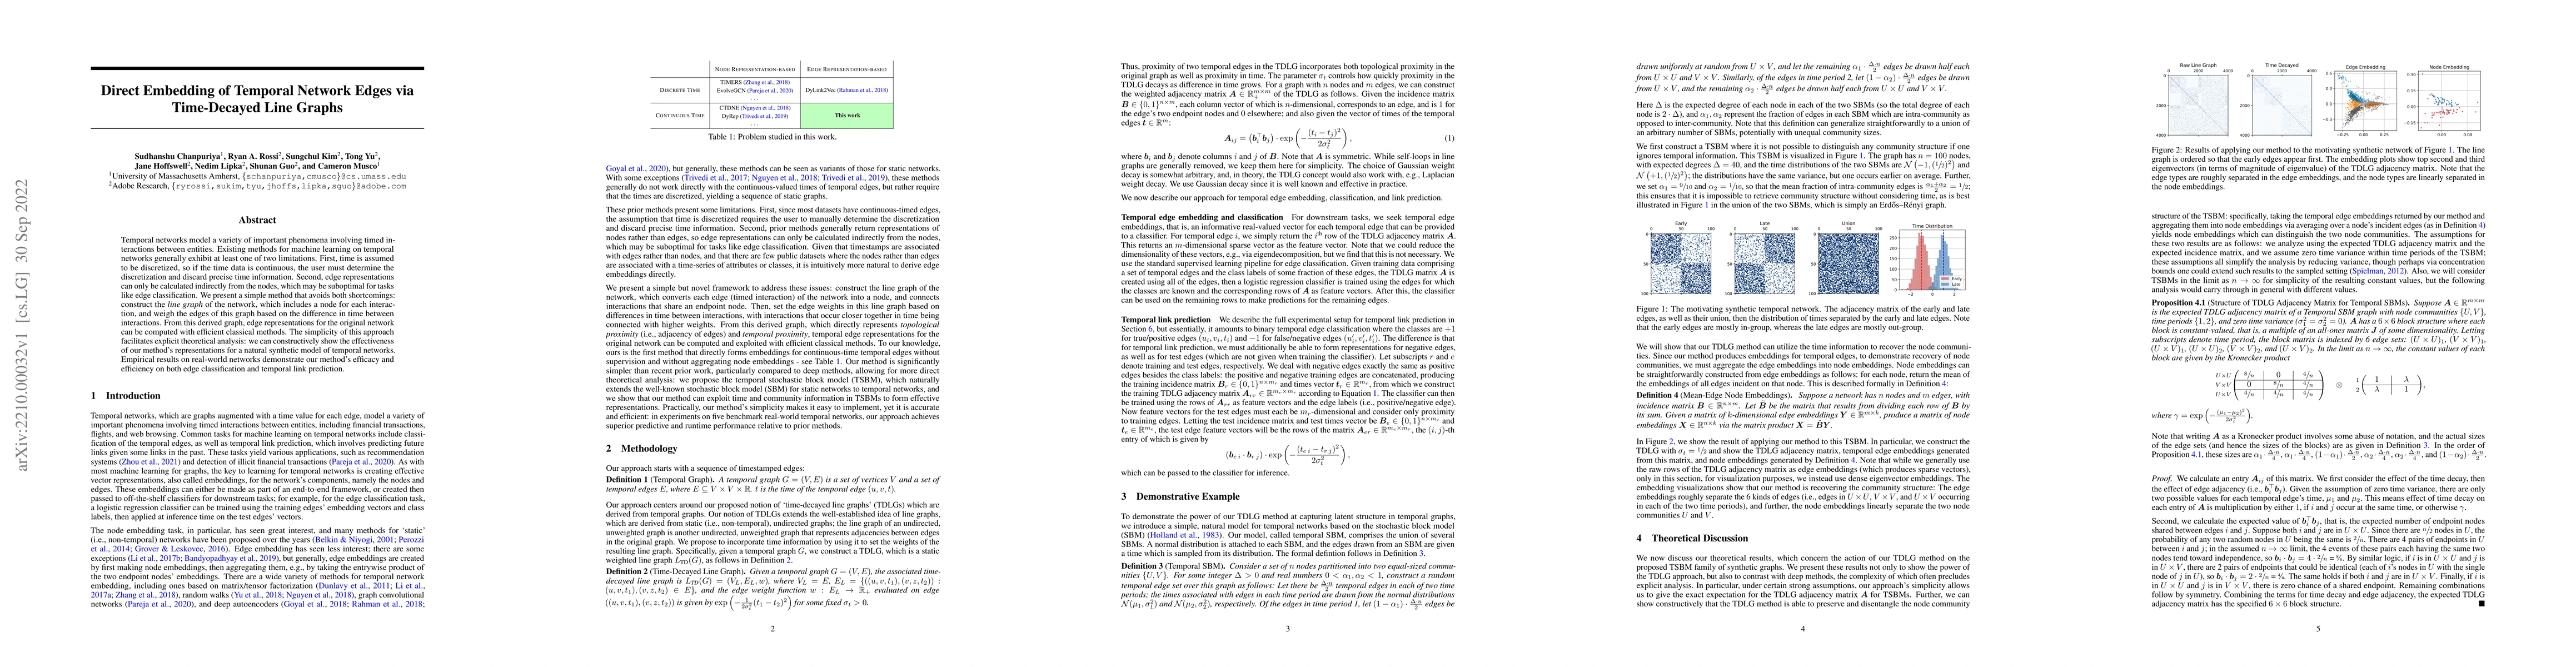
Temporal networks model a variety of important phenomena involving timed interactions between entities. Existing methods for machine learning on temporal networks generally exhibit at least one of t...
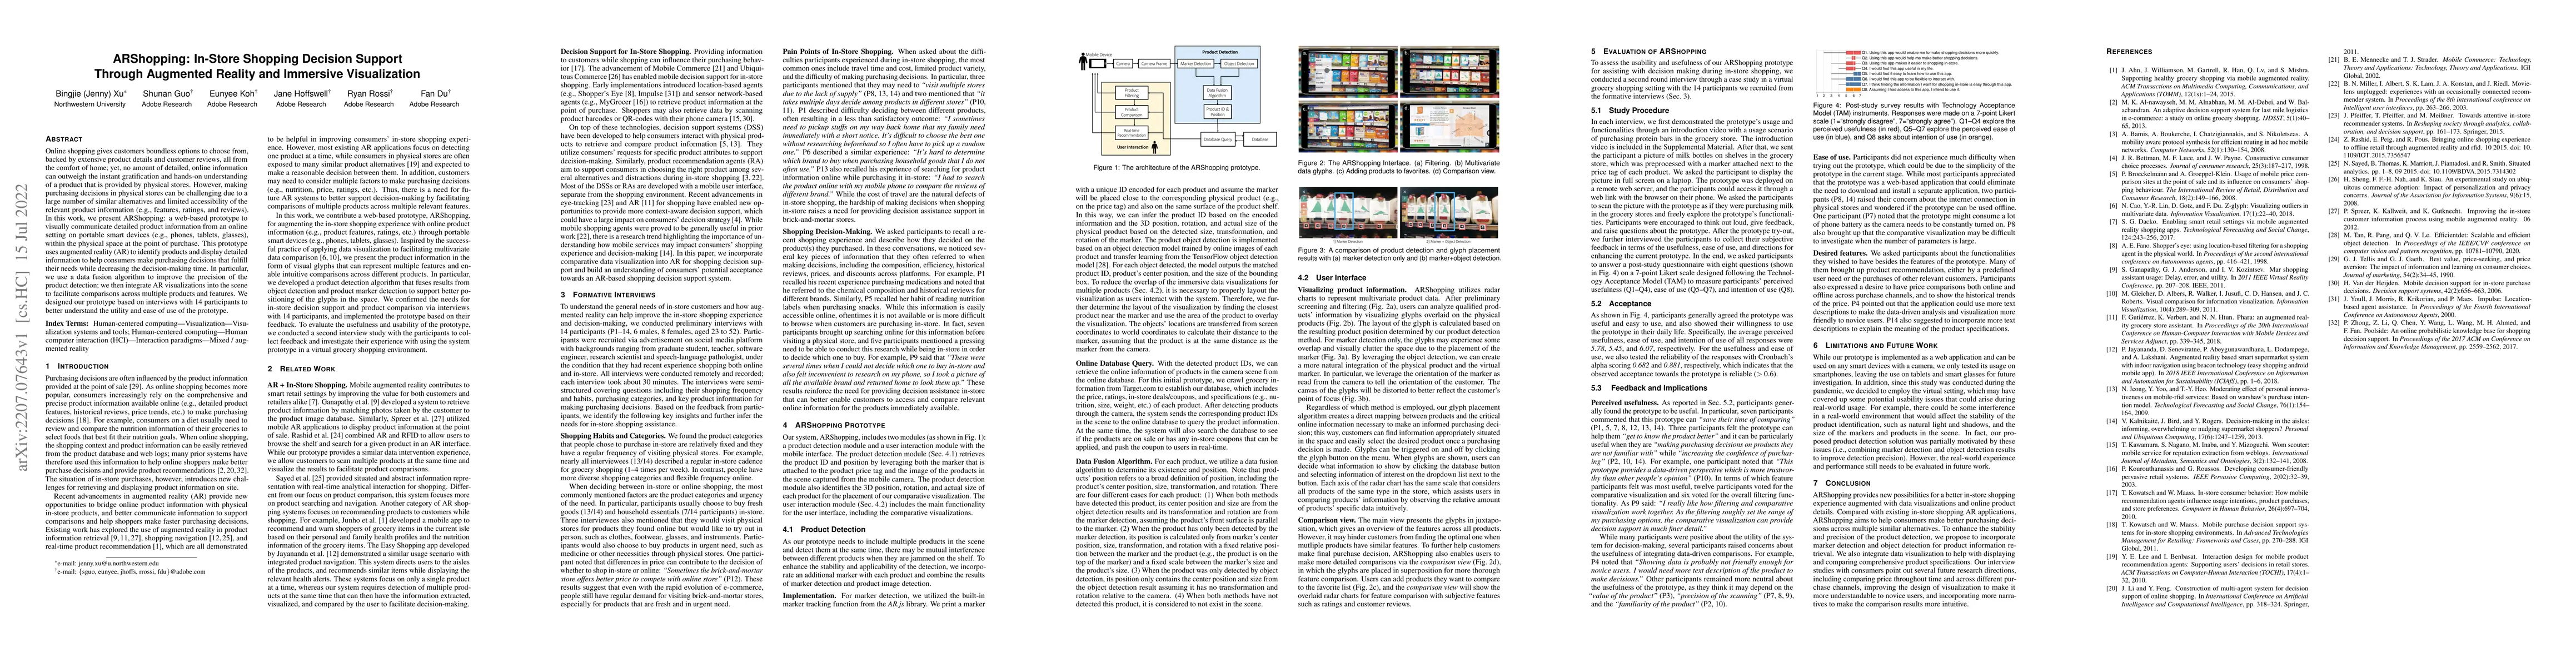
Online shopping gives customers boundless options to choose from, backed by extensive product details and customer reviews, all from the comfort of home; yet, no amount of detailed, online informati...
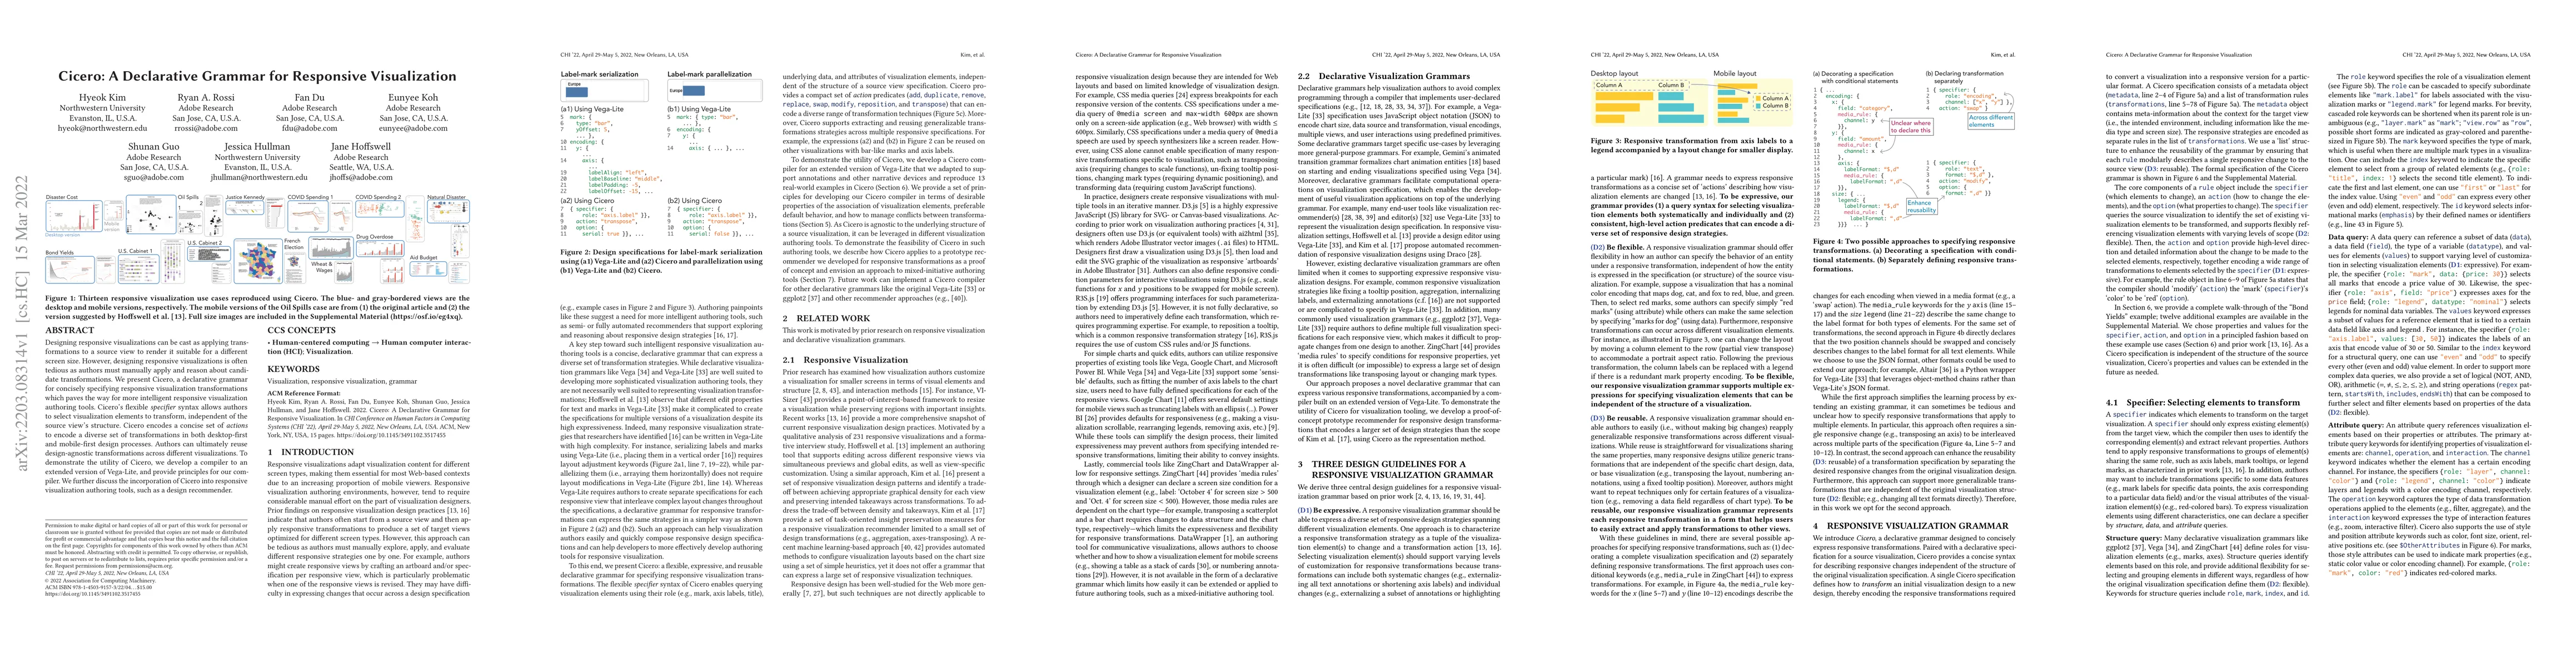
Designing responsive visualizations can be cast as applying transformations to a source view to render it suitable for a different screen size. However, designing responsive visualizations is often ...

Causality is crucial to understanding the mechanisms behind complex systems and making decisions that lead to intended outcomes. Event sequence data is widely collected from many real-world processe...
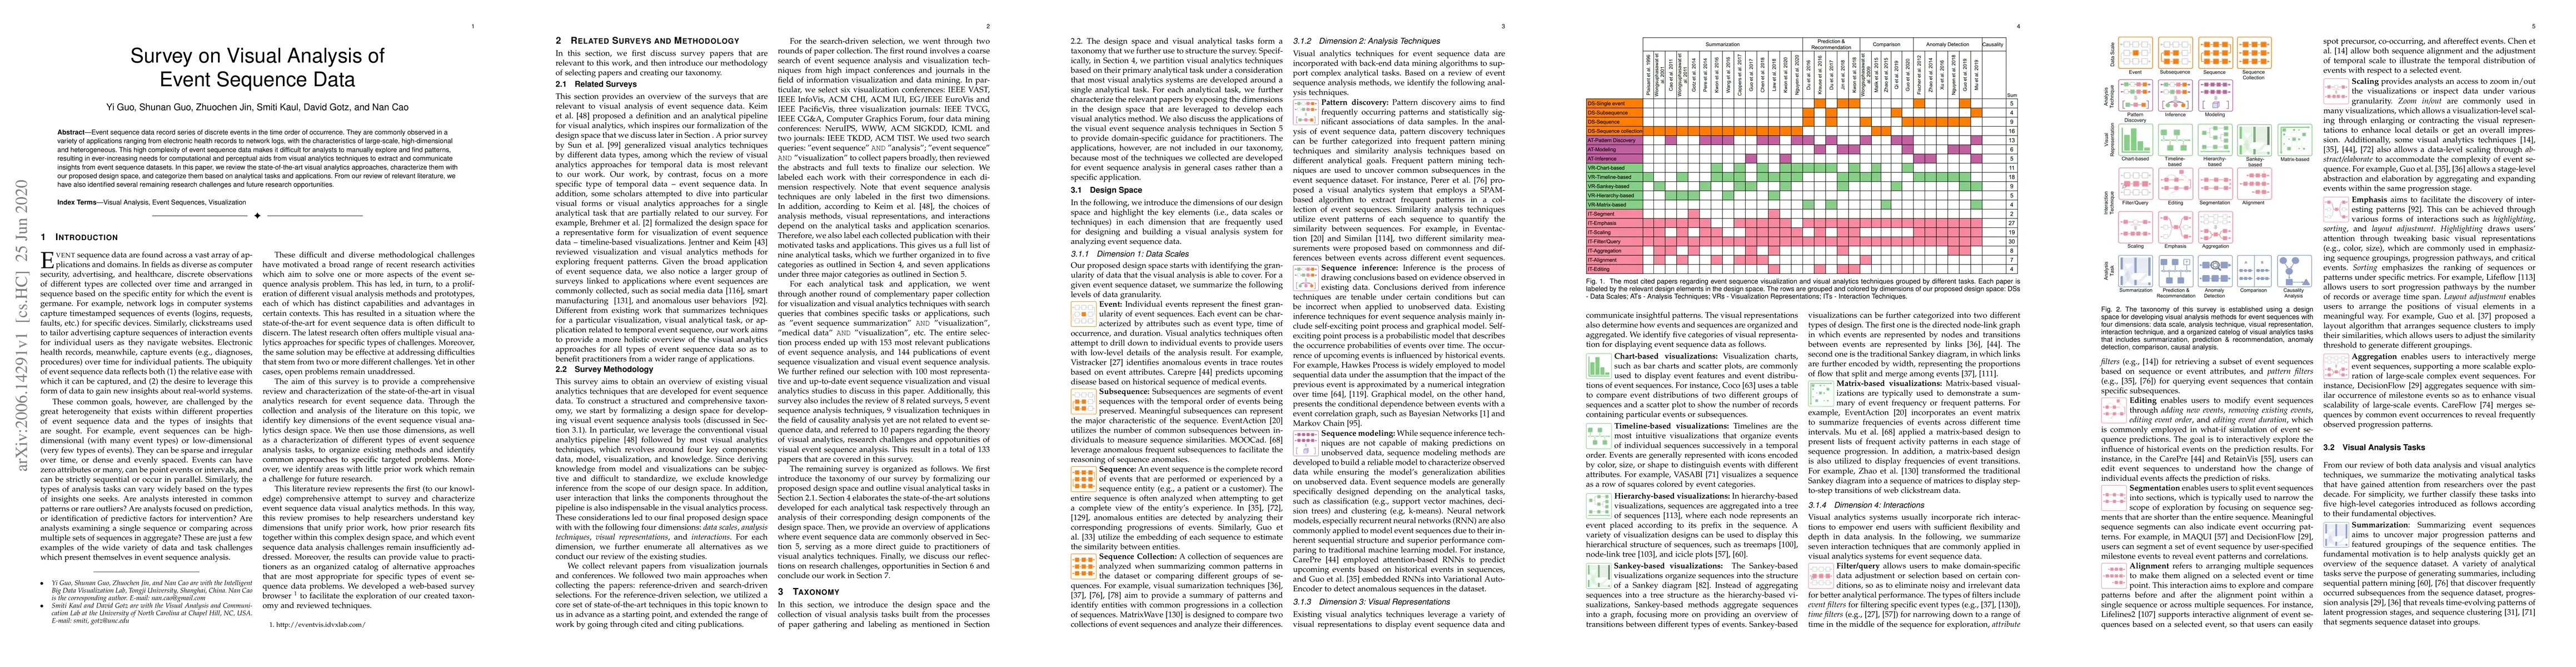
Event sequence data record series of discrete events in the time order of occurrence. They are commonly observed in a variety of applications ranging from electronic health records to network logs, ...
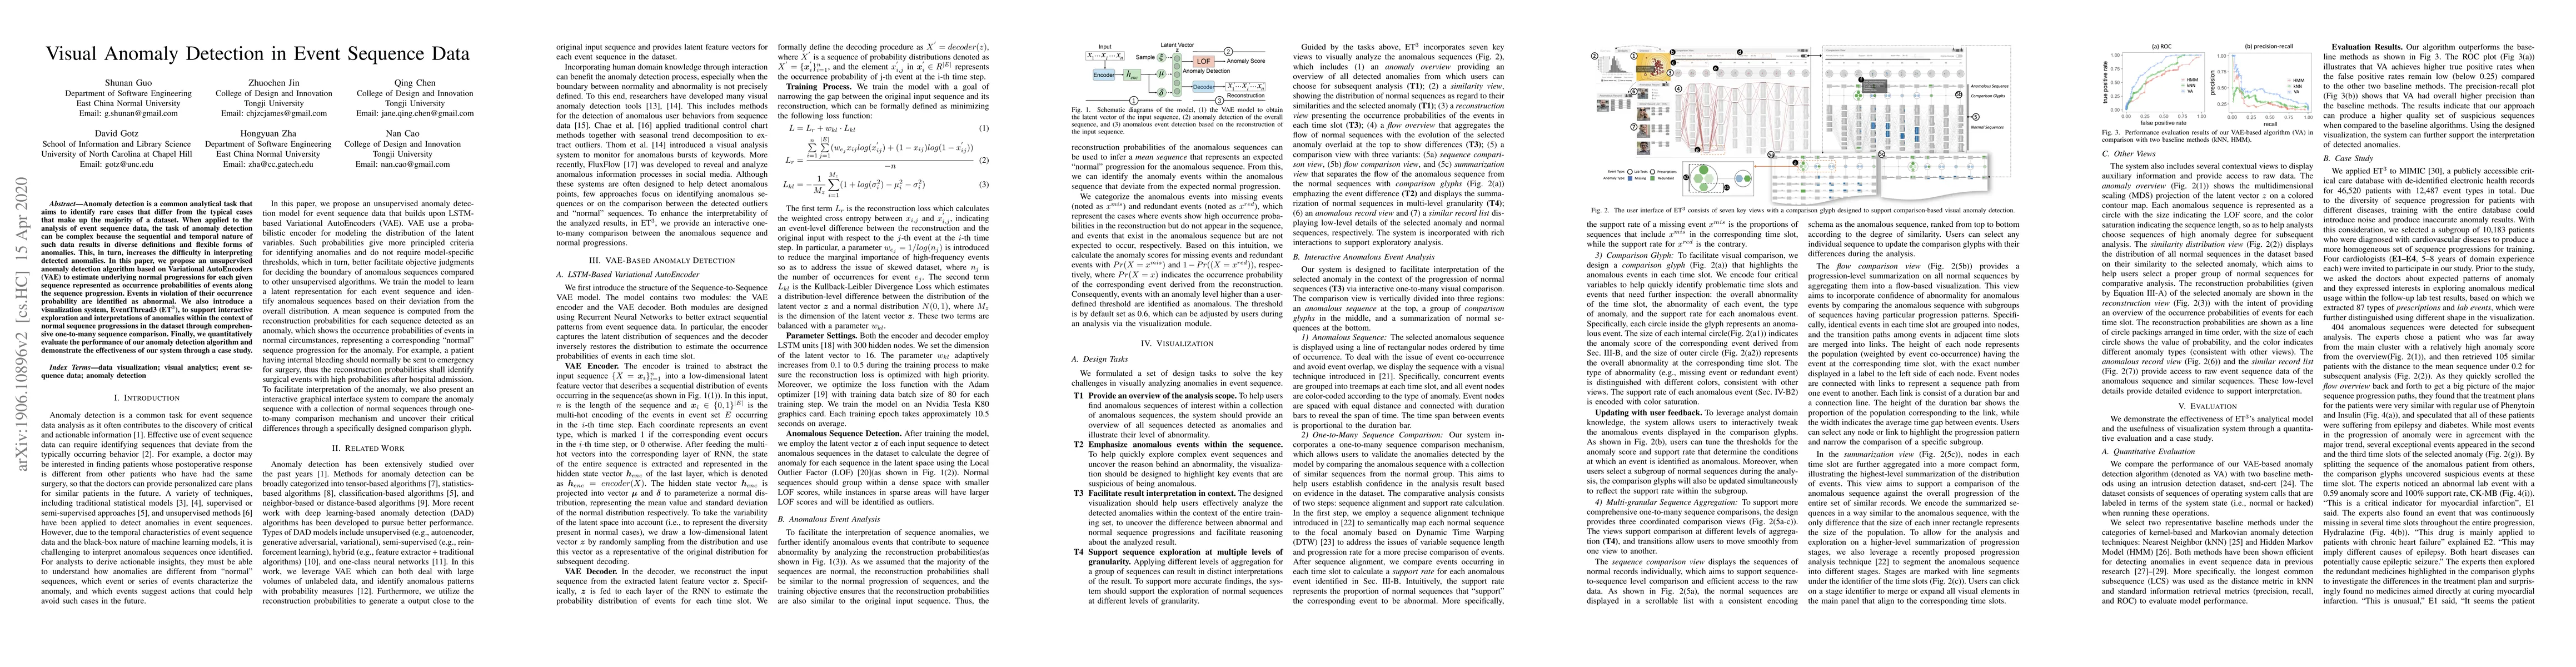
Anomaly detection is a common analytical task that aims to identify rare cases that differ from the typical cases that make up the majority of a dataset. When applied to the analysis of event sequen...
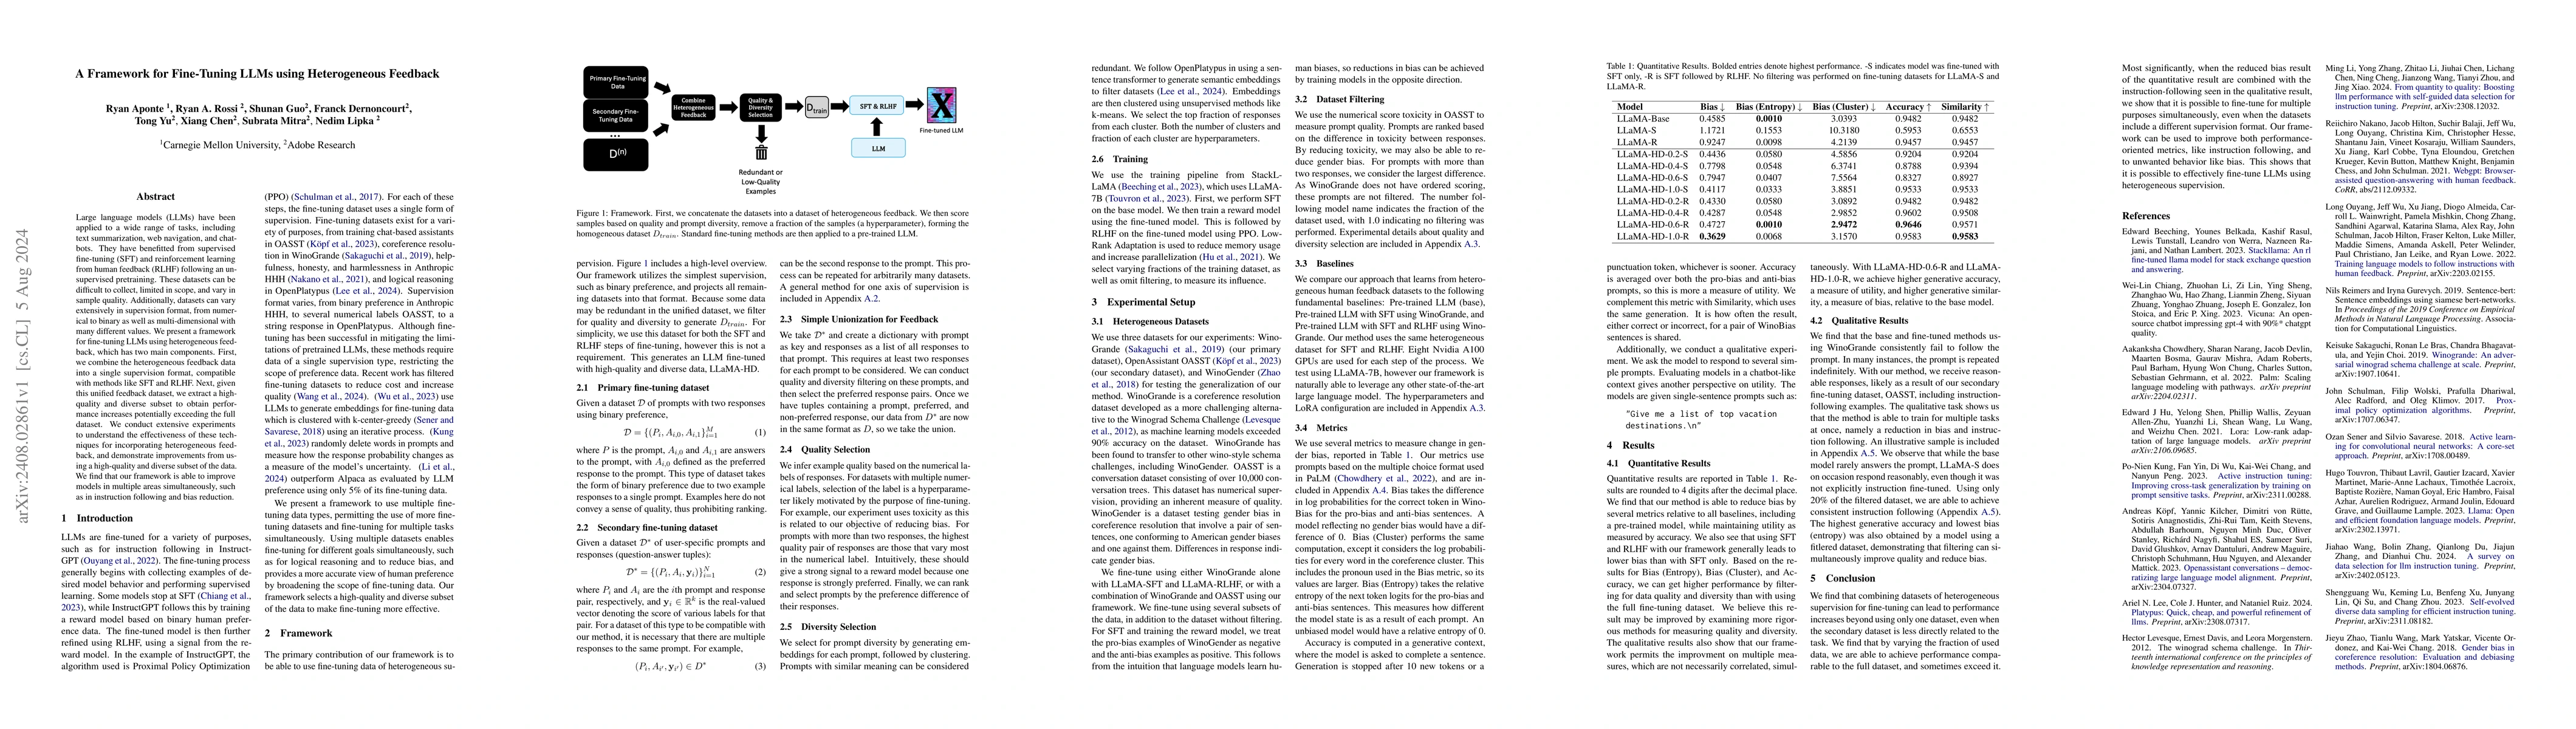
Large language models (LLMs) have been applied to a wide range of tasks, including text summarization, web navigation, and chatbots. They have benefitted from supervised fine-tuning (SFT) and reinforc...
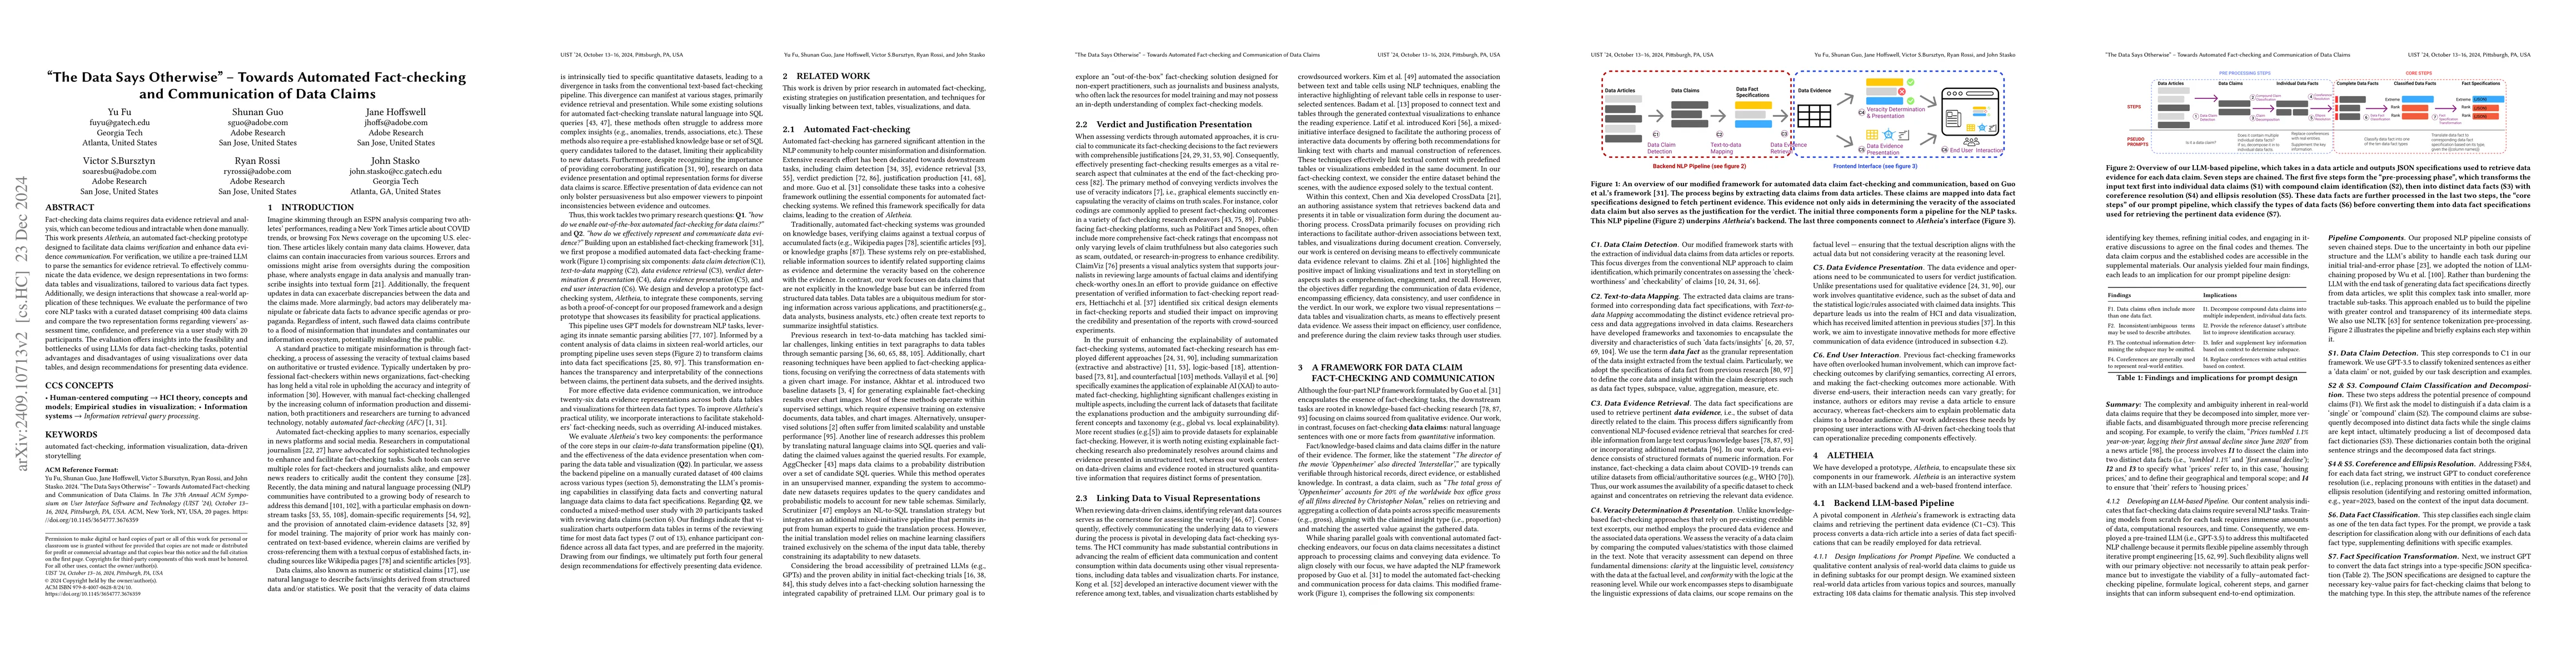
Fact-checking data claims requires data evidence retrieval and analysis, which can become tedious and intractable when done manually. This work presents Aletheia, an automated fact-checking prototype ...
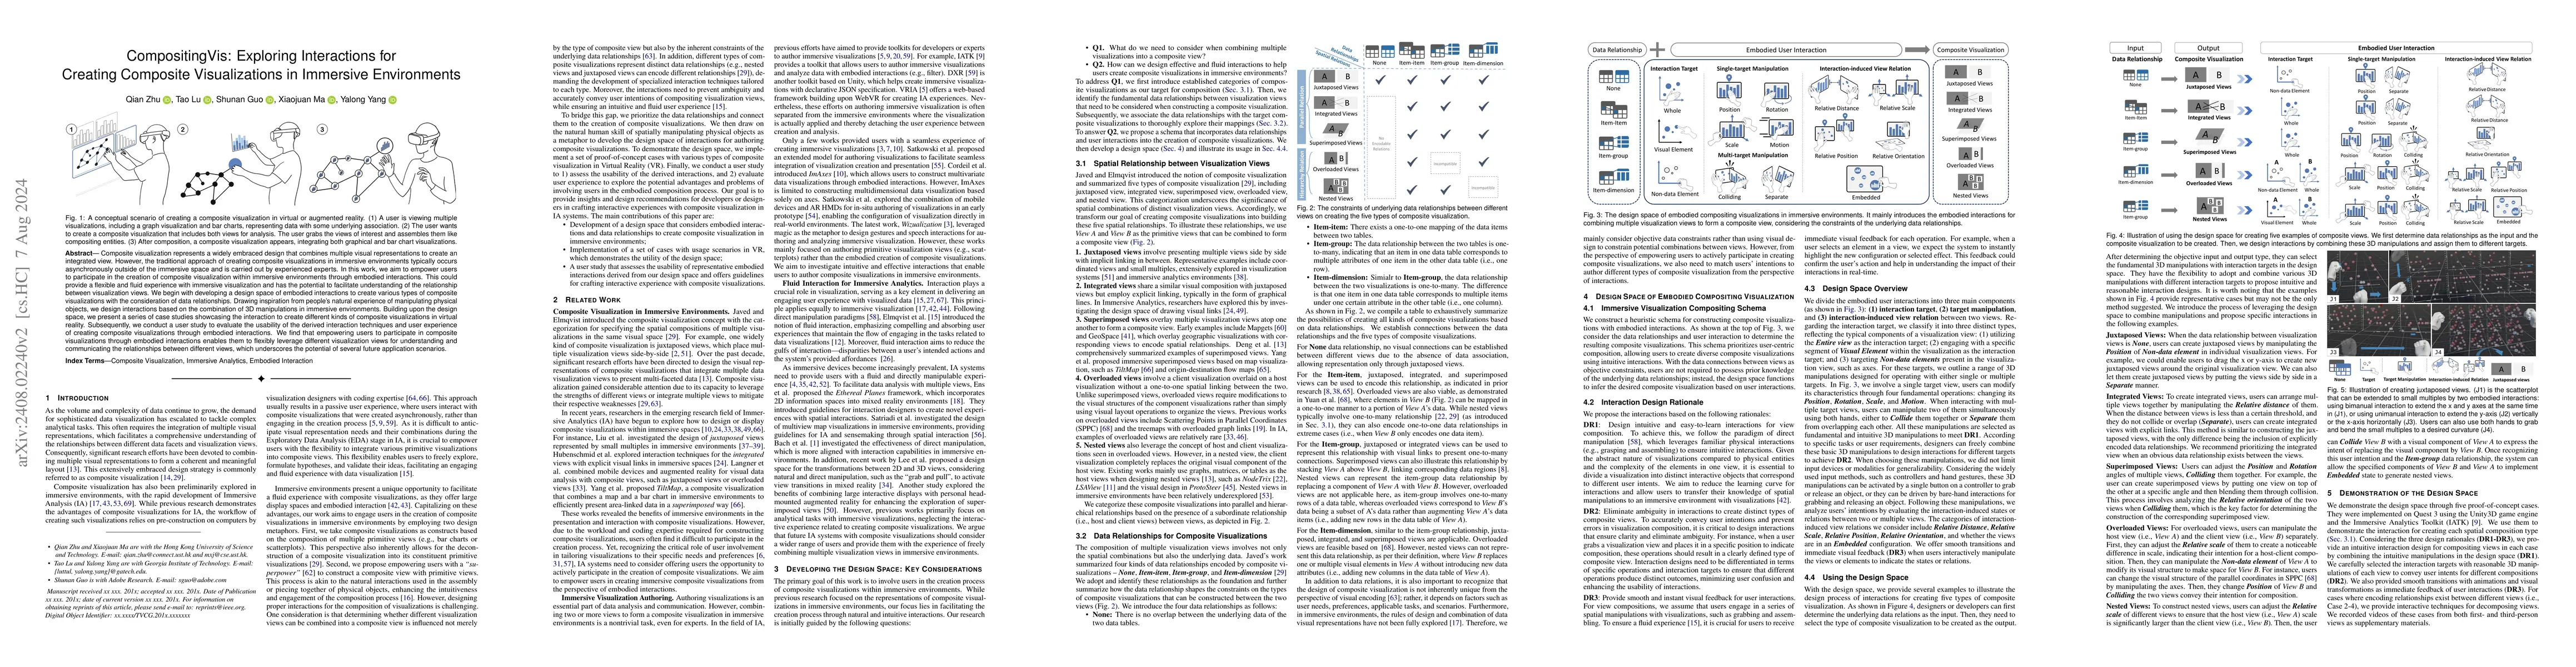
Composite visualization represents a widely embraced design that combines multiple visual representations to create an integrated view. However, the traditional approach of creating composite visualiz...
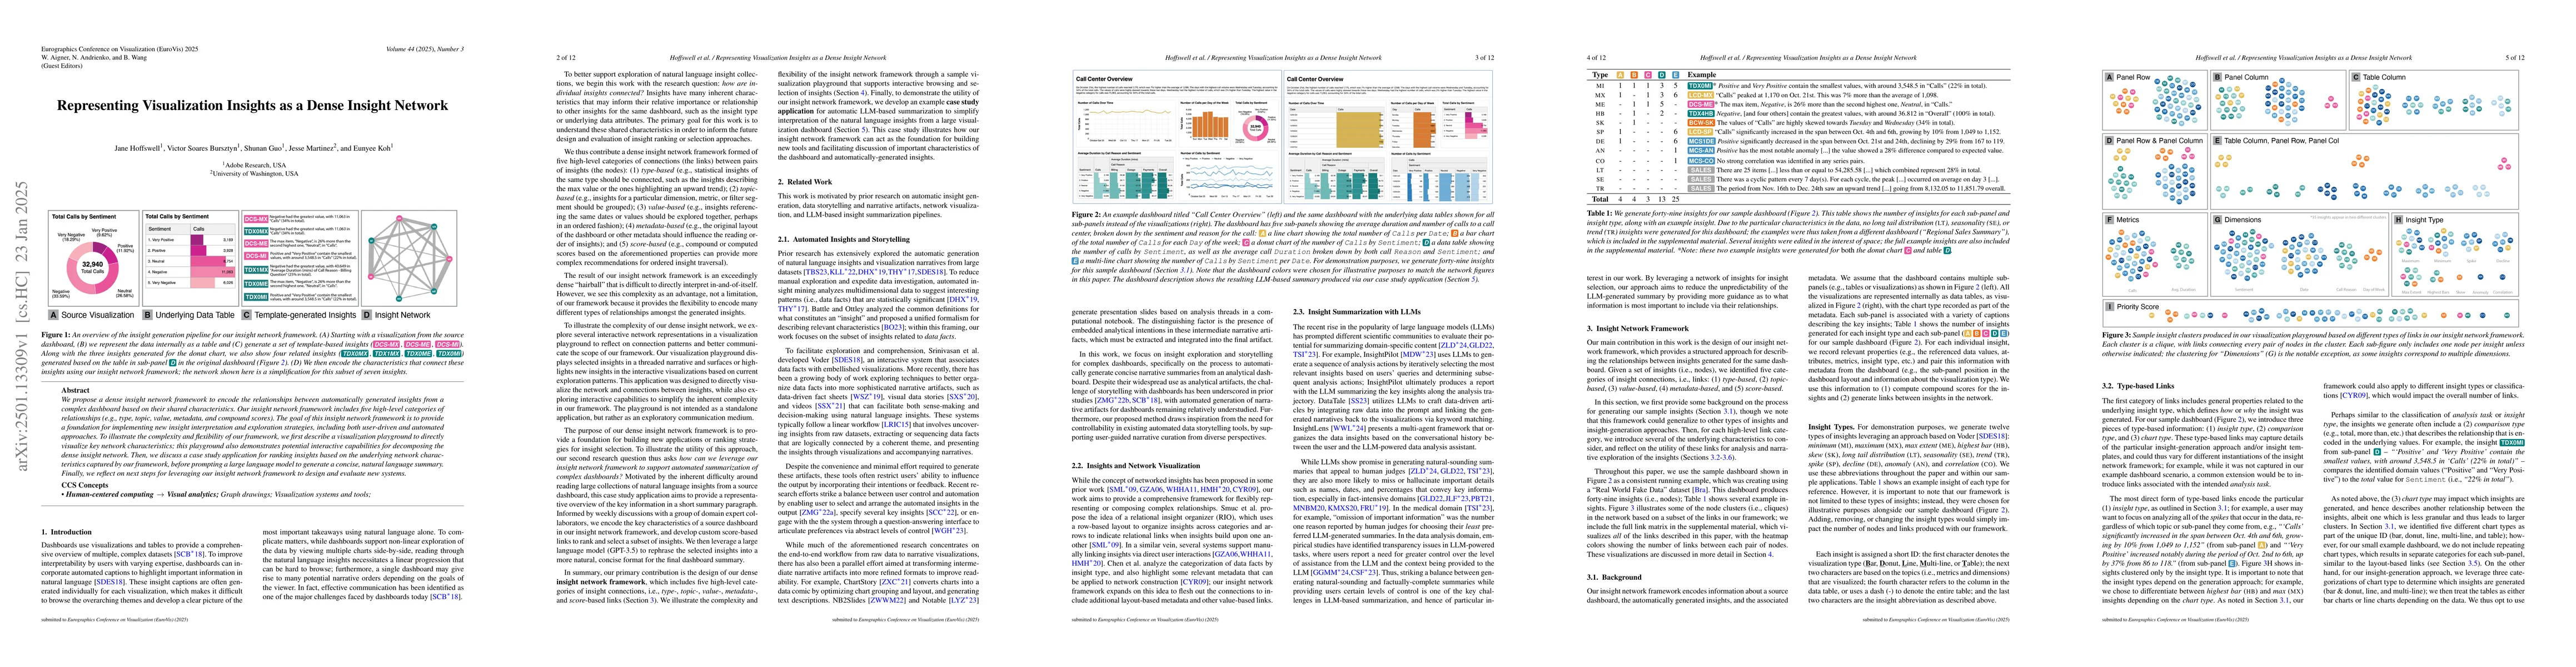
We propose a dense insight network framework to encode the relationships between automatically generated insights from a complex dashboard based on their shared characteristics. Our insight network fr...
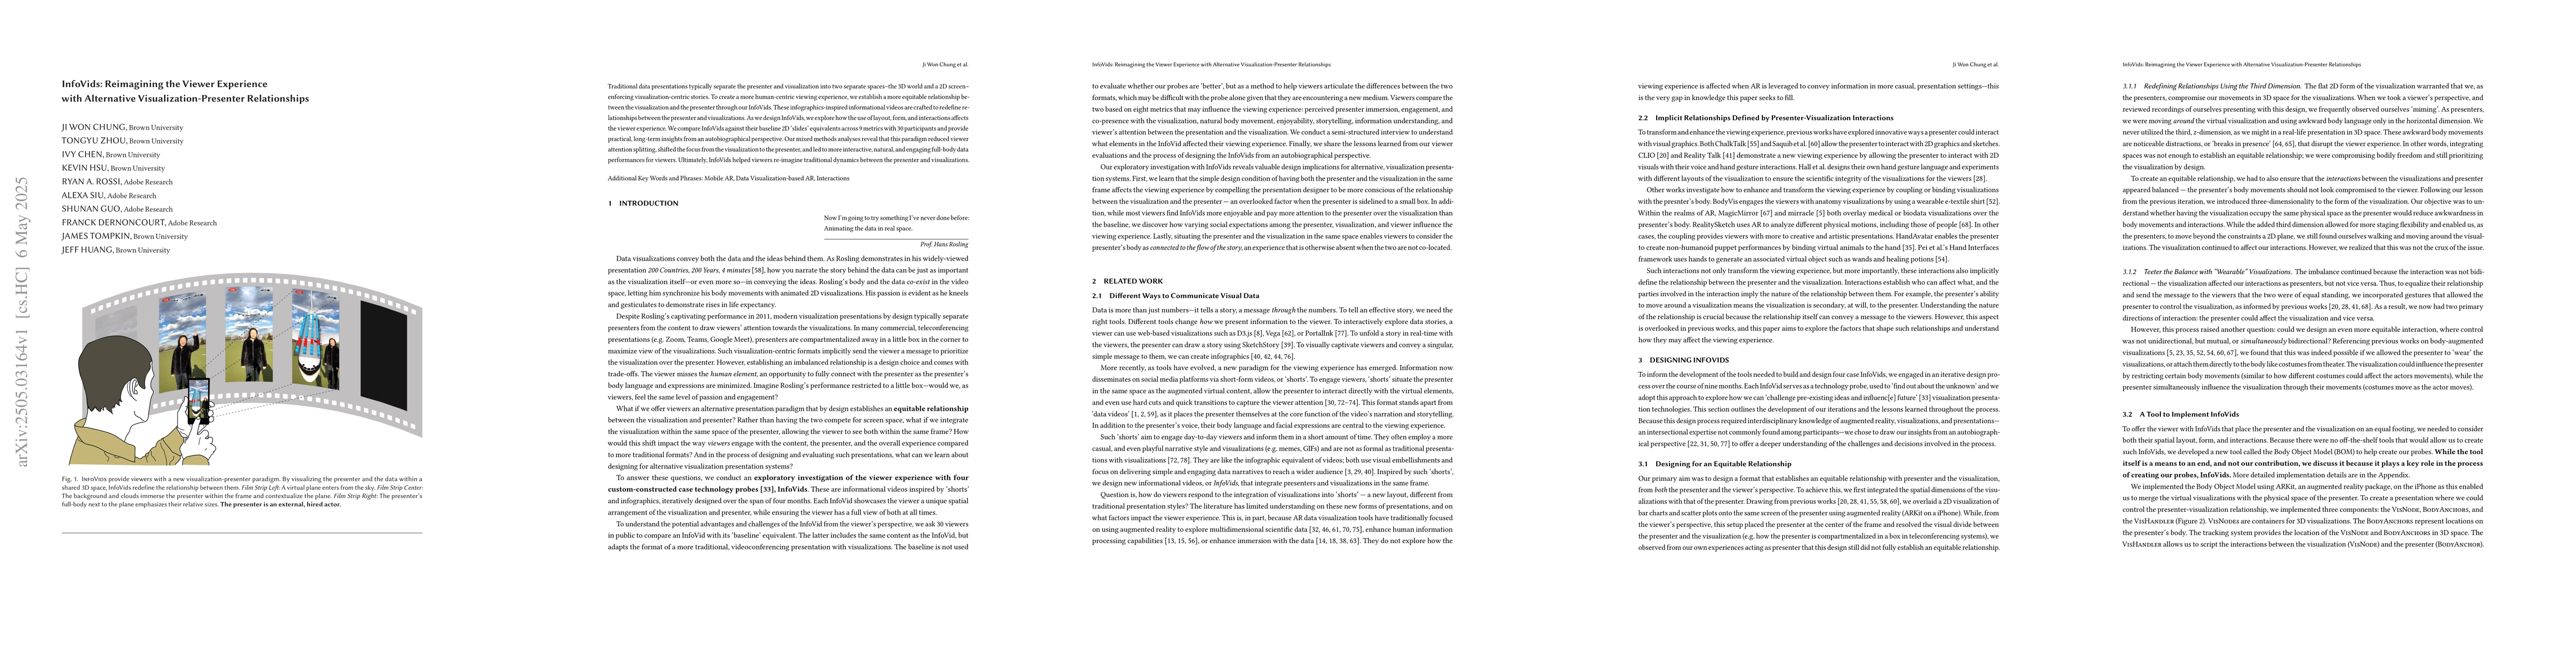
Traditional data presentations typically separate the presenter and visualization into two separate spaces--the 3D world and a 2D screen--enforcing visualization-centric stories. To create a more huma...
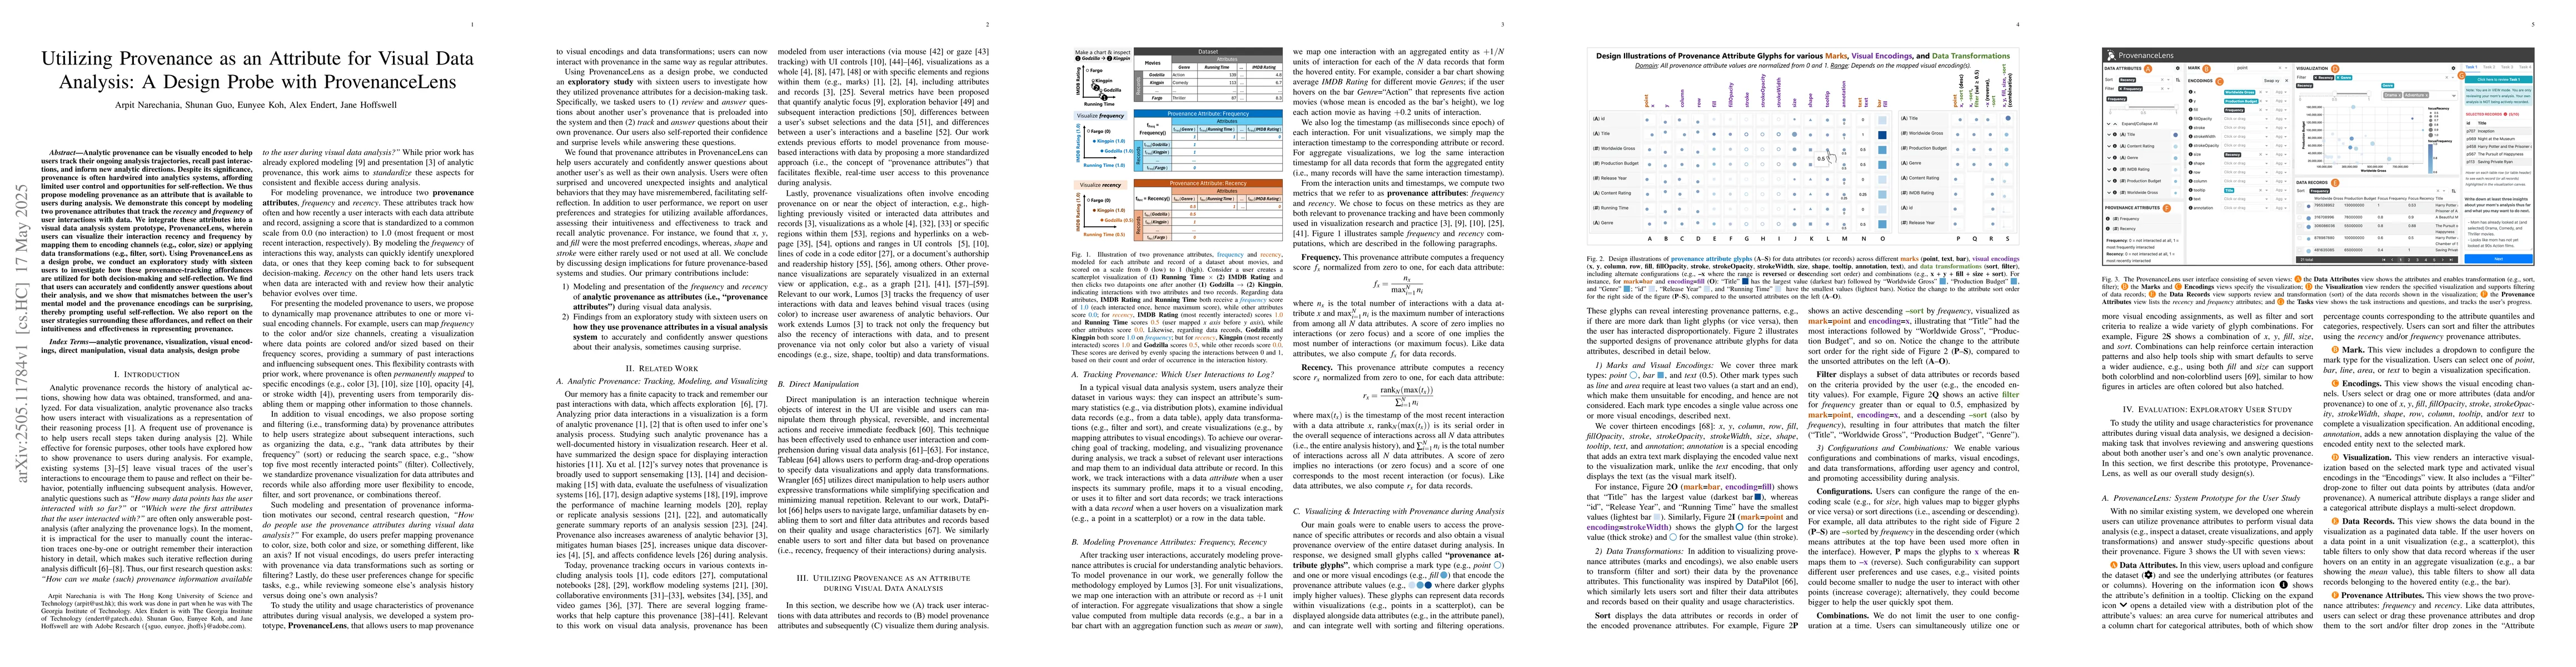
Analytic provenance can be visually encoded to help users track their ongoing analysis trajectories, recall past interactions, and inform new analytic directions. Despite its significance, provenance ...
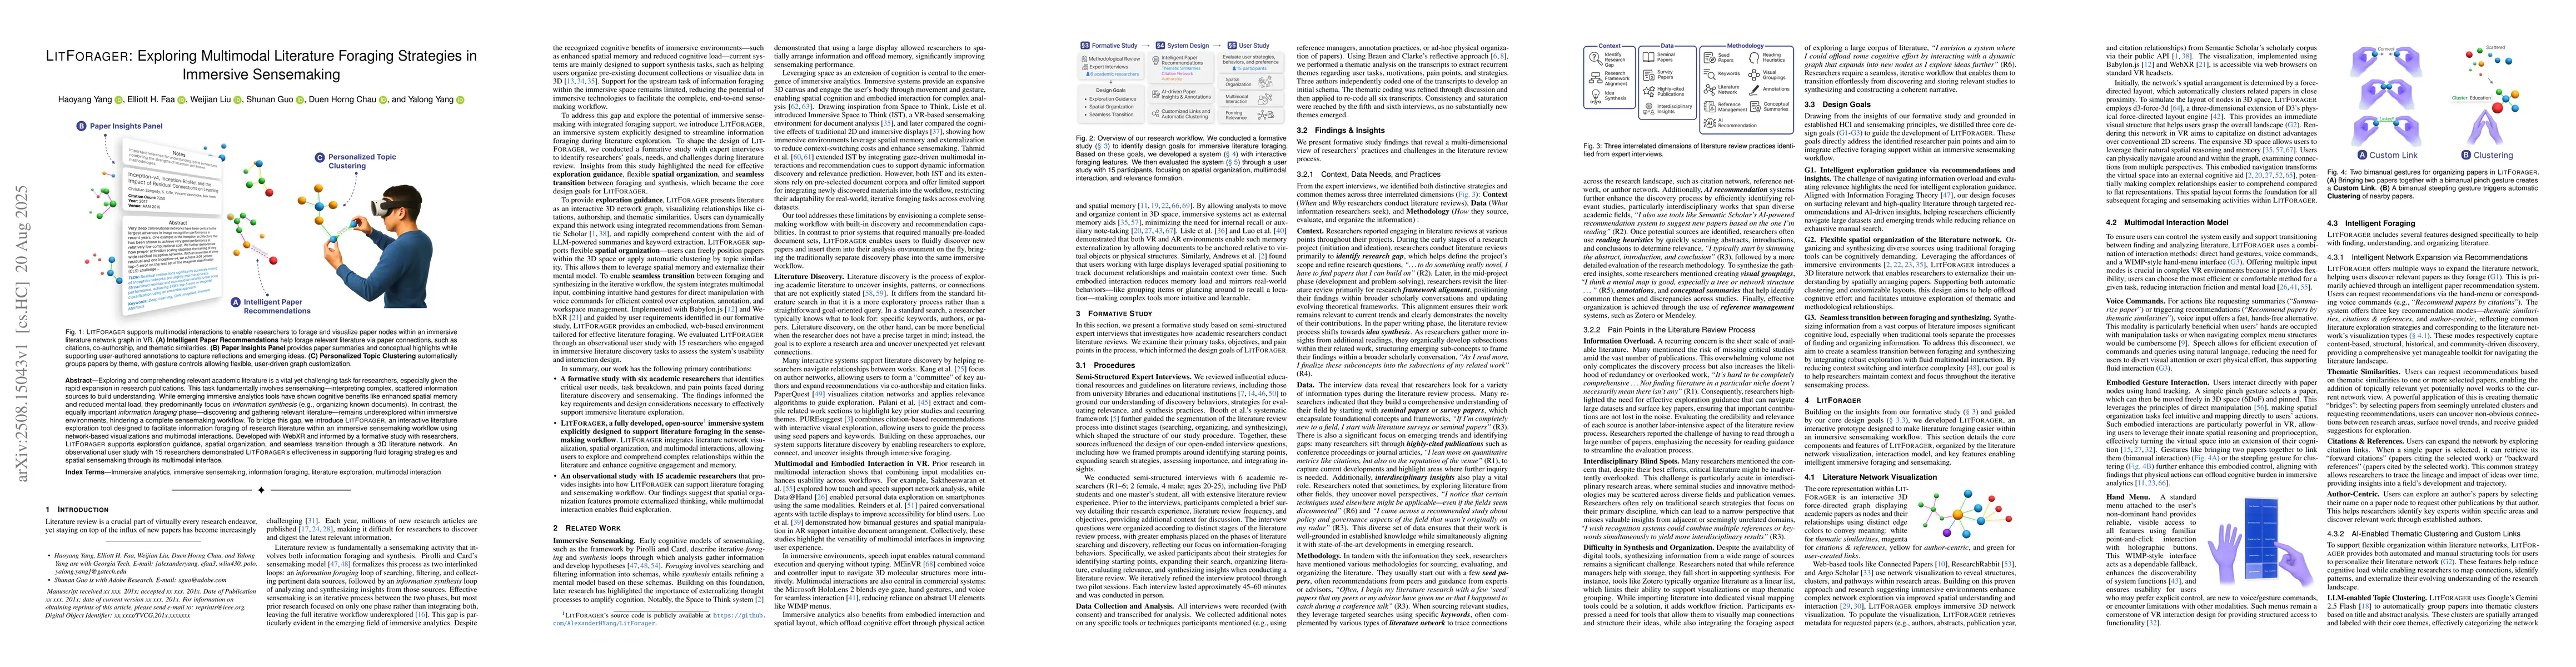
Exploring and comprehending relevant academic literature is a vital yet challenging task for researchers, especially given the rapid expansion in research publications. This task fundamentally involve...
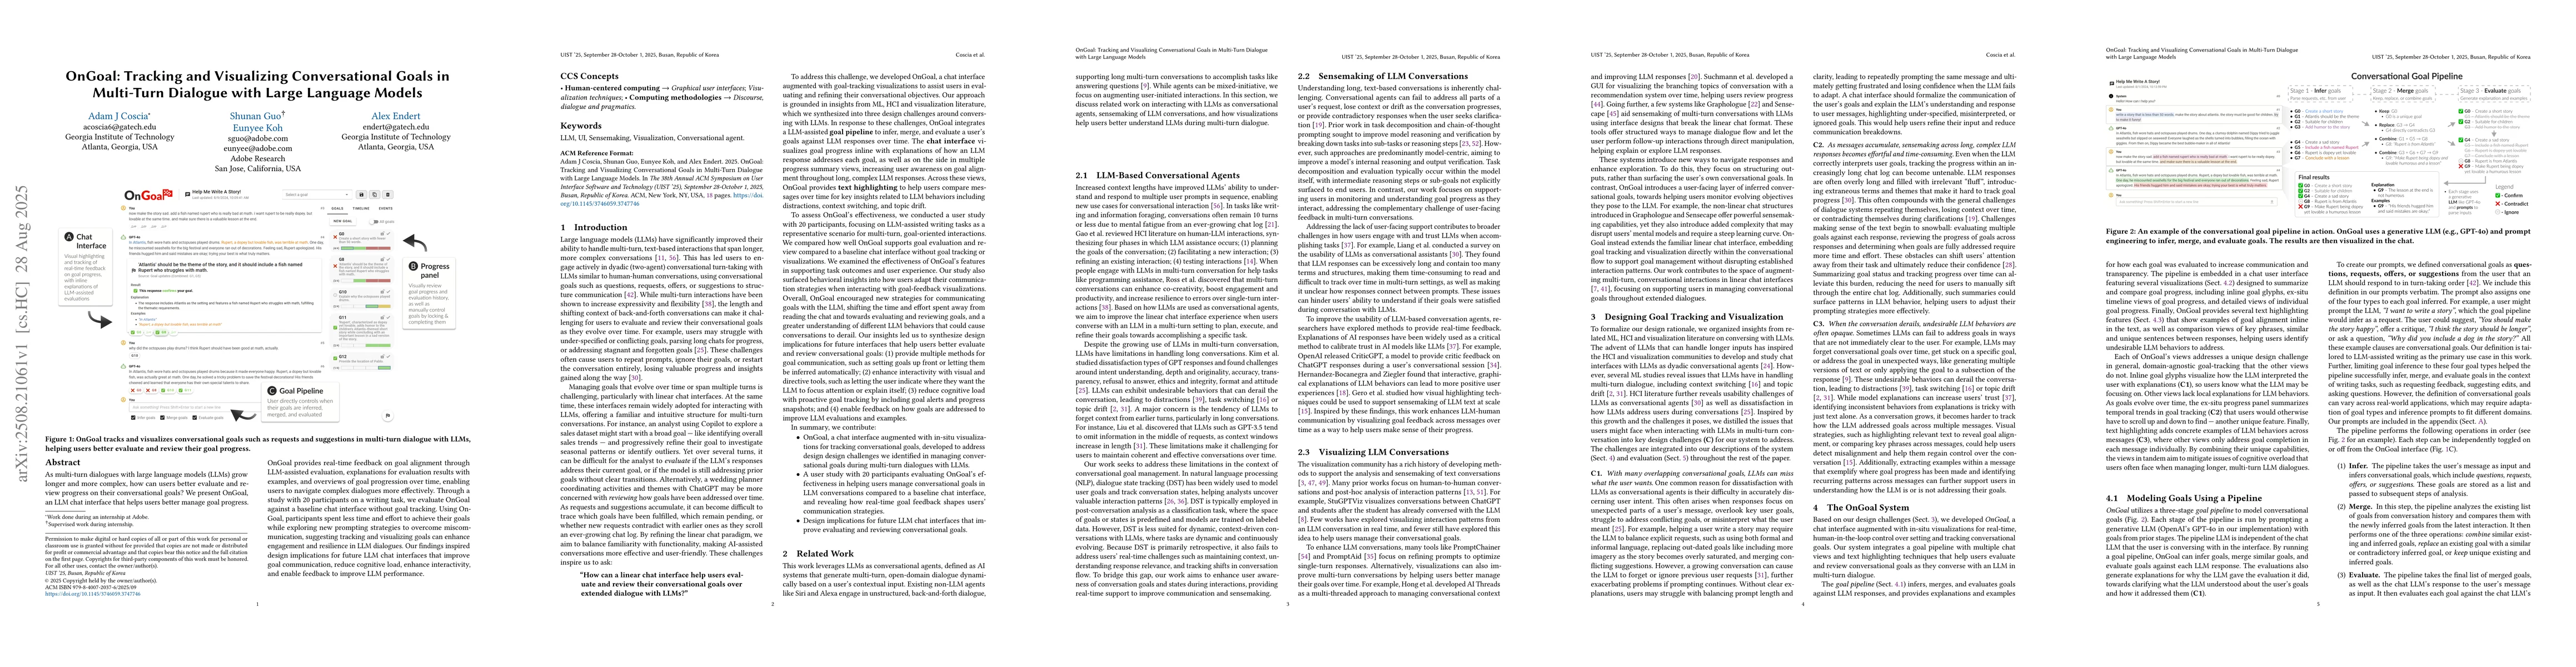
As multi-turn dialogues with large language models (LLMs) grow longer and more complex, how can users better evaluate and review progress on their conversational goals? We present OnGoal, an LLM chat ...
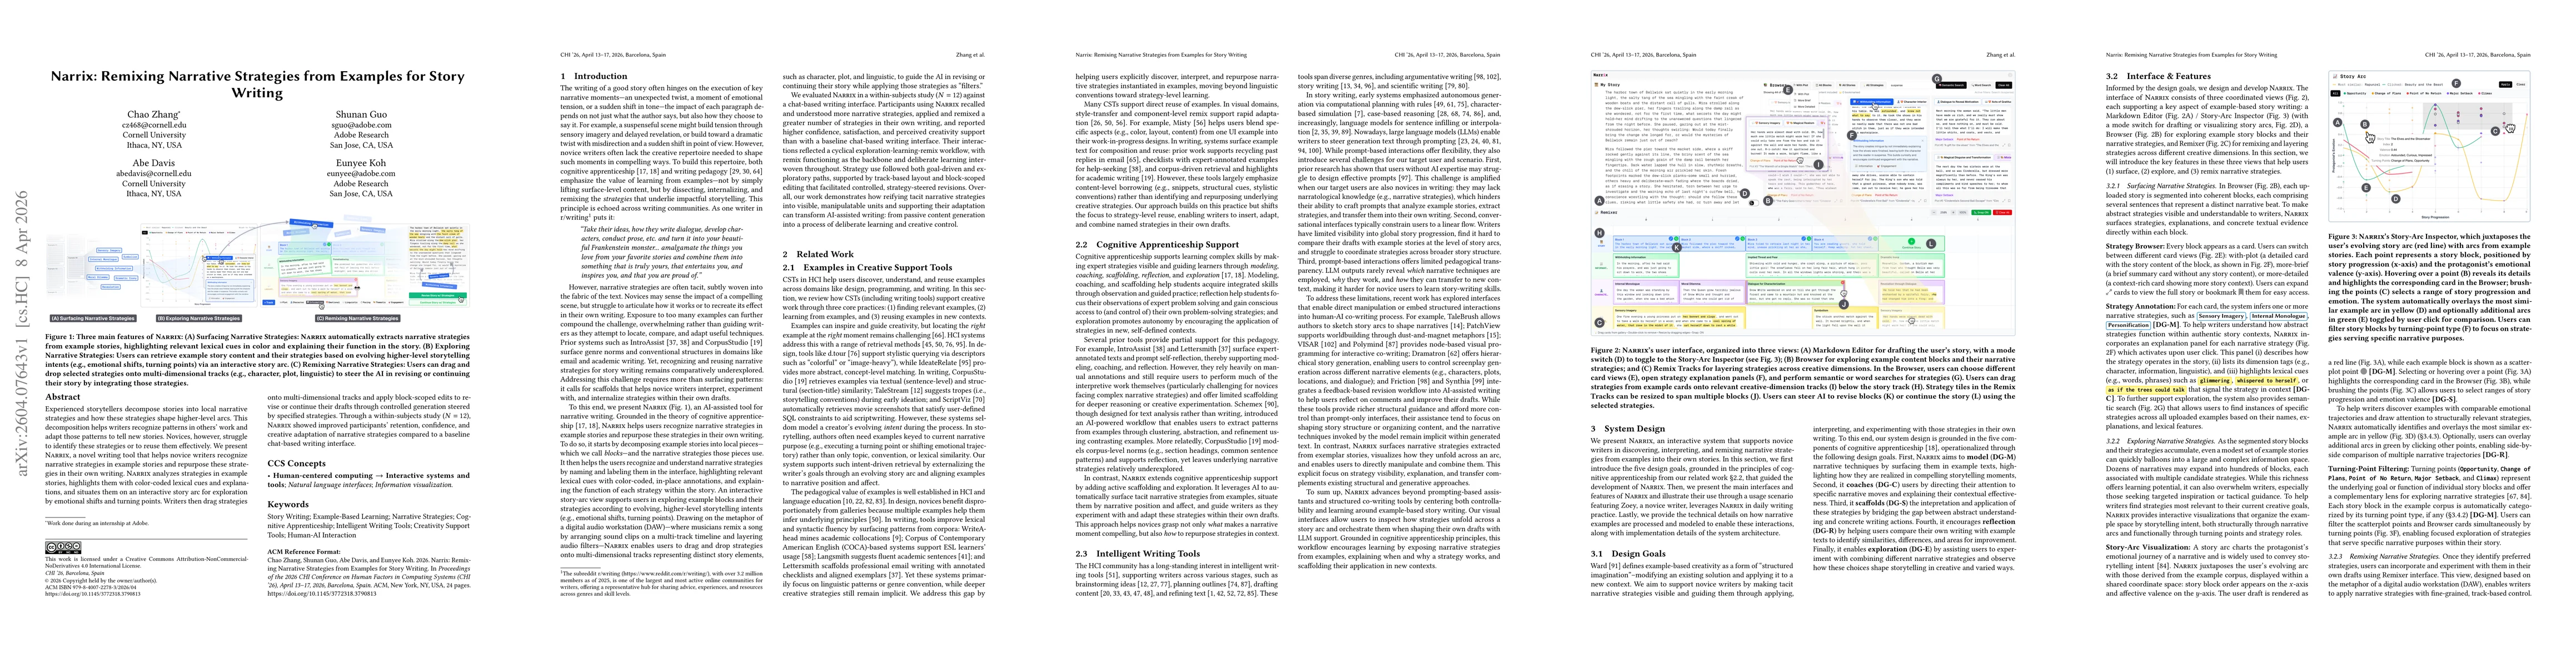
Experienced storytellers decompose stories into local narrative strategies and how these strategies shape higher-level arcs. This decomposition helps writers recognize patterns in others' work and ada...