This paper explores the creation of composite visualizations within immersive environments through embodied interactions, aiming to empower users rather than relying solely on expert-driven, asynchronous processes. The authors develop a design space for such interactions and conduct case studies and user evaluations, finding that these interactions enhance understanding and communication of data relationships.
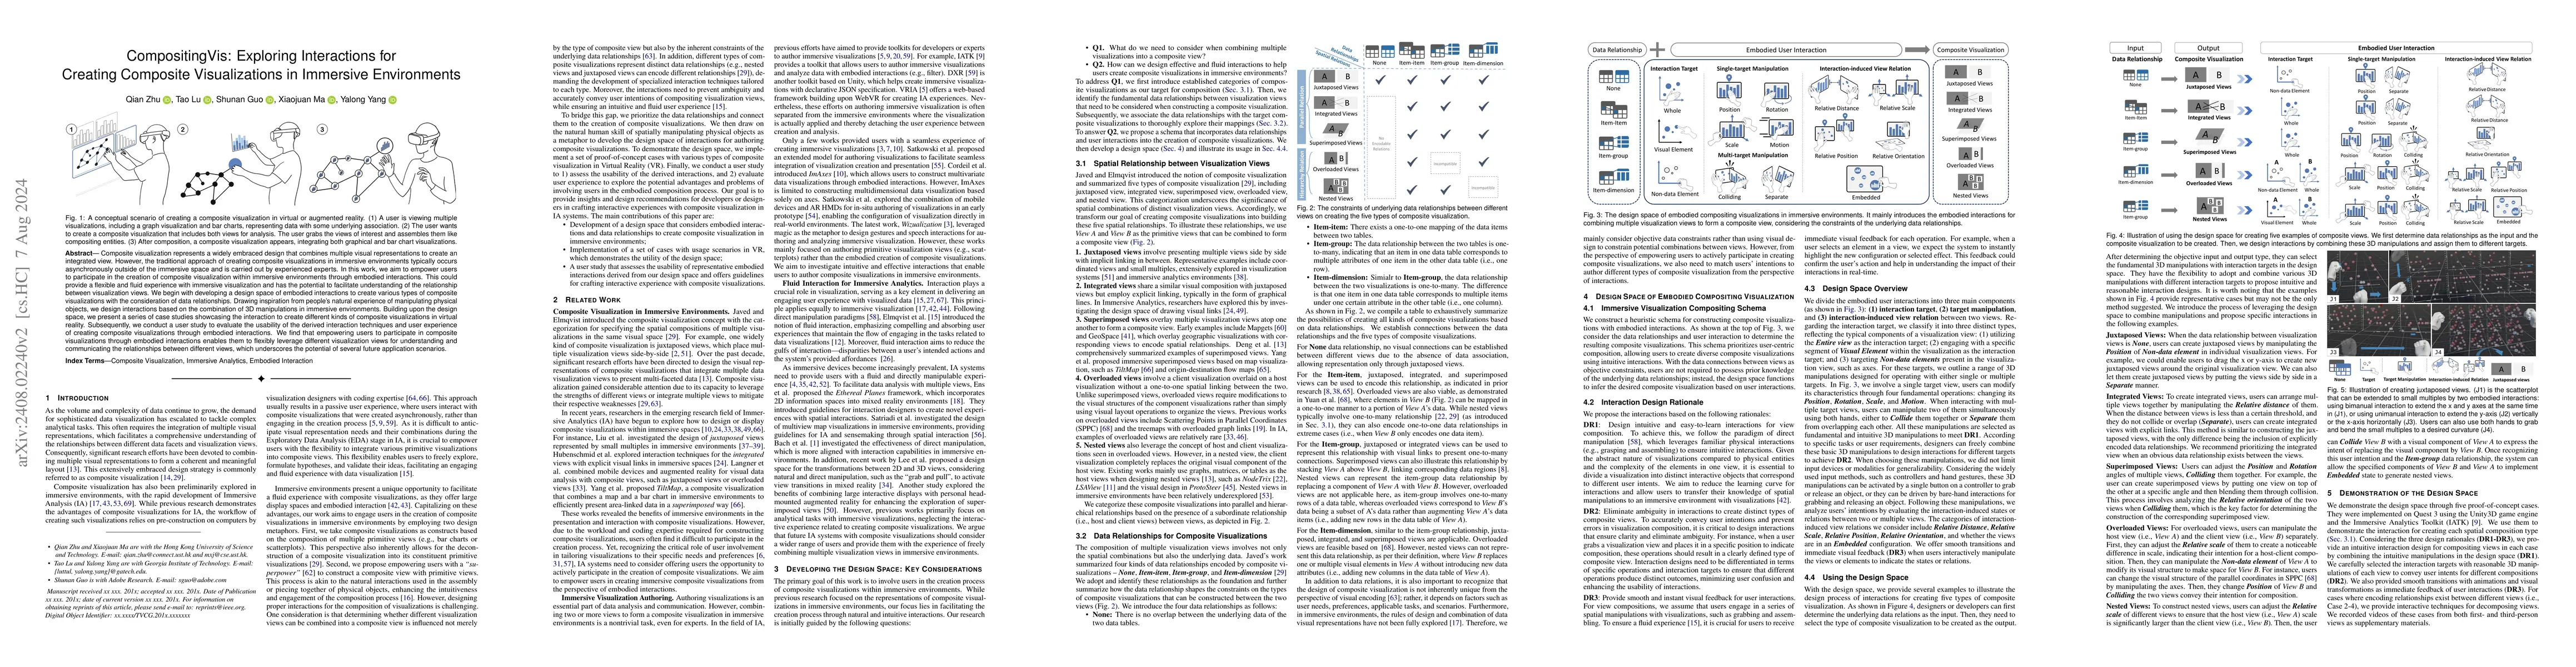
Composite visualization represents a widely embraced design that combines multiple visual representations to create an integrated view. However, the traditional approach of creating composite visualizations in immersive environments typically occurs asynchronously outside of the immersive space and is carried out by experienced experts. In this work, we aim to empower users to participate in the creation of composite visualization within immersive environments through embodied interactions. This could provide a flexible and fluid experience with immersive visualization and has the potential to facilitate understanding of the relationship between visualization views. We begin with developing a design space of embodied interactions to create various types of composite visualizations with the consideration of data relationships. Drawing inspiration from people's natural experience of manipulating physical objects, we design interactions based on the combination of 3D manipulations in immersive environments. Building upon the design space, we present a series of case studies showcasing the interaction to create different kinds of composite visualizations in virtual reality. Subsequently, we conduct a user study to evaluate the usability of the derived interaction techniques and user experience of creating composite visualizations through embodied interactions. We find that empowering users to participate in composite visualizations through embodied interactions enables them to flexibly leverage different visualization views for understanding and communicating the relationships between different views, which underscores the potential of several future application scenarios.
Get AI-generated insights about this paper's methodology, results, and significance.
Current paper (gray), citations (green), references (blue)
No similar papers found for this research.
No citations found for this paper.
Title | Authors | Year | Actions |
---|---|---|---|
Evaluating Navigation and Comparison Performance of Computational Notebooks on Desktop and in Virtual Reality
|
Sungwon In, Eric Krokos, Kirsten Whitley, Chris North, Yalong Yang
|
2024
|
View Paper |
Unraveling the Design Space of Immersive Analytics: A Systematic Review
|
David Saffo, Sara Di Bartolomeo, Tarik Crnovrsanin, Laura South, Justin T. Raynor, Caglar Yildirim, Cody Dunne
|
2023
|
View Paper |
Wizualization: A “Hard Magic” Visualization System for Immersive and Ubiquitous Analytics
|
A. Batch, P. Butcher, Panagiotis D. Ritsos, N. Elmqvist
|
2023
|
View Paper |
This is the Table I Want! Interactive Data Transformation on Desktop and in Virtual Reality
|
Sungwon In, Tica Lin, Chris North, Hanspeter Pfister, Yalong Yang
|
2023
|
View Paper |
DataDancing: An Exploration of the Design Space For Visualisation View Management for 3D Surfaces and Spaces
|
Jiazhou Liu, Barrett Ens, Arnaud Prouzeau, J. Smiley, Isobel Kara Nixon, Sarah Goodwin, Tim Dwyer
|
2023
|
View Paper |
NCARVis: No-Code Visualization Creation System based on Free-hand
|
Kehan Cheng, J. Pu, Zhuoyue Cheng, Jinyue Huang, Xunchao Cong
|
2023
|
View Paper |
Is embodied interaction beneficial? A study on navigating network visualizations
|
Helen H. Huang, Hanspeter Pfister, Yalong Yang
|
2023
|
View Paper |
Effects of Display Layout on Spatial Memory for Immersive Environments
|
Jiazhou Liu, Arnaud Prouzeau, Barrett Ens, Tim Dwyer
|
2022
|
View Paper |
A Design Space For Data Visualisation Transformations Between 2D And 3D In Mixed-Reality Environments
|
Benjamin Lee, Maxime Cordeil, Arnaud Prouzeau, B. Jenny, Tim Dwyer
|
2022
|
View Paper |
Revisiting the Design Patterns of Composite Visualizations
|
Dazhen Deng, Weiwei Cui, Xiyu Meng, Mengye Xu, Yu Liao, Haidong Zhang, Yingcai Wu
|
2022
|
View Paper |
Metaverse: Perspectives from graphics, interactions and visualization
|
Yuheng Zhao, Jinjing Jiang, Yi Chen, Richen Liu, Yalong Yang, Xiangyang Xue, Siming Chen
|
2022
|
View Paper |
A Visualization Authoring Model for Post-WIMP Interfaces
|
Marc Satkowski, W. Luo, Raimund Dachselt
|
2021
|
View Paper |
Towards In-situ Authoring of AR Visualizations with Mobile Devices
|
Marc Satkowski, W. Luo, Raimund Dachselt
|
2021
|
View Paper |
Perception! Immersion! Empowerment!: Superpowers as Inspiration for Visualization
|
Wesley Willett, Bon Adriel Aseniero, Sheelagh Carpendale, Pierre Dragicevic, Yvonne Jansen, L. Oehlberg, Petra Isenberg
|
2021
|
View Paper |
Grand Challenges in Immersive Analytics
|
Barrett Ens, B. Bach, Maxime Cordeil, U. Engelke, M. Serrano, Wesley Willett, Arnaud Prouzeau, C. Anthes, Wolfgang Büschel, Cody Dunne, Tim Dwyer, Jens Grubert, J. Haga, Nurit Kirshenbaum, Dylan Kobayashi, Tica Lin, Monsurat Olaosebikan, Fabian Pointecker, David Saffo, N. Saquib, D. Schmalstieg, D. Szafir, Matt Whitlock, Yalong Yang
|
2021
|
View Paper |
STREAM: Exploring the Combination of Spatially-Aware Tablets with Augmented Reality Head-Mounted Displays for Immersive Analytics
|
Sebastian Hubenschmid, Johannes Zagermann, Simon Butscher, Harald Reiterer
|
2021
|
View Paper |
MARVIS: Combining Mobile Devices and Augmented Reality for Visual Data Analysis
|
Ricardo Langner, Marc Satkowski, Wolfgang Büschel, Raimund Dachselt
|
2021
|
View Paper |
Personal Augmented Reality for Information Visualization on Large Interactive Displays
|
Patrick Reipschläger, Tamara Flemisch, Raimund Dachselt
|
2020
|
View Paper |
Embodied Navigation in Immersive Abstract Data Visualization: Is Overview+Detail or Zooming Better for 3D Scatterplots?
|
Yalong Yang, Maxime Cordeil, Johanna Beyer, Tim Dwyer, K. Marriott, H. Pfister
|
2020
|
View Paper |
MARVisT: Authoring Glyph-Based Visualization in Mobile Augmented Reality
|
Zhutian Chen, Yijia Su, Yifang Wang, Qianwen Wang, Huamin Qu, Yingcai Wu
|
2020
|
View Paper |
Tilt Map: Interactive Transitions Between Choropleth Map, Prism Map and Bar Chart in Immersive Environments
|
Yalong Yang, Tim Dwyer, K. Marriott, B. Jenny, Sarah Goodwin
|
2020
|
View Paper |
Assessing 2D and 3D Heatmaps for Comparative Analysis: An Empirical Study
|
Matthias Kraus, Katrin Angerbauer, J. Buchmüller, Daniel Schweitzer, D. Keim, M. Sedlmair, Johannes Fuchs
|
2020
|
View Paper |
Design and Evaluation of Interactive Small Multiples Data Visualisation in Immersive Spaces
|
Jiazhou Liu, Arnaud Prouzeau, Barrett Ens, Tim Dwyer
|
2020
|
View Paper |
VRIA: A Web-Based Framework for Creating Immersive Analytics Experiences
|
P. Butcher, N. John, Panagiotis D. Ritsos
|
2020
|
View Paper |
ProtoSteer: Steering Deep Sequence Model with Prototypes
|
Yao Ming, Panpan Xu, Furui Cheng, Huamin Qu, Liu Ren
|
2020
|
View Paper |
Visual Link Routing in Immersive Visualisations
|
Arnaud Prouzeau, Antoine Lhuillier, Barrett Ens, D. Weiskopf, Tim Dwyer
|
2019
|
View Paper |
Critical Reflections on Visualization Authoring Systems
|
Arvind Satyanarayan, Bongshin Lee, Donghao Ren, Jeffrey Heer, J. Stasko, John Thompson, M. Brehmer, Zhicheng Liu
|
2019
|
View Paper |
Visual Analysis of High-Dimensional Event Sequence Data via Dynamic Hierarchical Aggregation
|
D. Gotz, Jonathan Zhang, Wenyuan Wang, Joshua Shrestha, D. Borland
|
2019
|
View Paper |
IATK: An Immersive Analytics Toolkit
|
Maxime Cordeil, Andrew Cunningham, Benjamin Bach, C. Hurter, B. Thomas, K. Marriott, Tim Dwyer
|
2019
|
View Paper |
DXR: A Toolkit for Building Immersive Data Visualizations
|
Ronell Sicat, Jiabao Li, Junyoung Choi, Maxime Cordeil, W. Jeong, Benjamin Bach, H. Pfister
|
2019
|
View Paper |
Origin-Destination Flow Maps in Immersive Environments
|
Yalong Yang, Tim Dwyer, B. Jenny, K. Marriott, Maxime Cordeil, Haohui Chen
|
2019
|
View Paper |
Multisensory Immersive Analytics
|
J. McCormack, Jonathan C. Roberts, Benjamin Bach, C. Freitas, T. Itoh, C. Hurter, K. Marriott
|
2018
|
View Paper |
Interaction for Immersive Analytics
|
Wolfgang Büschel, Jian Chen, Raimund Dachselt, S. Drucker, Tim Dwyer, C. Görg, Tobias Isenberg, A. Kerren, Chris North, W. Stuerzlinger
|
2018
|
View Paper |
3De Interactive Lenses for Visualization in Virtual Environments
|
R. Mota, Allan Rocha, J. D. Silva, U. Alim, Ehud Sharlin
|
2018
|
View Paper |
Data Illustrator: Augmenting Vector Design Tools with Lazy Data Binding for Expressive Visualization Authoring
|
Zhicheng Liu, John Thompson, Alan Wilson, Mira Dontcheva, James Delorey, Sam Grigg, Bernard Kerr, J. Stasko
|
2018
|
View Paper |
ImAxes: Immersive Axes as Embodied Affordances for Interactive Multivariate Data Visualisation
|
Maxime Cordeil, Andrew Cunningham, Tim Dwyer, B. Thomas, K. Marriott
|
2017
|
View Paper |
Assessing User Engagement in Information Visualization
|
Ya-Hsin Hung, Paul C. Parsons
|
2017
|
View Paper |
A Study of Layout, Rendering, and Interaction Methods for Immersive Graph Visualization
|
Oh-Hyun Kwon, C. Muelder, Kyungwon Lee, K. Ma
|
2016
|
View Paper |
Ethereal planes: a design framework for 2D information space in 3D mixed reality environments
|
Barrett Ens, Juan David Hincapié-Ramos, Pourang Irani
|
2014
|
View Paper |
Visualization beyond the Desktop--the Next Big Thing
|
Jonathan C. Roberts, Panagiotis D. Ritsos, Sriram Karthik Badam, D. Brodbeck, J. Kennedy, N. Elmqvist
|
2014
|
View Paper |
Understand users’ comprehension and preferences for composing information visualizations
|
Huahai Yang, Yunyao Li, Michelle X. Zhou
|
2014
|
View Paper |
Beyond Mouse and Keyboard: Expanding Design Considerations for Information Visualization Interactions
|
Bongshin Lee, Petra Isenberg, N. Riche, Sheelagh Carpendale
|
2012
|
View Paper |
Visual analytics methods for categoric spatio-temporal data
|
T. V. Landesberger, S. Bremm, N. Andrienko, G. Andrienko, M. Tekusova
|
2012
|
View Paper |
Exploring the design space of composite visualization
|
Waqas Javed, N. Elmqvist
|
2012
|
View Paper |
Fluid interaction for information visualization
|
N. Elmqvist, A. Moere, Hans-Christian Jetter, D. Cernea, Harald Reiterer, T. Jankun-Kelly
|
2011
|
View Paper |
LSAView: A tool for visual exploration of latent semantic modeling
|
Patricia J. Crossno, Daniel M. Dunlavy, T. Shead
|
2009
|
View Paper |
Scattering Points in Parallel Coordinates
|
Xiaoru Yuan, Peihong Guo, He Xiao, Hong Zhou, Huamin Qu
|
2009
|
View Paper |
NodeTrix: a Hybrid Visualization of Social Networks
|
N. Riche, Jean-Daniel Fekete, Michael J. McGuffin
|
2007
|
View Paper |
Toward a Deeper Understanding of the Role of Interaction in Information Visualization
|
Ji Soo Yi, Y. Kang, J. Stasko, J. Jacko
|
2007
|
View Paper |
VisLink: Revealing Relationships Amongst Visualizations
|
C. Collins, Sheelagh Carpendale
|
2007
|
View Paper |
State of the Art: Coordinated & Multiple Views in Exploratory Visualization
|
J. C. Roberts
|
2007
|
View Paper |
Overlaying Graph Links on Treemaps
|
Jean-Daniel Fekete, David Wang, Niem Dang, C. Plaisant
|
2003
|
View Paper |
User involvement: A review of the benefits and challenges
|
Sari Kujala
|
2003
|
View Paper |
Guidelines for using multiple views in information visualization
|
M. Baldonado, Allison Woodruff, A. Kuchinsky
|
2000
|
View Paper |
Languages
|
David Damrosch
|
2000
|
View Paper |
GeoSpace: an interactive visualization system for exploring complex information spaces
|
Ishantha Lokuge, S. Ishizaki
|
1995
|
View Paper |
Direct Manipulation Interfaces
|
E. Hutchins, James Hollan, D. Norman
|
1985
|
View Paper |
Direct Manipulation: A Step Beyond Programming Languages
|
B. Shneiderman
|
1983
|
View Paper |
Maps around me: 3d multiview layouts in immersive spaces
|
2020
|
||
Immersive Analytics: Time to Reconsider the Value of 3D for Information Visualisation
|
K. Marriott, Jian Chen, Marcel Hlawatsch, T. Itoh, Miguel A. Nacenta, G. Reina, W. Stuerzlinger
|
2018
|
View Paper |
The Hologram in My Hand: How Effective is Interactive Exploration of 3D Visualizations in Immersive Tangible Augmented Reality?
|
Benjamin Bach, Ronell Sicat, Johanna Beyer, Maxime Cordeil, H. Pfister
|
2018
|
View Paper |
VLAT: Development of a Visualization Literacy Assessment Test
|
Sukwon Lee, Sung-Hee Kim, Bum Chul Kwon
|
2017
|
View Paper |
Usability Engineering
|
John Millar Carroll, M. Rosson
|
2014
|
View Paper |
Unifying the Sensemaking Process with Semantic Interaction
|
A. Endert, Patrick Fiaux
|
2012
|
View Paper |
The development and evaluation of a survey to measure user engagement
|
H. O'Brien, Elaine Toms
|
2010
|
View Paper |
Mapgets: a Tool for Visualizing and Querying Geographic Information
|
Agn Es Voisard
|
1995
|
View Paper |
: The psychology of optimal experience , vol. 1990
|
1990
|
||
A toolkit for situated analytics
|
|||
Authorized licensed use limited to the terms of the applicable license
|
|||
Meta-verse Visual
|
Showing first page preview. Click "Open Full PDF" to view the complete paper.
Your comment contains inappropriate language and has been rejected.
Are you sure you want to remove this tag? This action cannot be undone.
Someone just favorited a paper!
Comments (0)