Academic Profile
Statistics
Similar Authors
Papers on arXiv
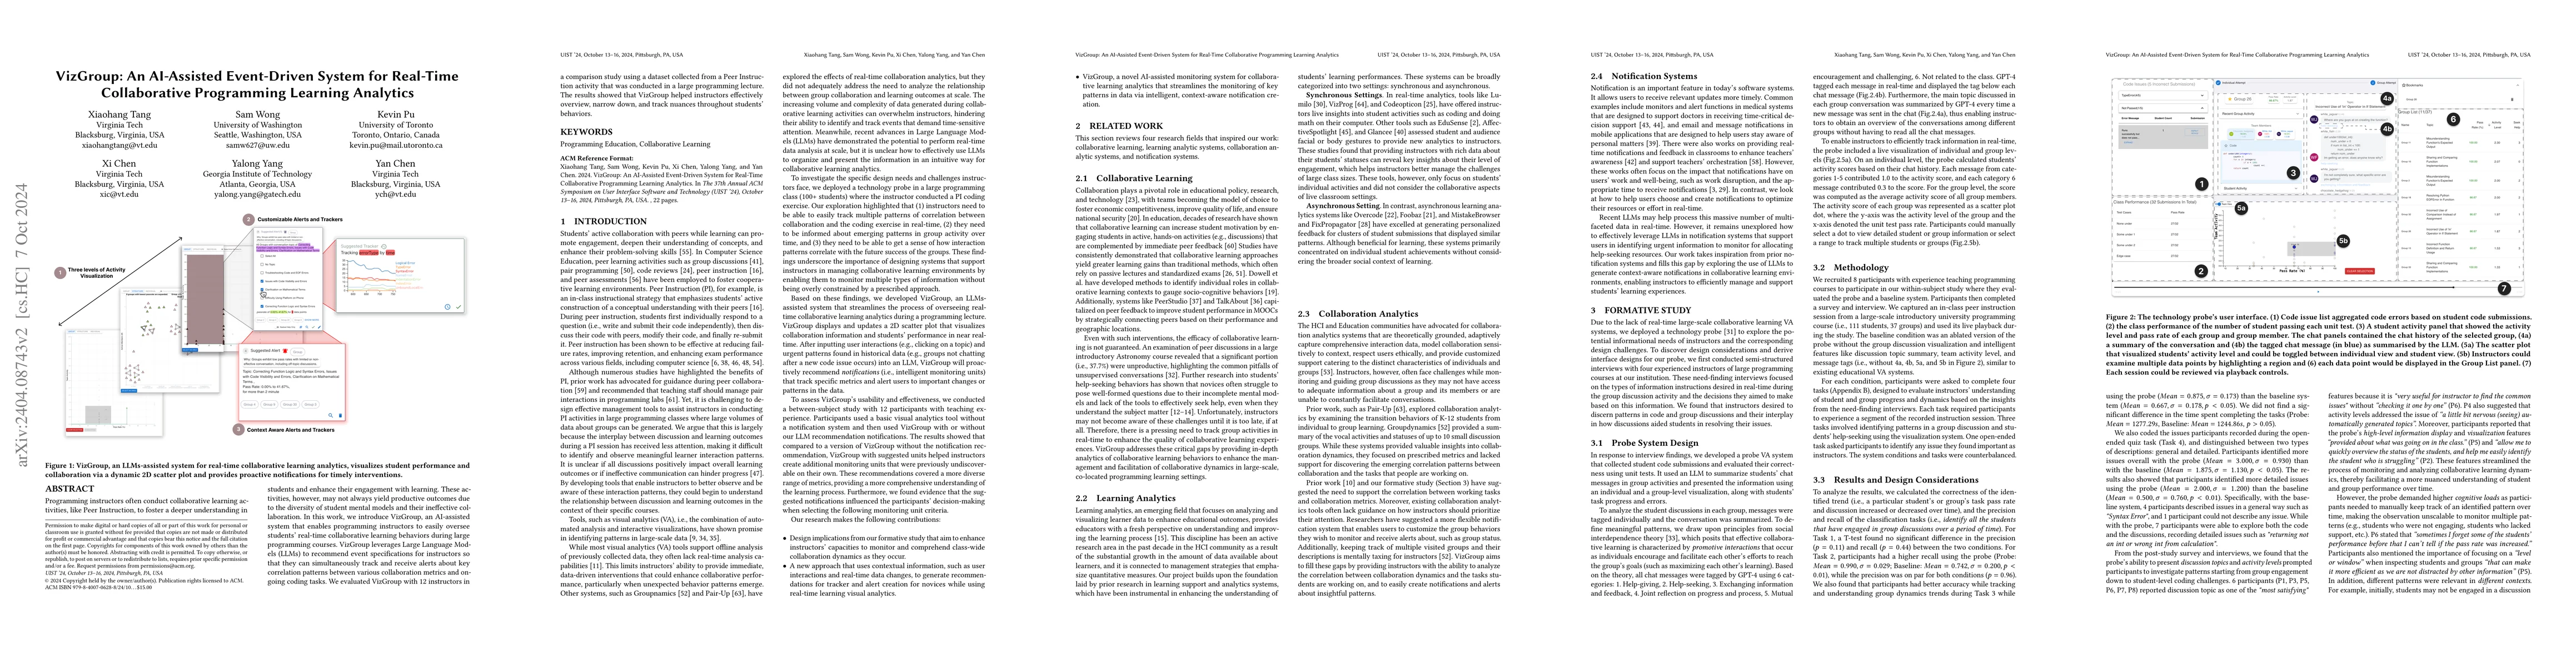
Programming instructors often conduct collaborative learning activities, like Peer Instruction, to foster a deeper understanding in students and enhance their engagement with learning. These activit...
The computational notebook serves as a versatile tool for data analysis. However, its conventional user interface falls short of keeping pace with the ever-growing data-related tasks, signaling the ...
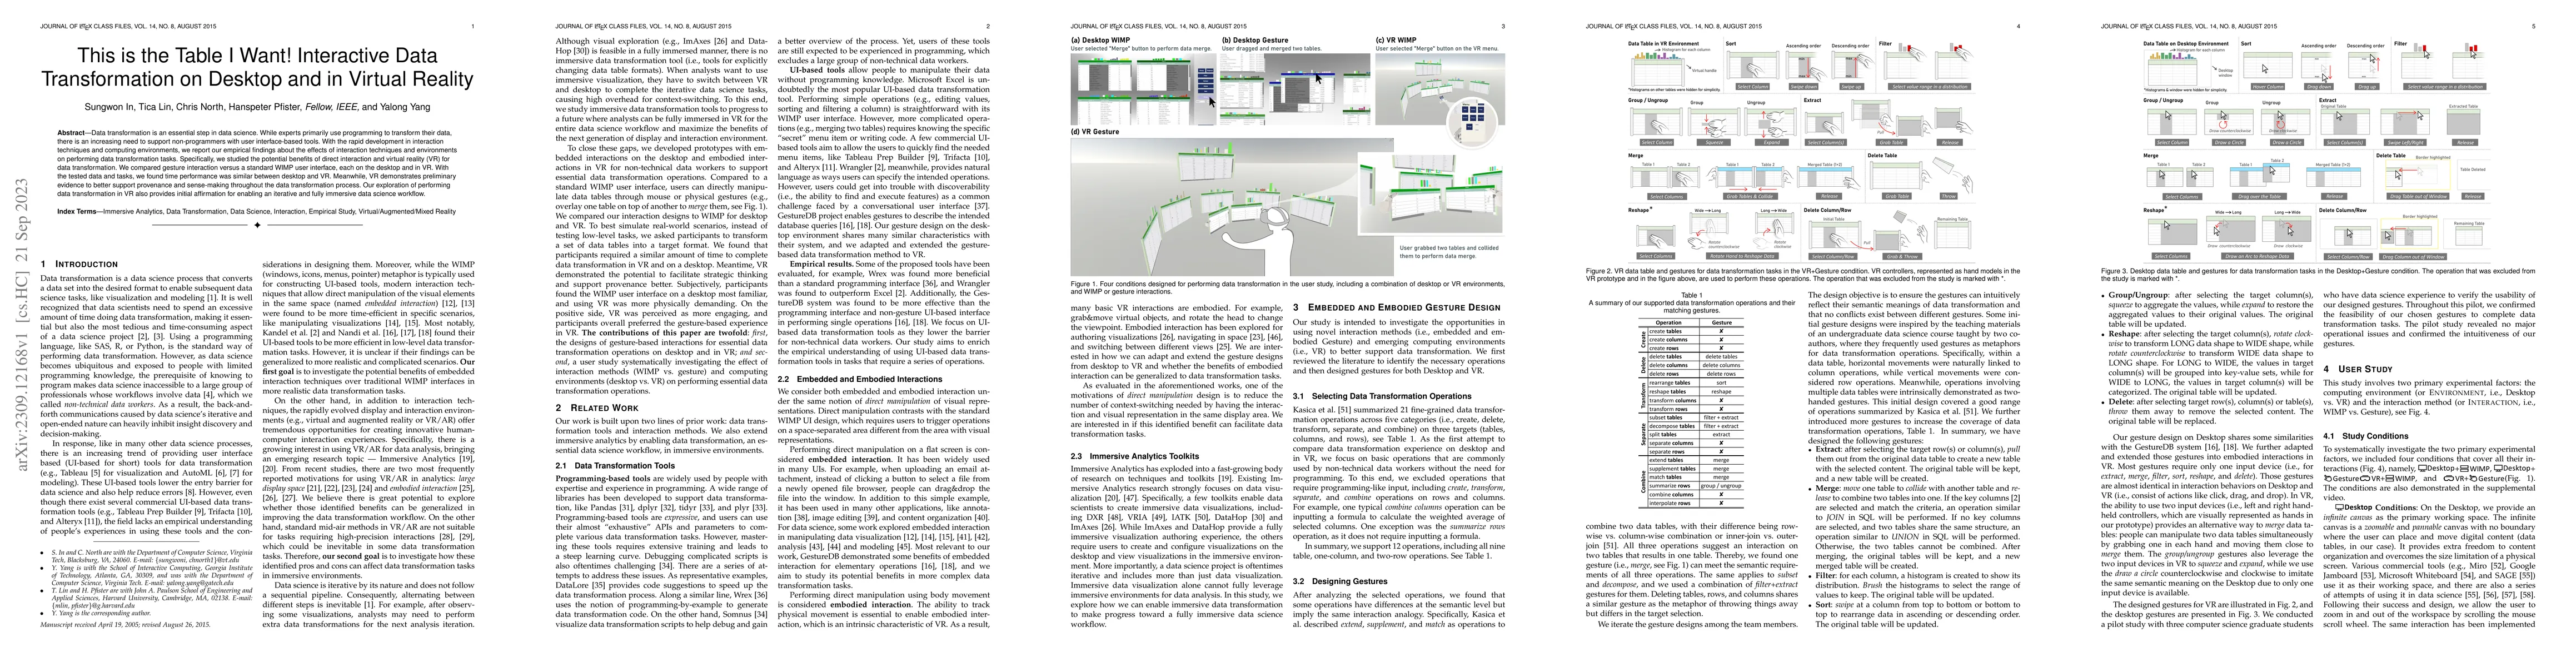
Data transformation is an essential step in data science. While experts primarily use programming to transform their data, there is an increasing need to support non-programmers with user interface-...
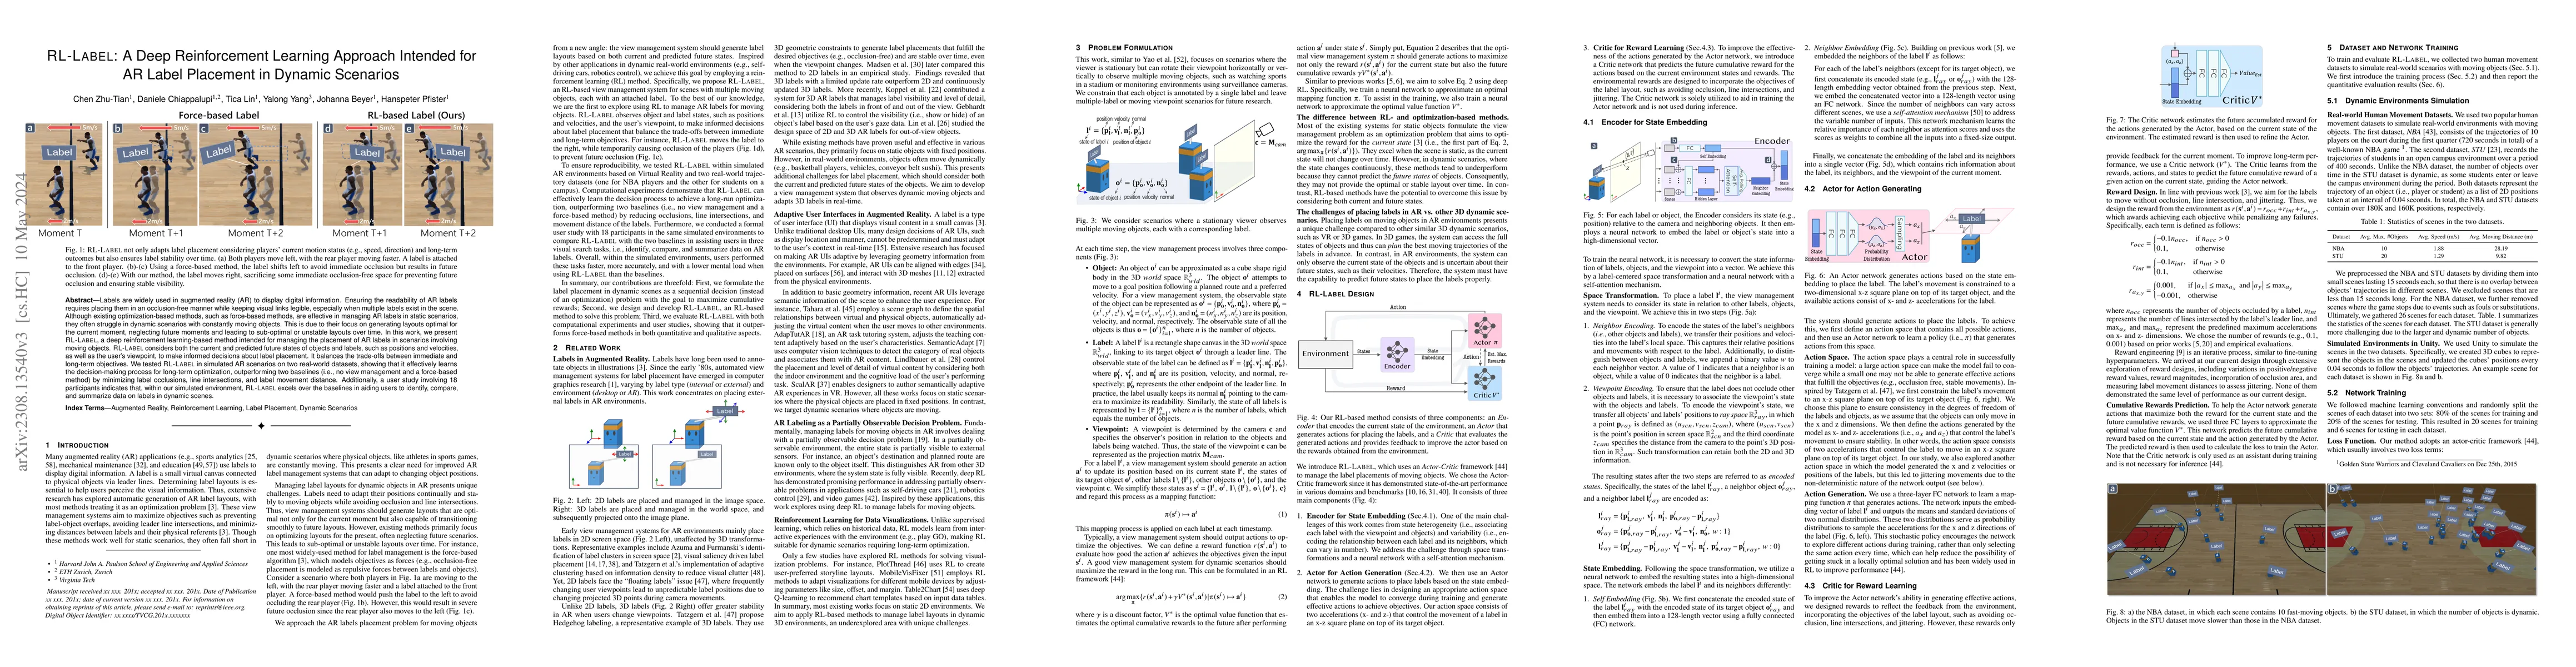
Labels are widely used in augmented reality (AR) to display digital information. Ensuring the readability of AR labels requires placing them occlusion-free while keeping visual linkings legible, esp...
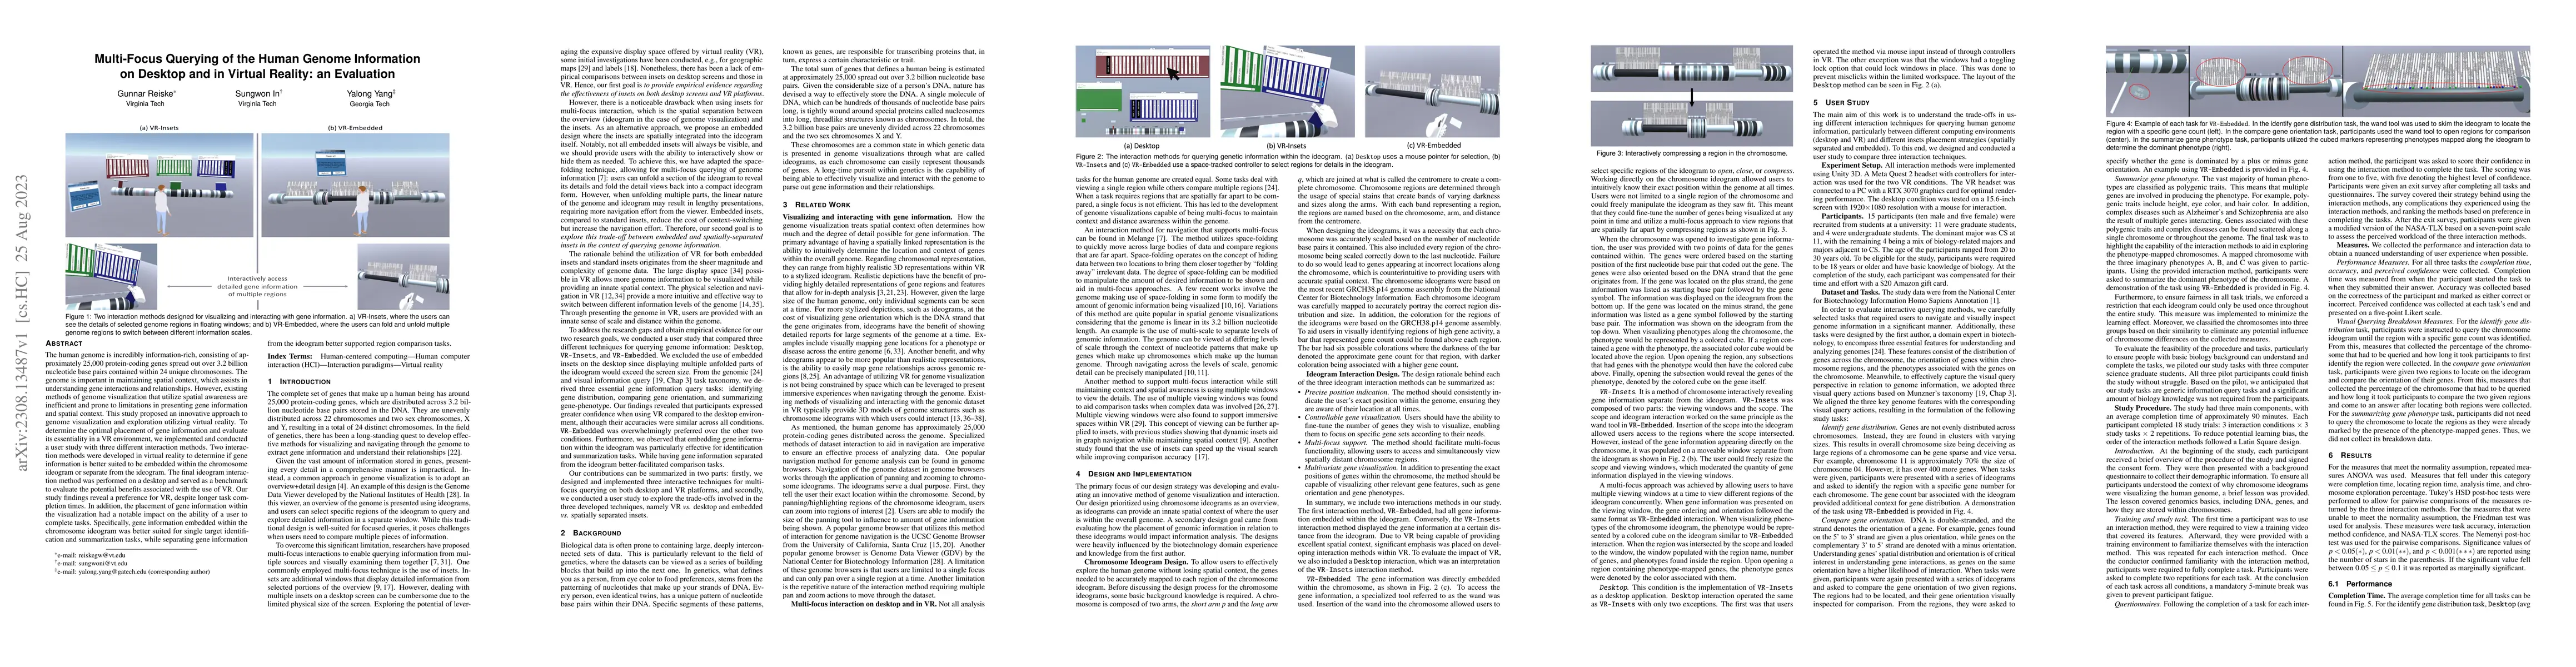
The human genome is incredibly information-rich, consisting of approximately 25,000 protein-coding genes spread out over 3.2 billion nucleotide base pairs contained within 24 unique chromosomes. The...
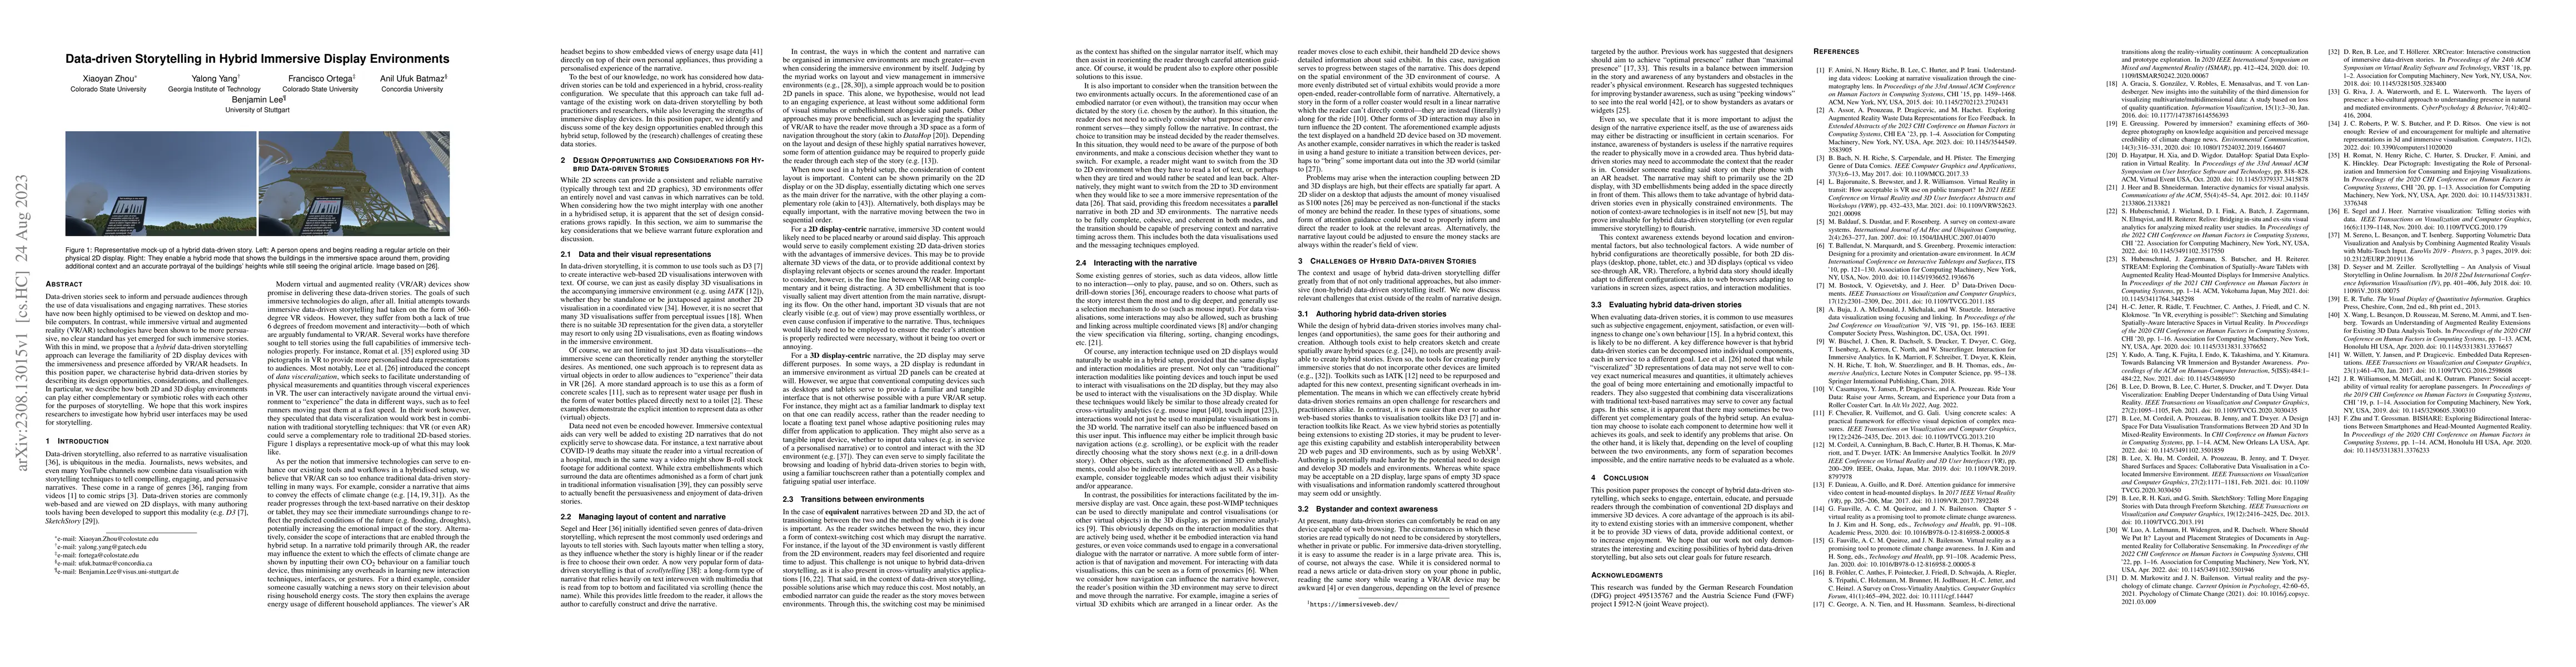
Data-driven stories seek to inform and persuade audiences through the use of data visualisations and engaging narratives. These stories have now been highly optimised to be viewed on desktop and mob...
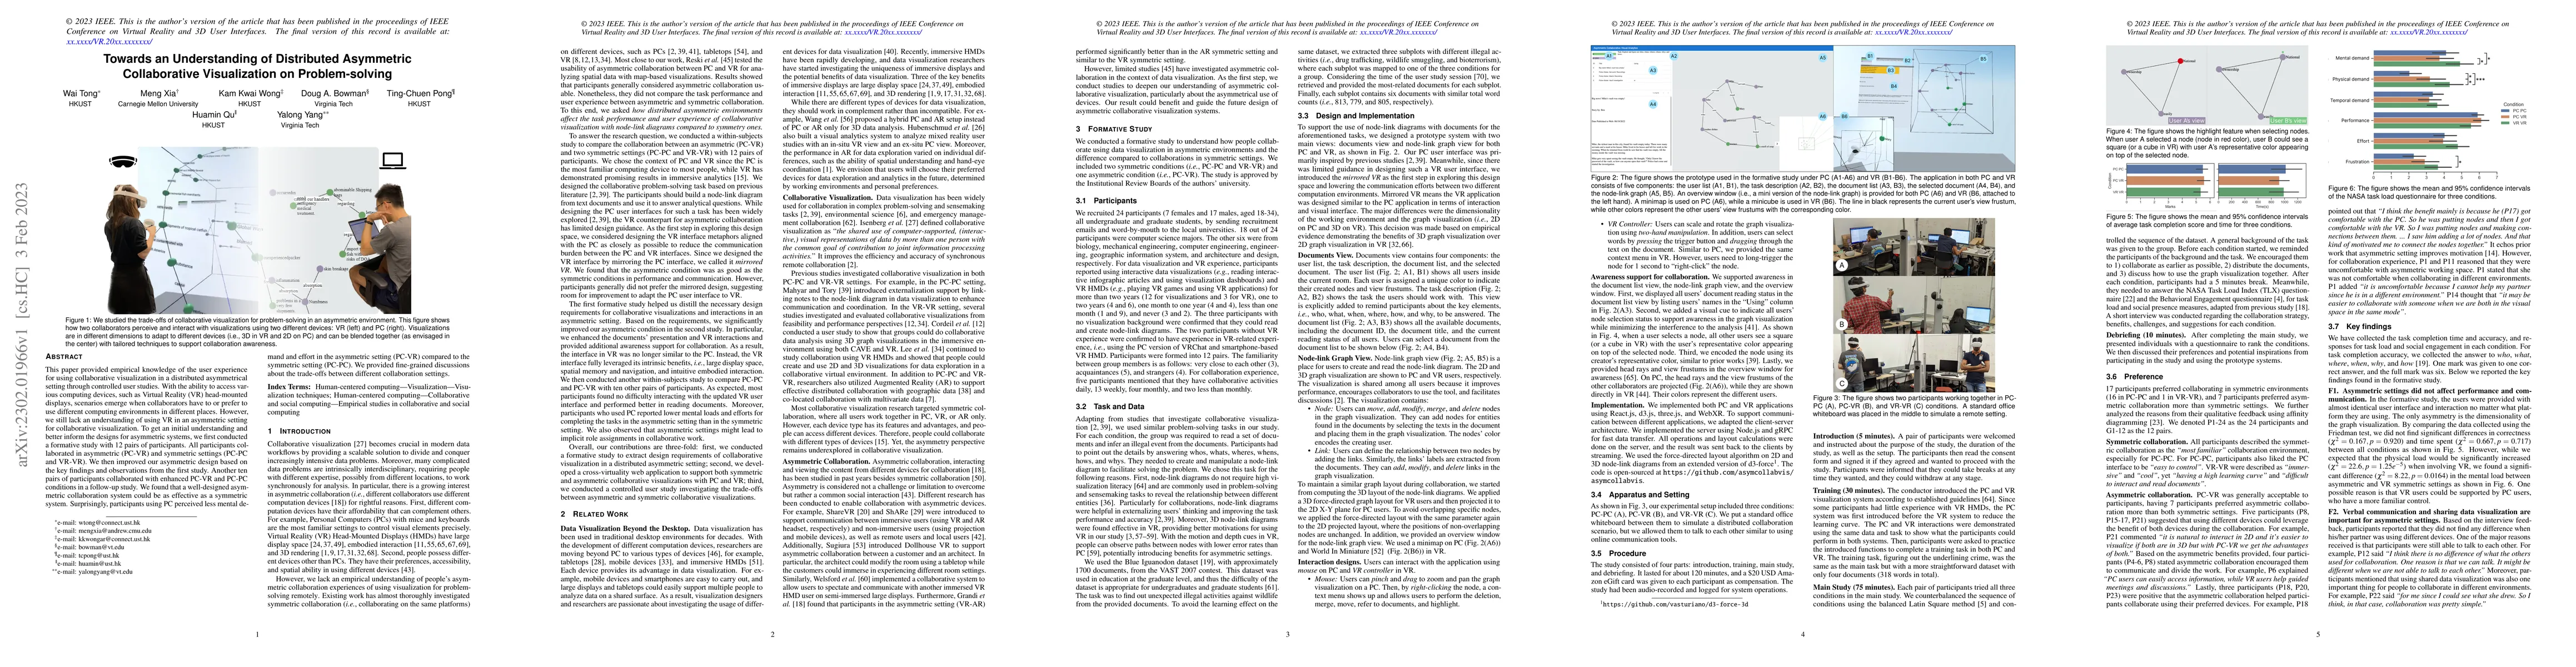
This paper provided empirical knowledge of the user experience for using collaborative visualization in a distributed asymmetrical setting through controlled user studies. With the ability to access...
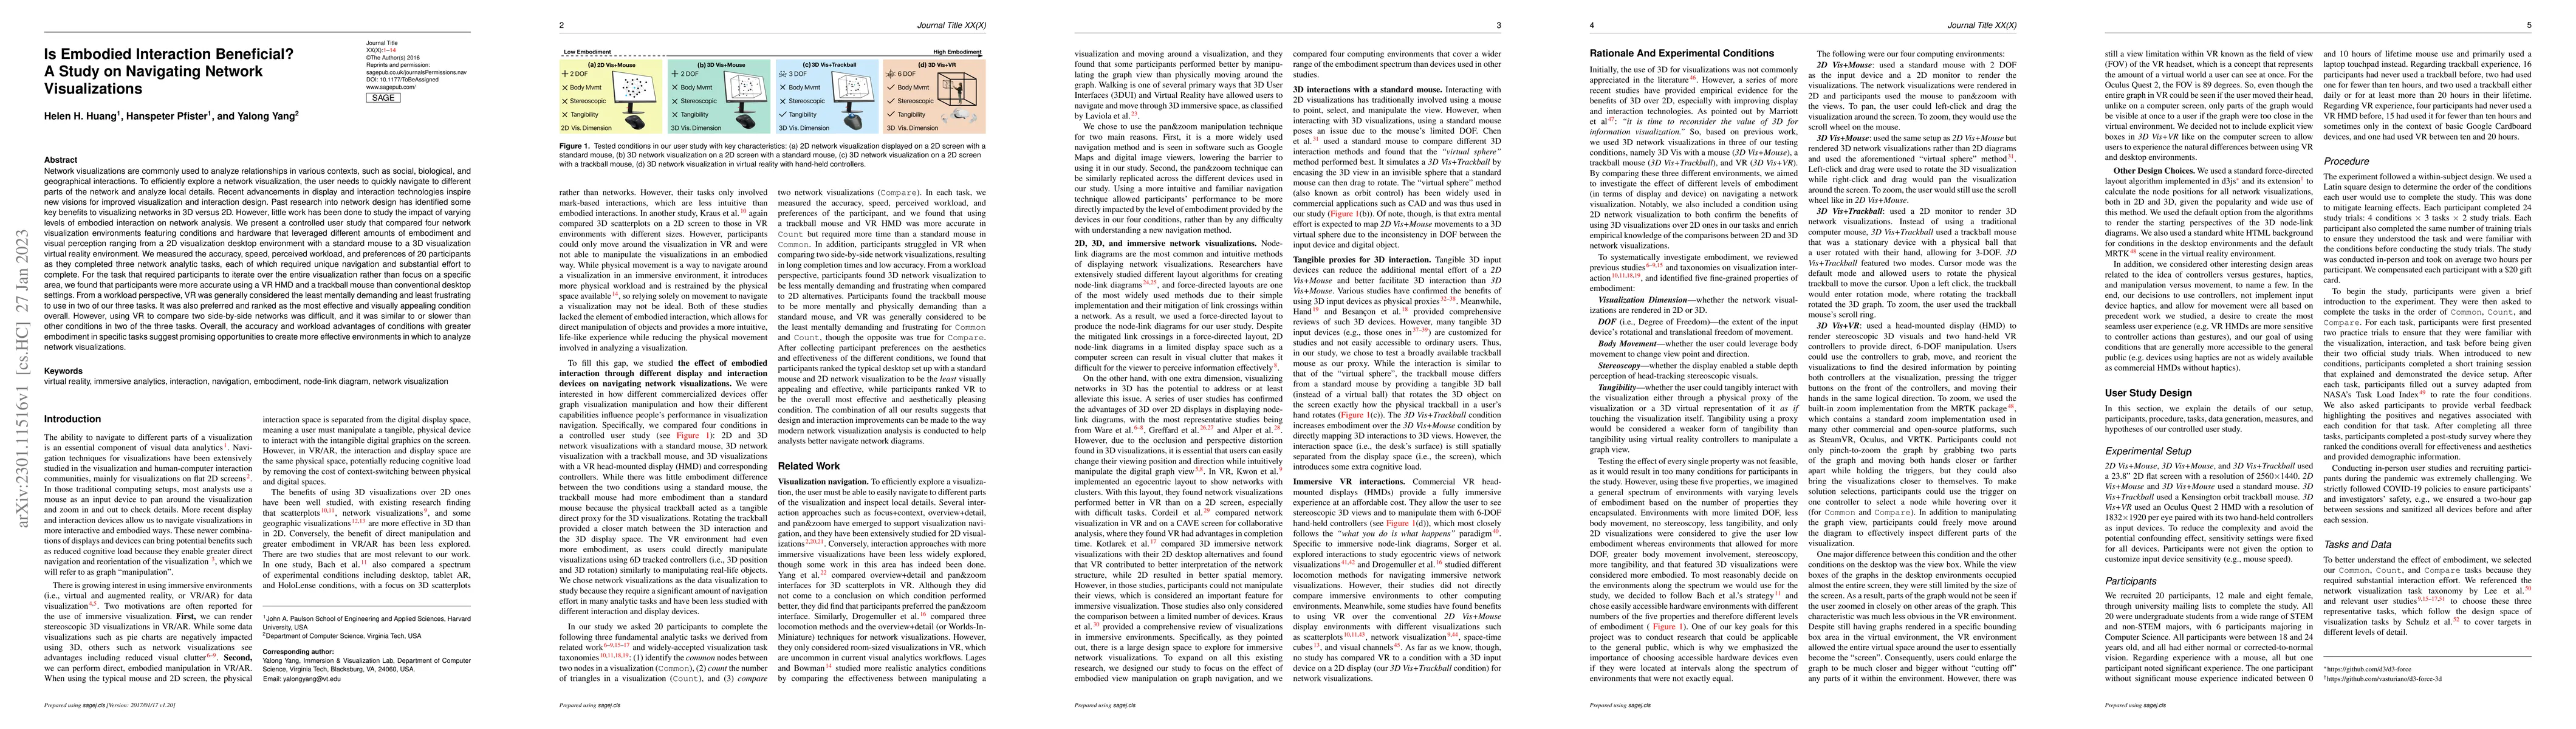
Network visualizations are commonly used to analyze relationships in various contexts. To efficiently explore a network visualization, the user needs to quickly navigate to different parts of the ne...
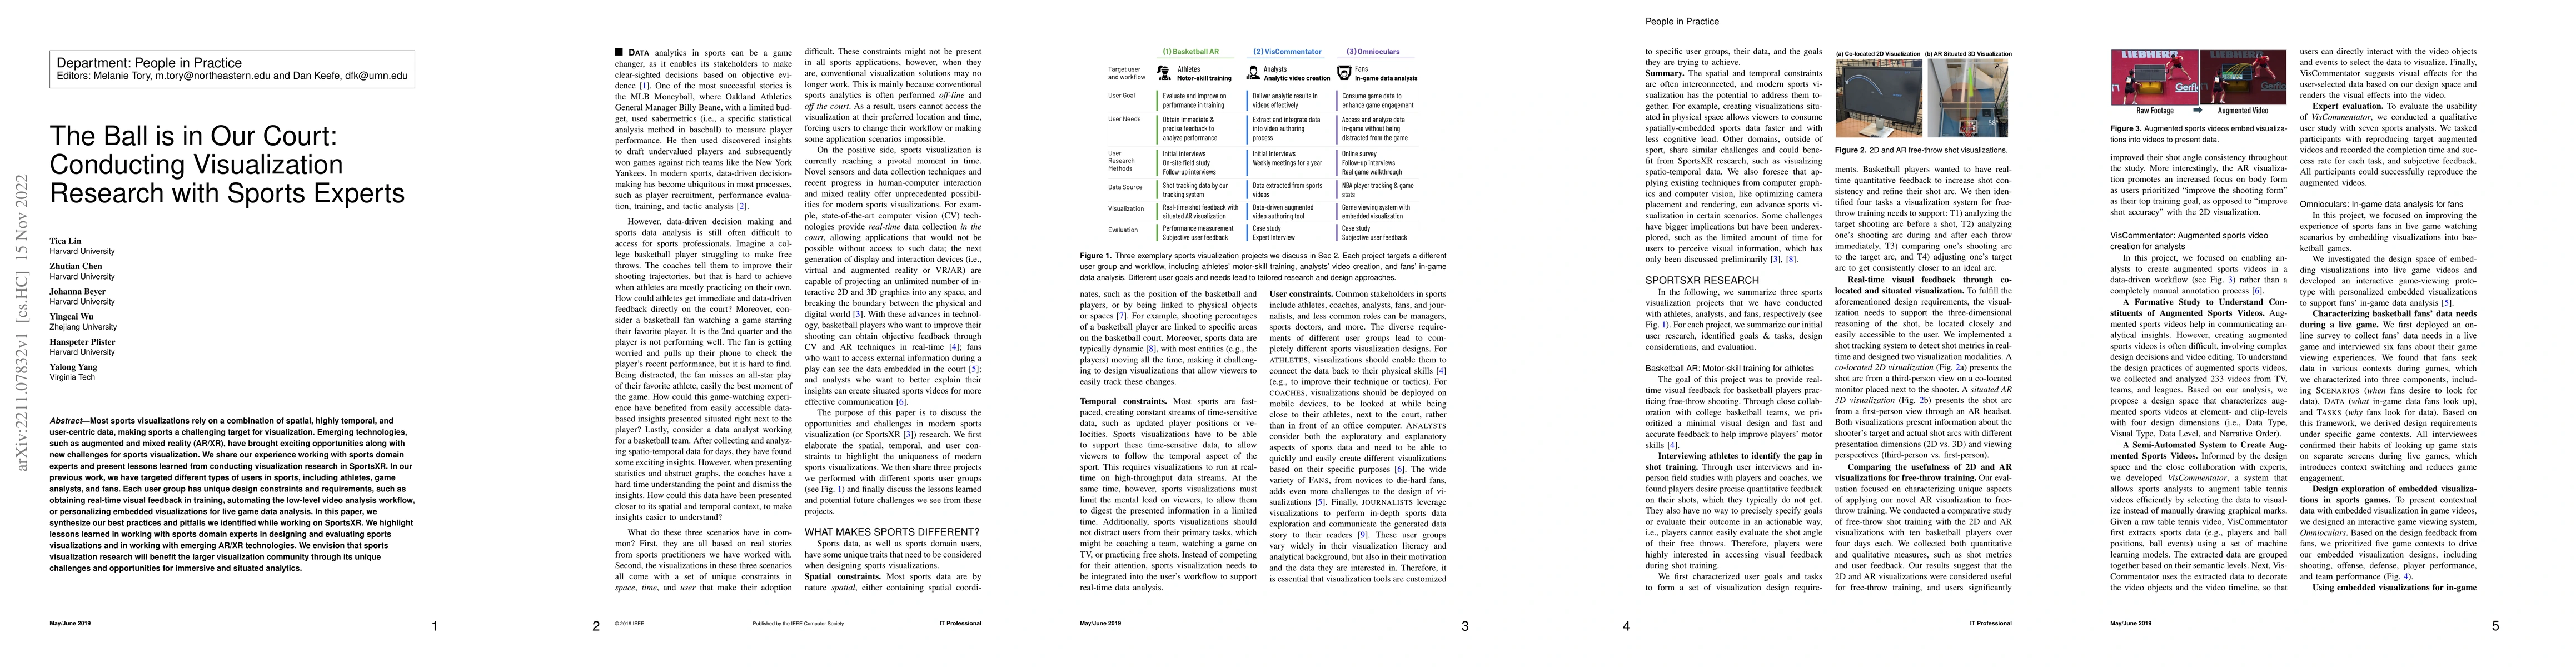
Most sports visualizations rely on a combination of spatial, highly temporal, and user-centric data, making sports a challenging target for visualization. Emerging technologies, such as augmented an...
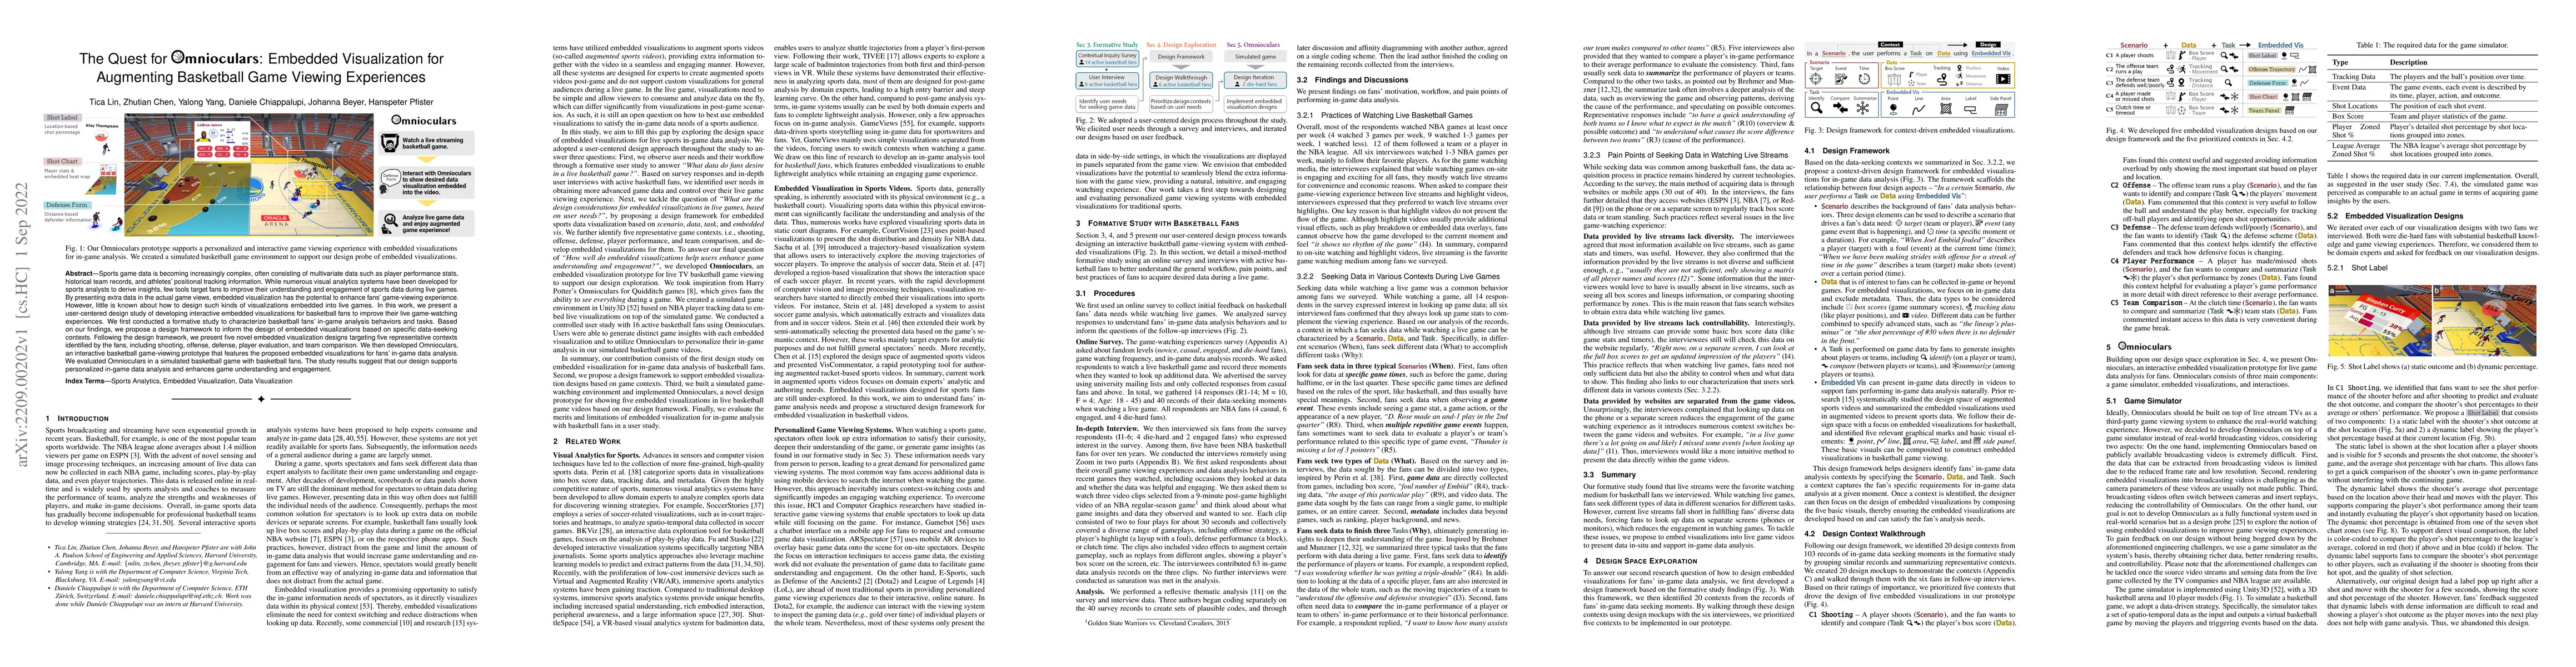
Sports game data is becoming increasingly complex, often consisting of multivariate data such as player performance stats, historical team records, and athletes' positional tracking information. Whi...
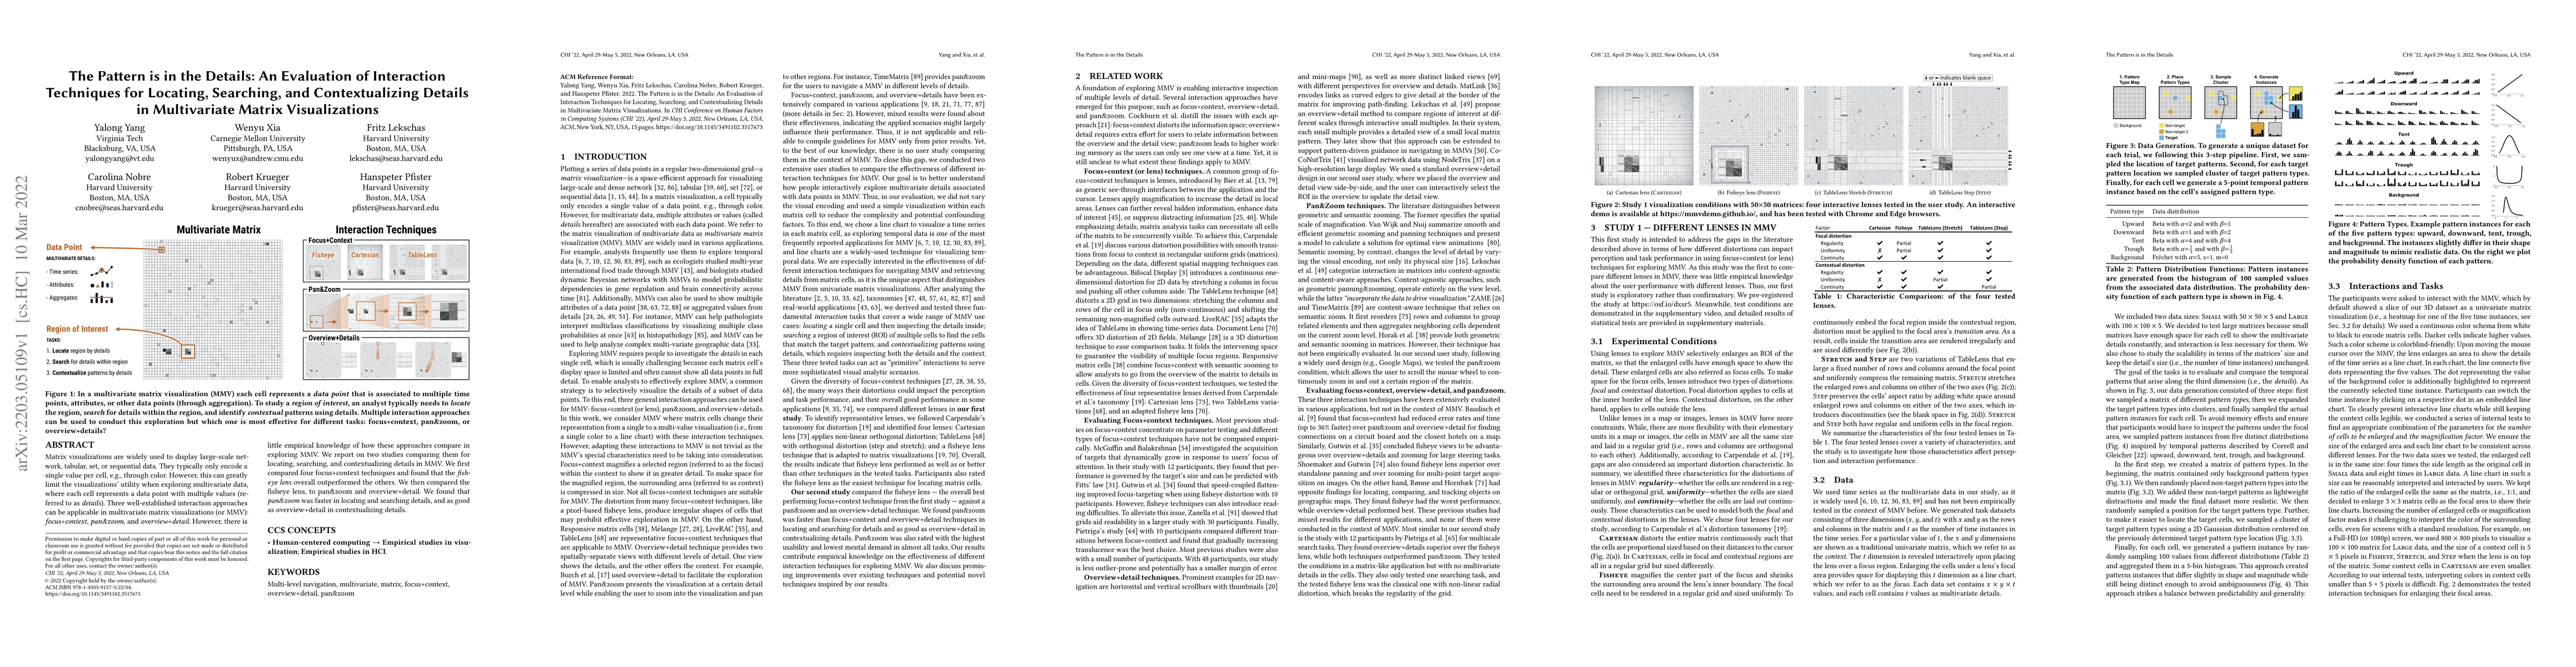
Matrix visualizations are widely used to display large-scale network, tabular, set, or sequential data. They typically only encode a single value per cell, e.g., through color. However, this can gre...
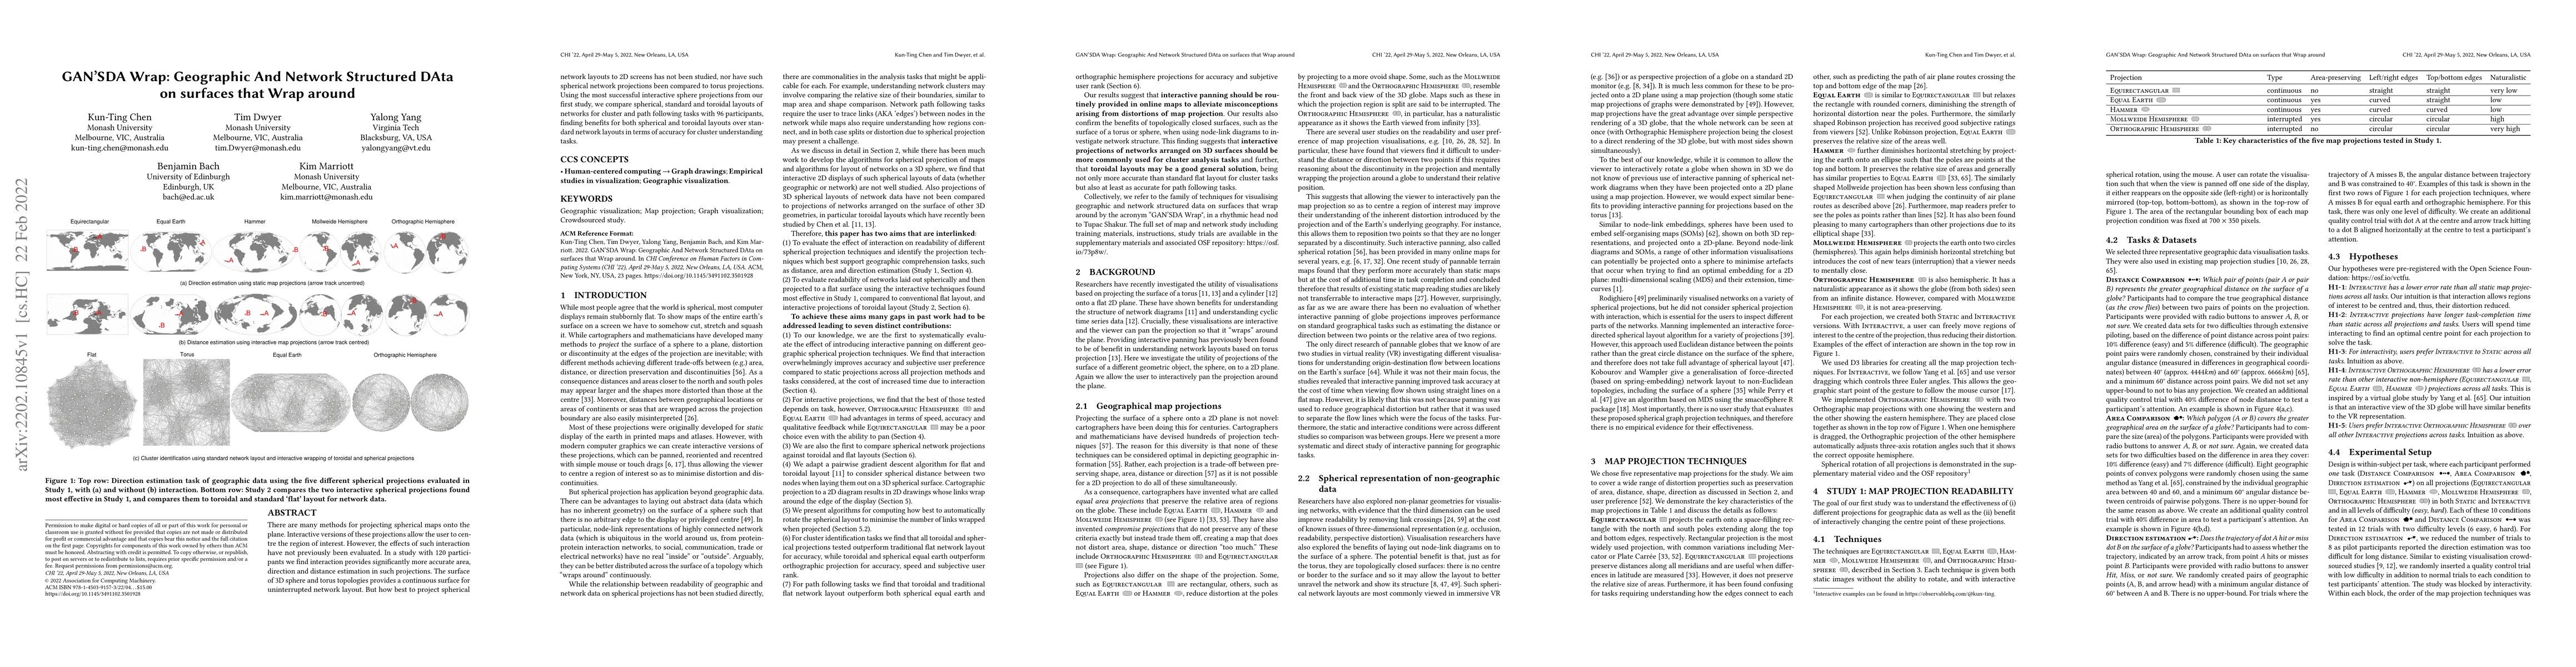
There are many methods for projecting spherical maps onto the plane. Interactive versions of these projections allow the user to centre the region of interest. However, the effects of such interacti...
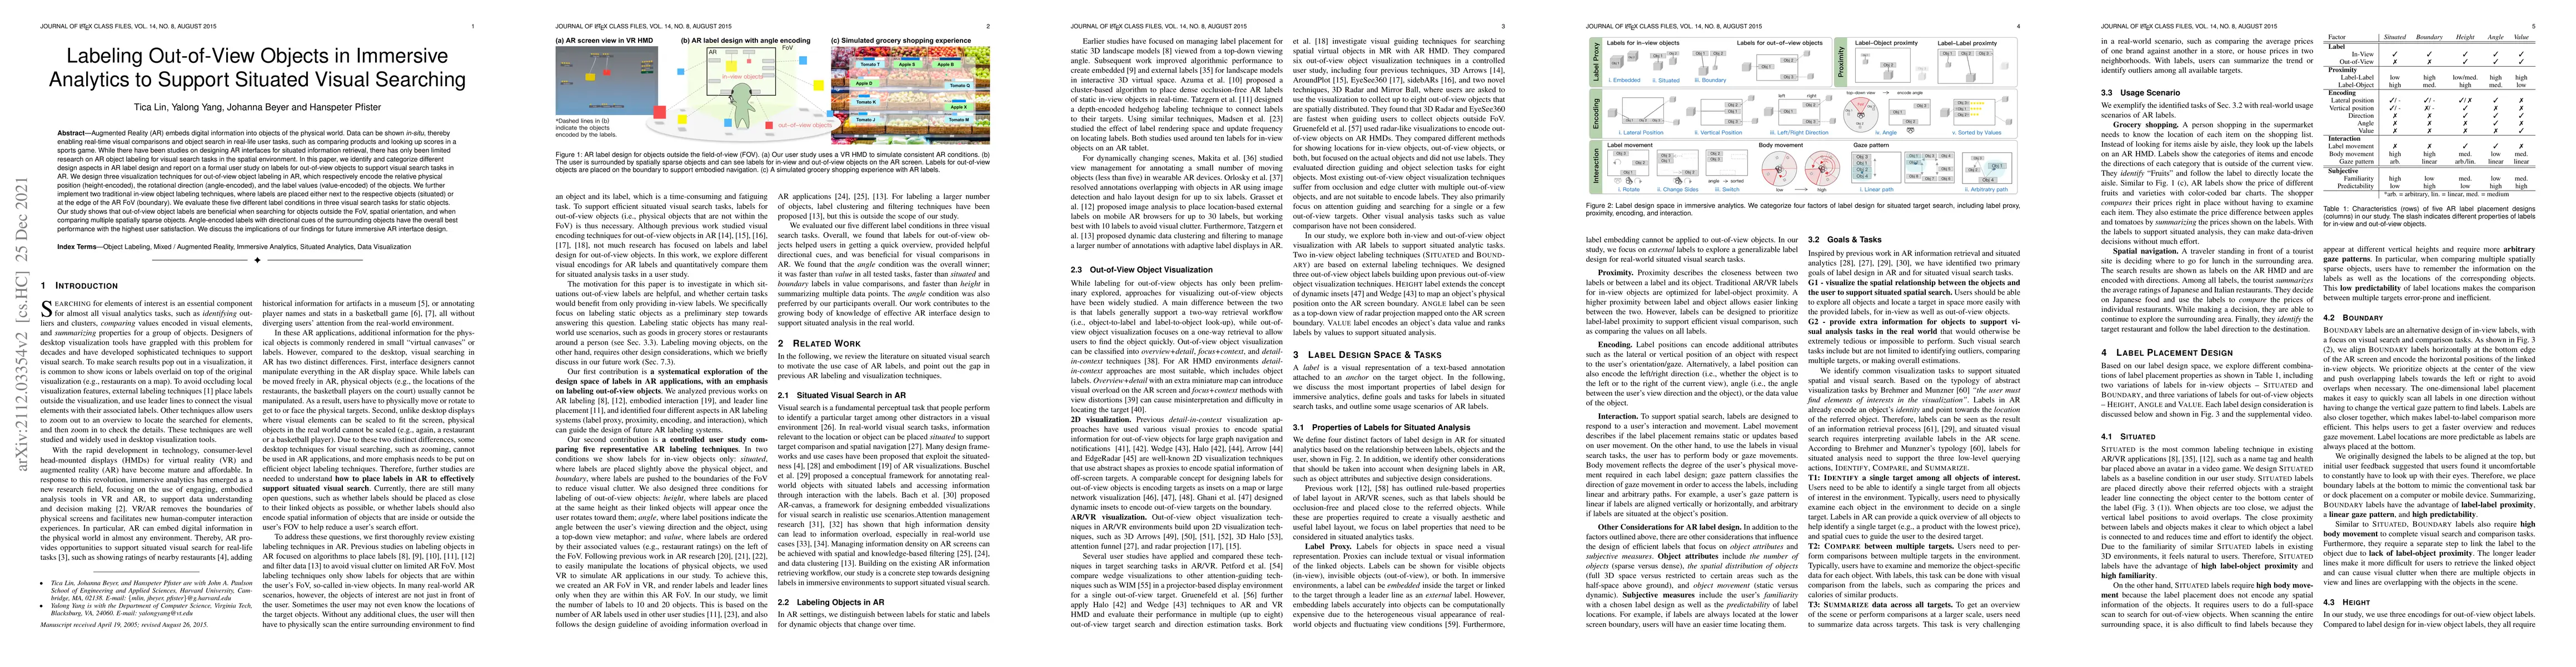
Augmented Reality (AR) embeds digital information into objects of the physical world. Data can be shown in-situ, thereby enabling real-time visual comparisons and object search in real-life user tas...
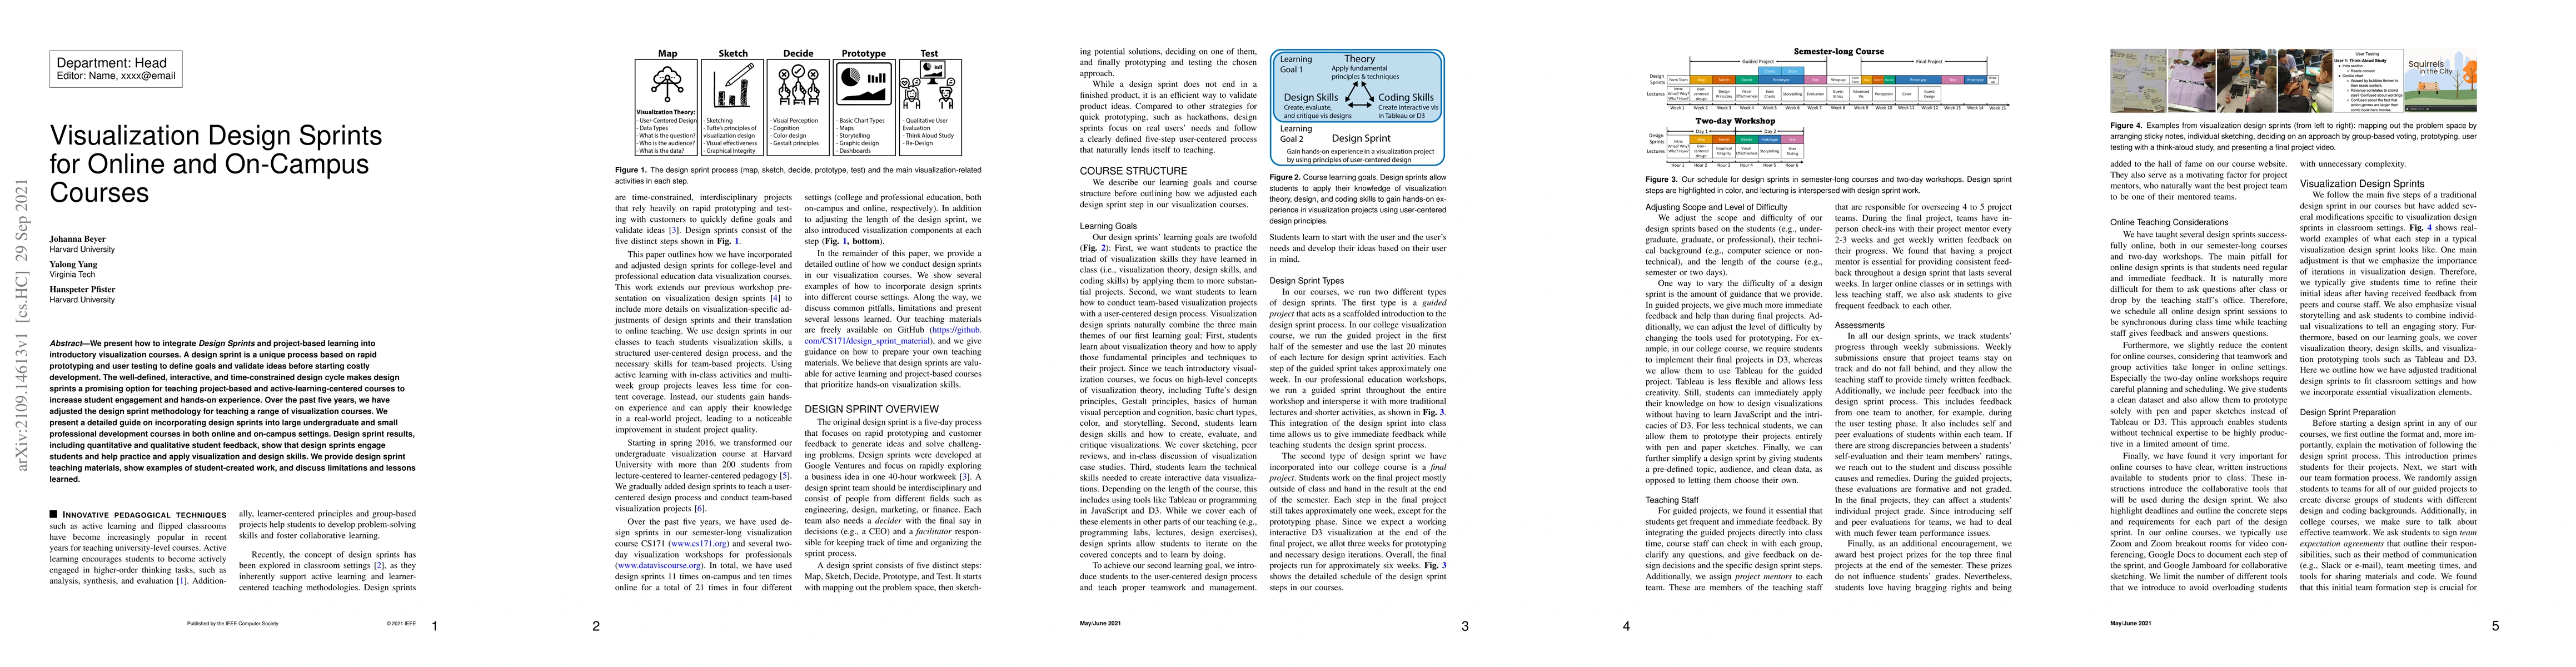
We present how to integrate Design Sprints and project-based learning into introductory visualization courses. A design sprint is a unique process based on rapid prototyping and user testing to defi...
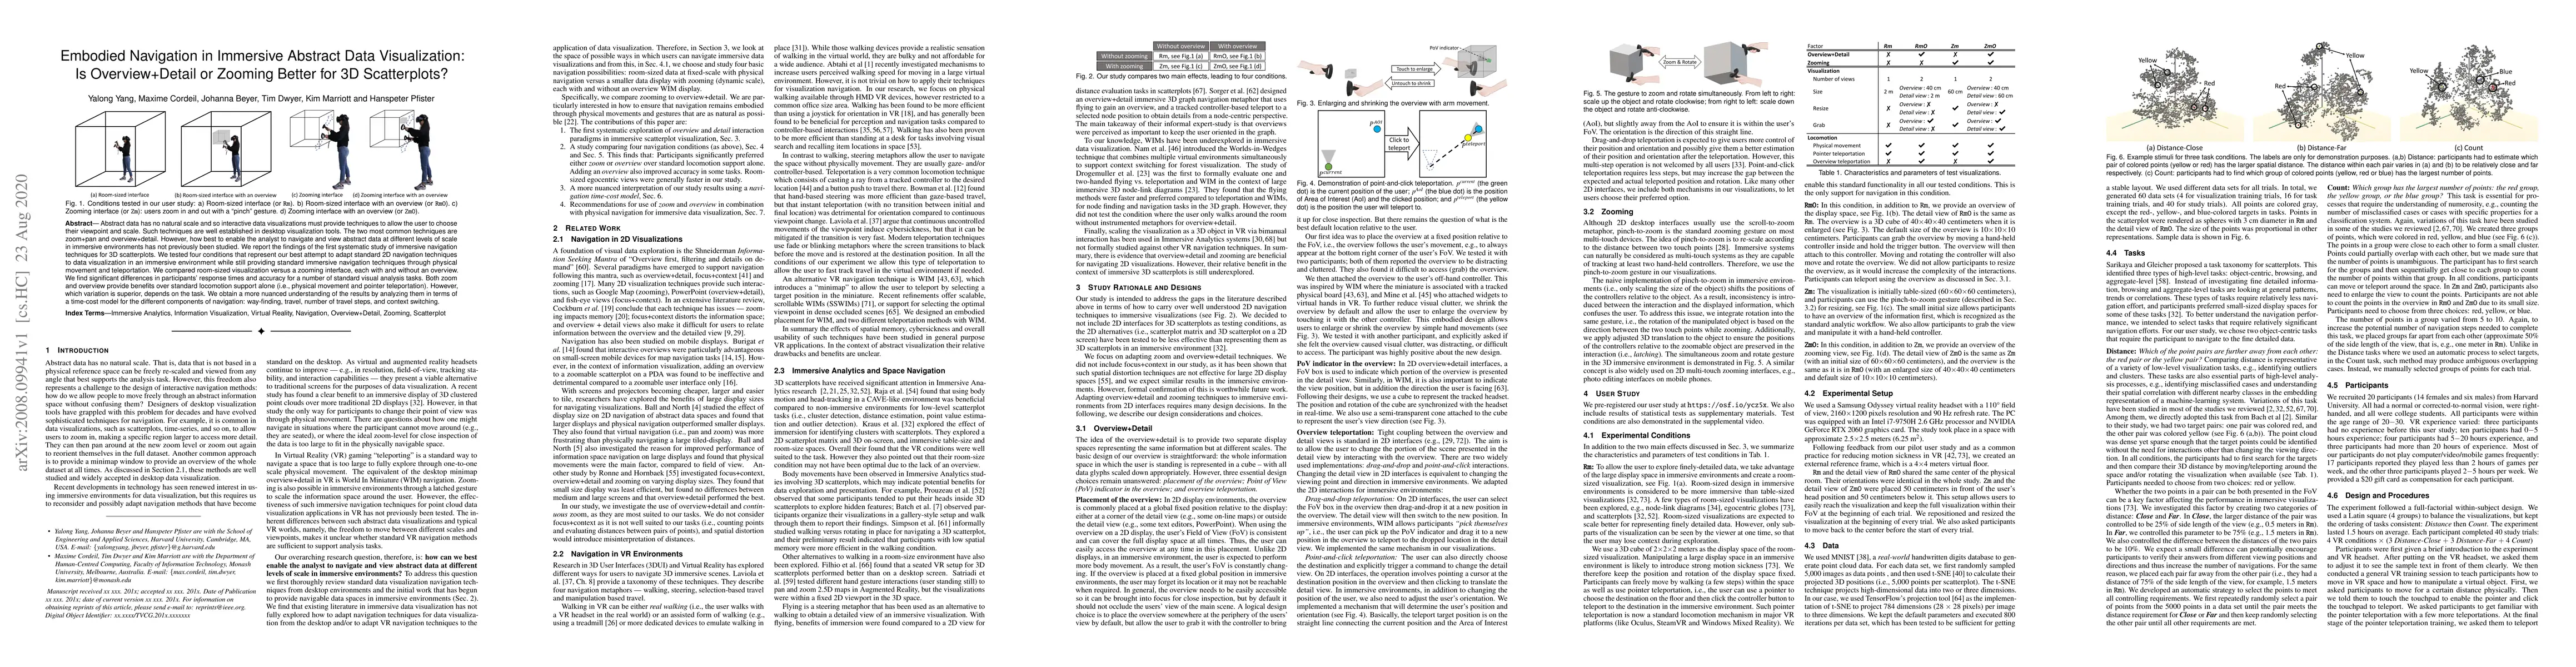
Abstract data has no natural scale and so interactive data visualizations must provide techniques to allow the user to choose their viewpoint and scale. Such techniques are well established in deskt...
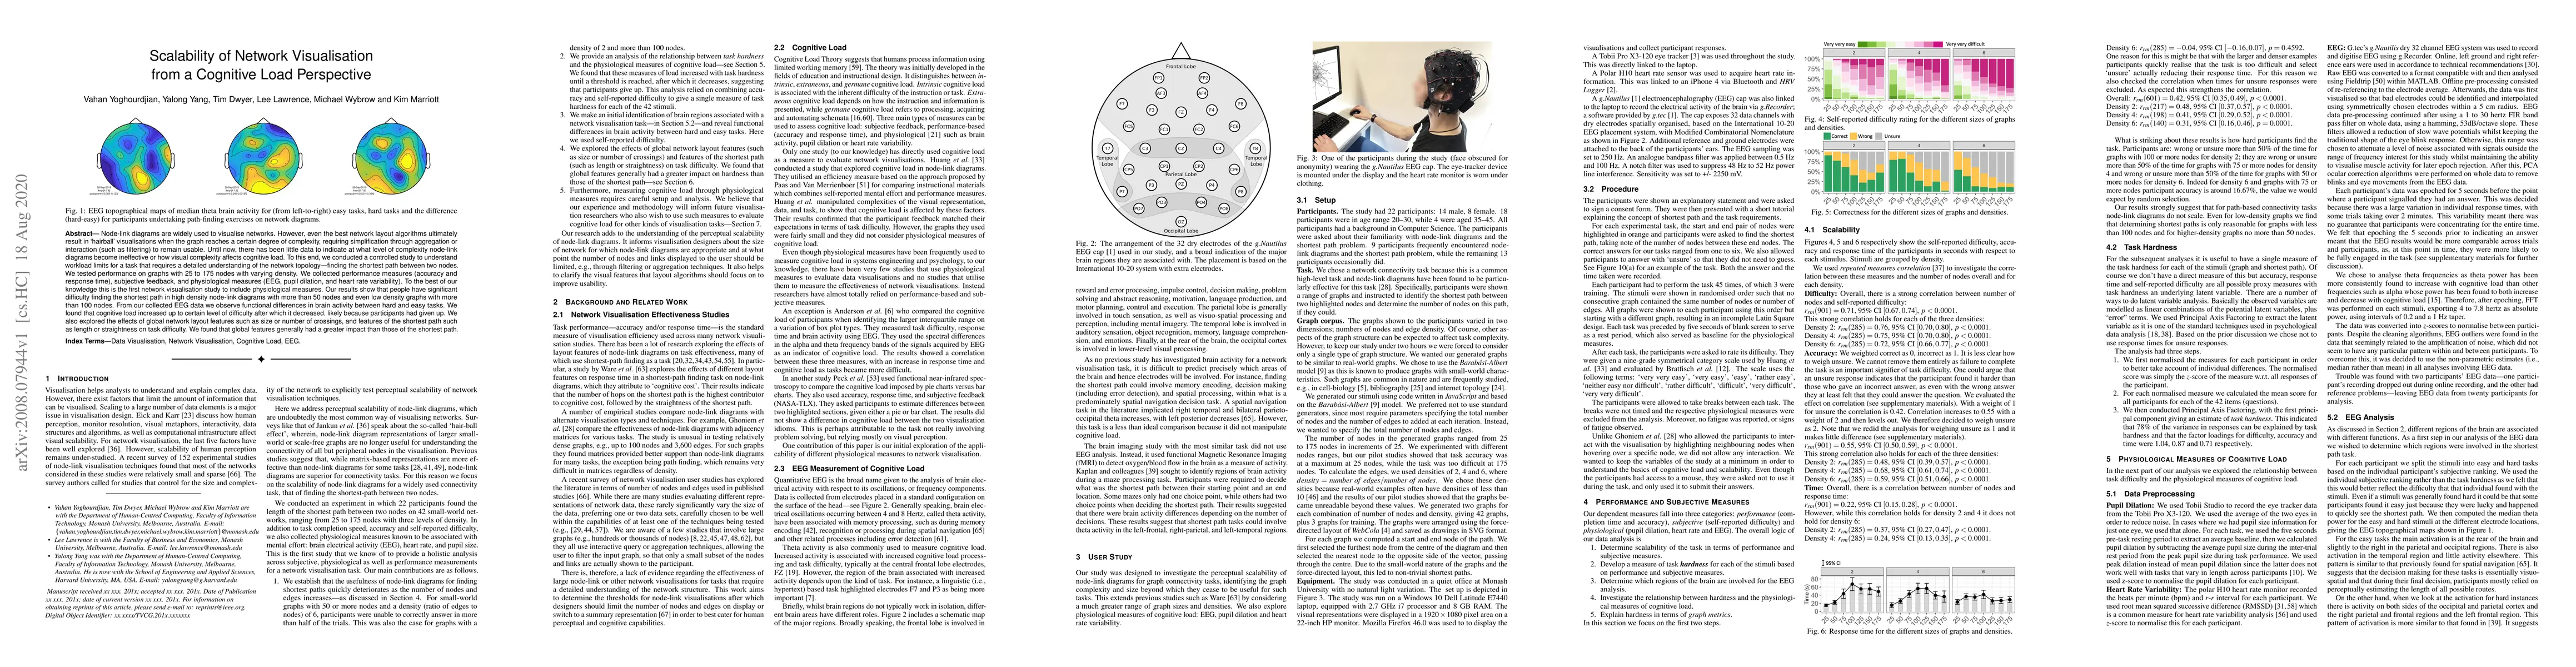
Node-link diagrams are widely used to visualise networks. However, even the best network layout algorithms ultimately result in 'hairball' visualisations when the graph reaches a certain degree of c...
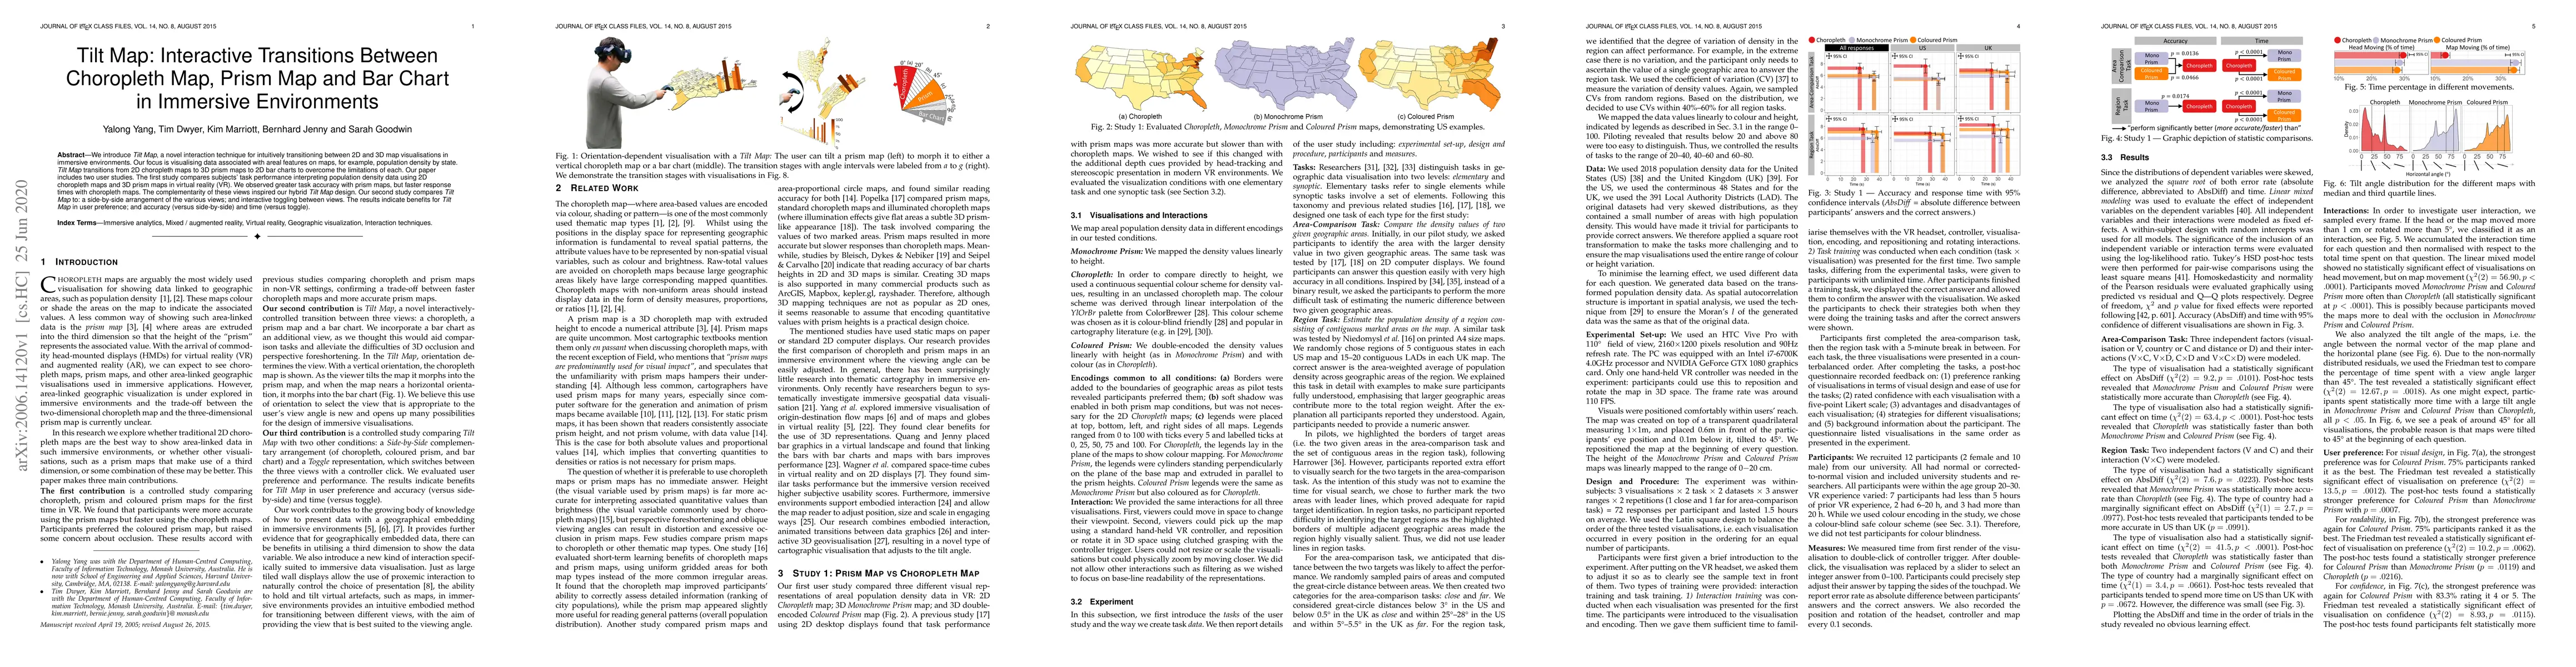
We introduce Tilt Map, a novel interaction technique for intuitively transitioning between 2D and 3D map visualisations in immersive environments. Our focus is visualising data associated with areal...
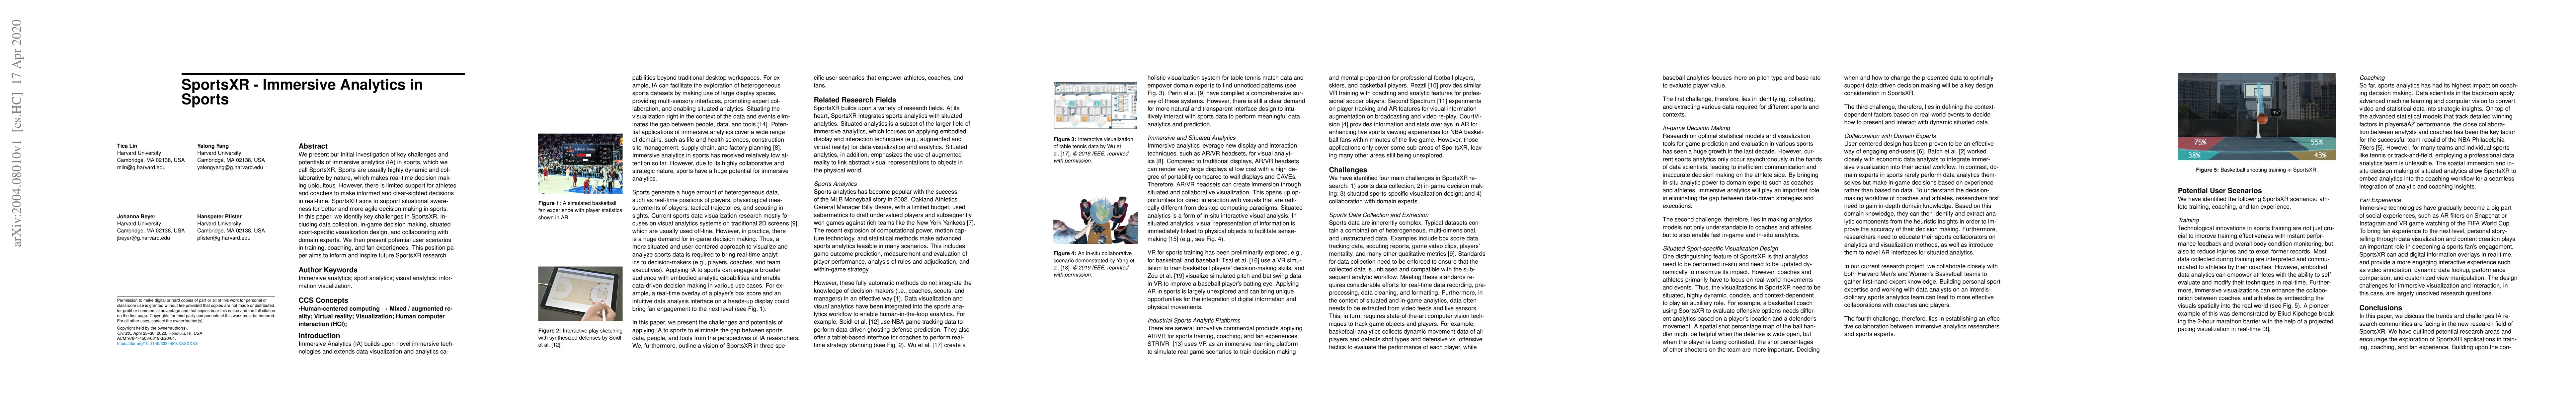
We present our initial investigation of key challenges and potentials of immersive analytics (IA) in sports, which we call SportsXR. Sports are usually highly dynamic and collaborative by nature, wh...
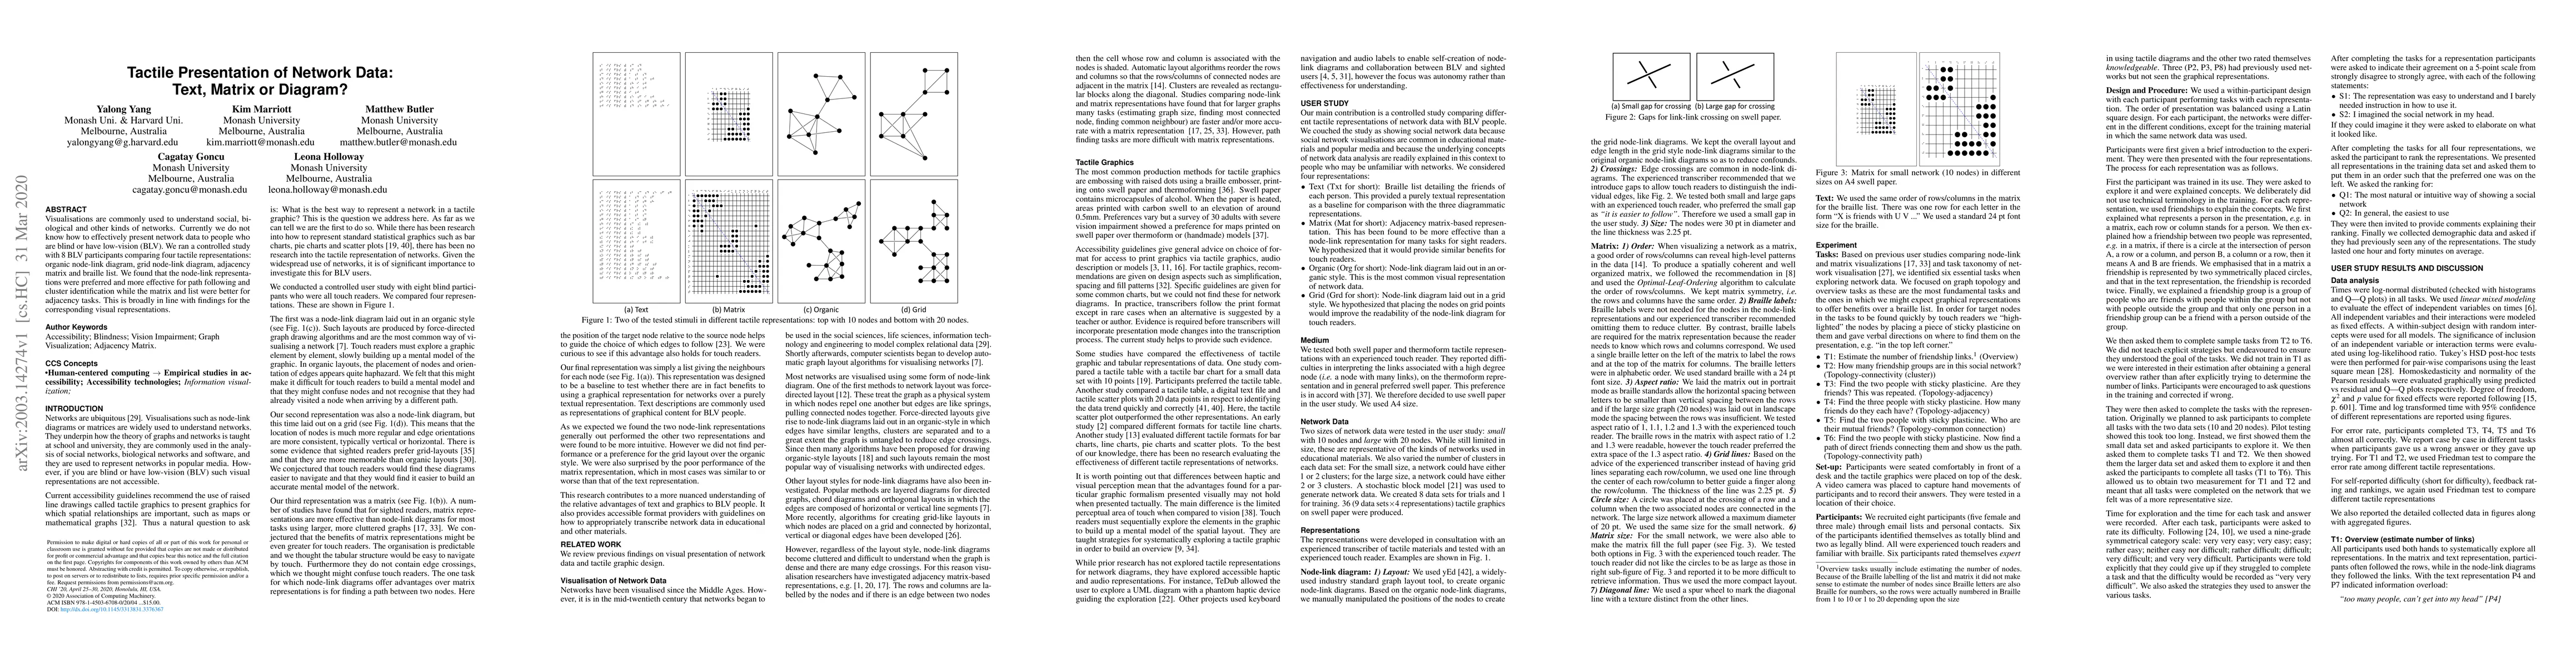
Visualisations are commonly used to understand social, biological and other kinds of networks. Currently, we do not know how to effectively present network data to people who are blind or have low-v...
Immersive virtual- and augmented-reality headsets can overlay a flat image against any surface or hang virtual objects in the space around the user. The technology is rapidly improving and may, in t...
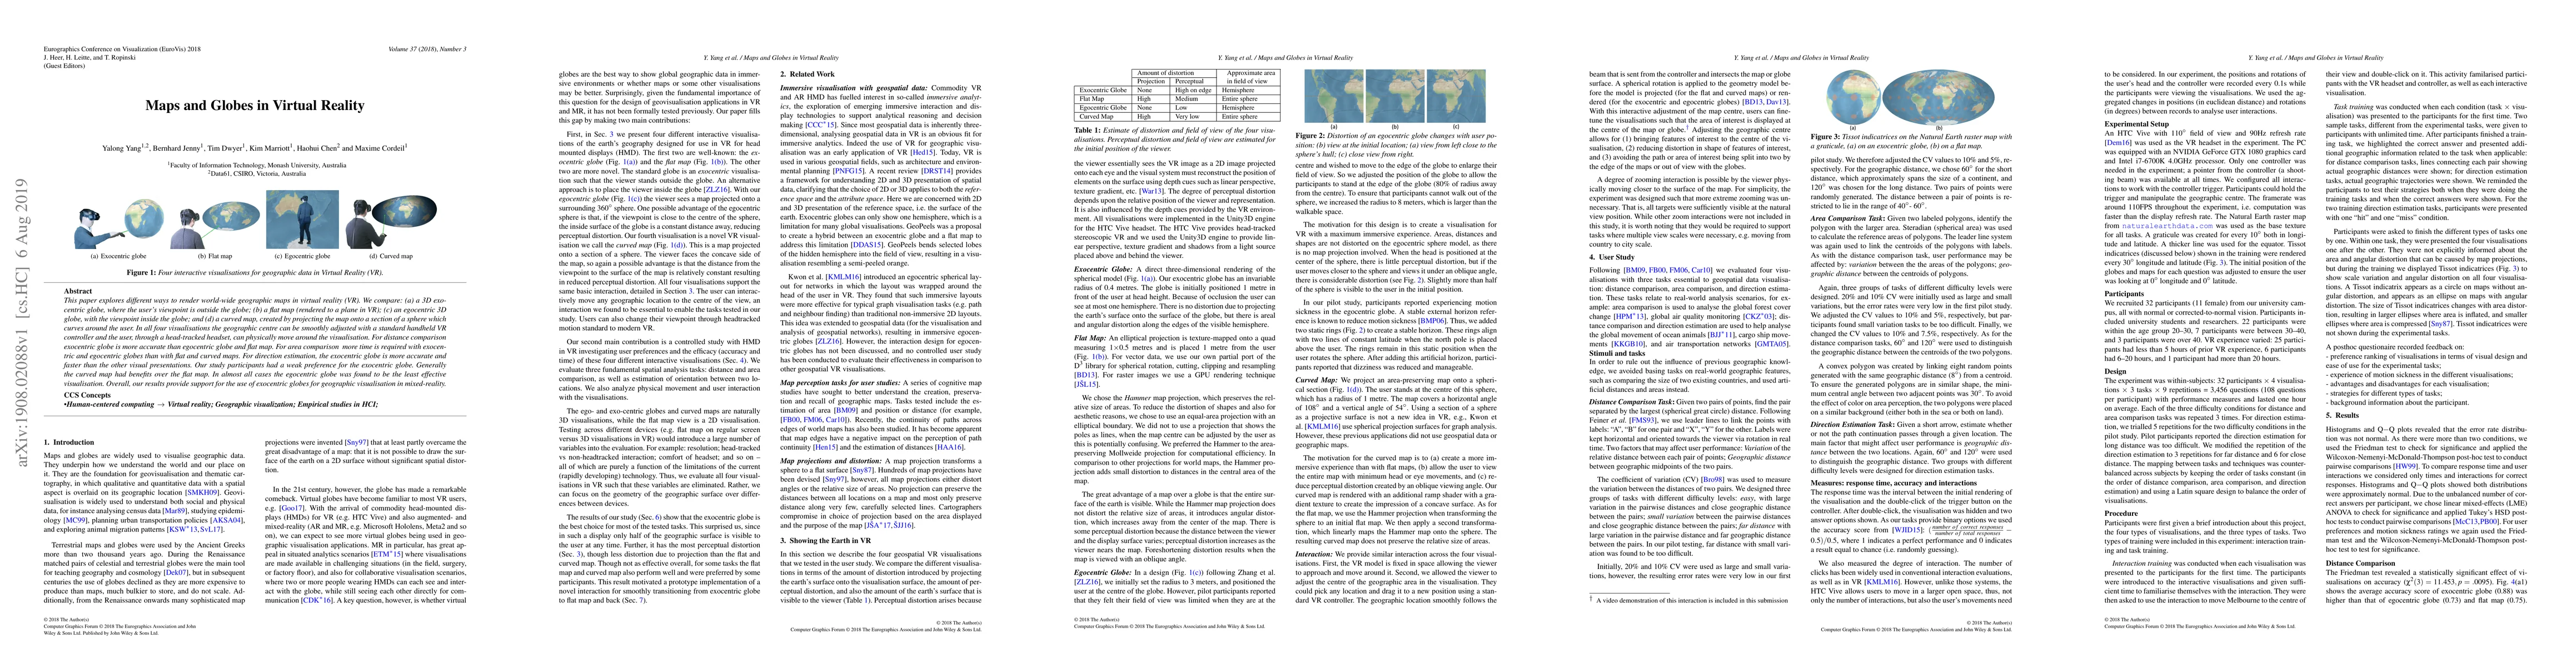
This paper explores different ways to render world-wide geographic maps in virtual reality (VR). We compare: (a) a 3D exocentric globe, where the user's viewpoint is outside the globe; (b) a flat ma...
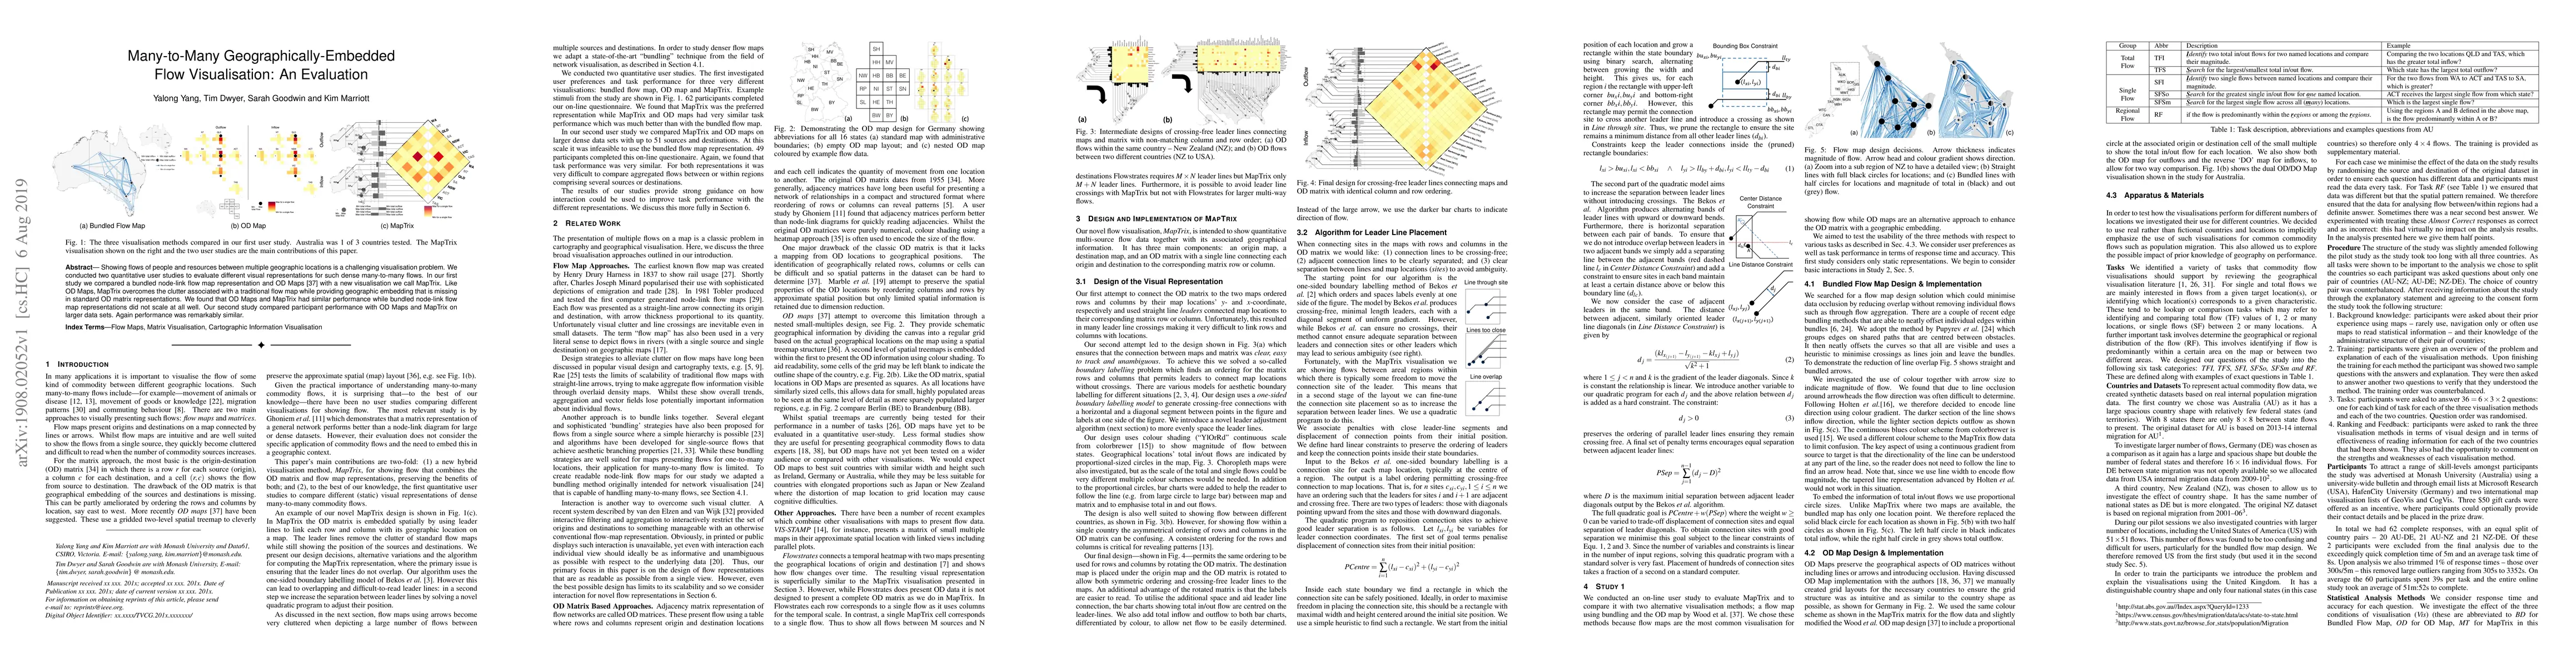
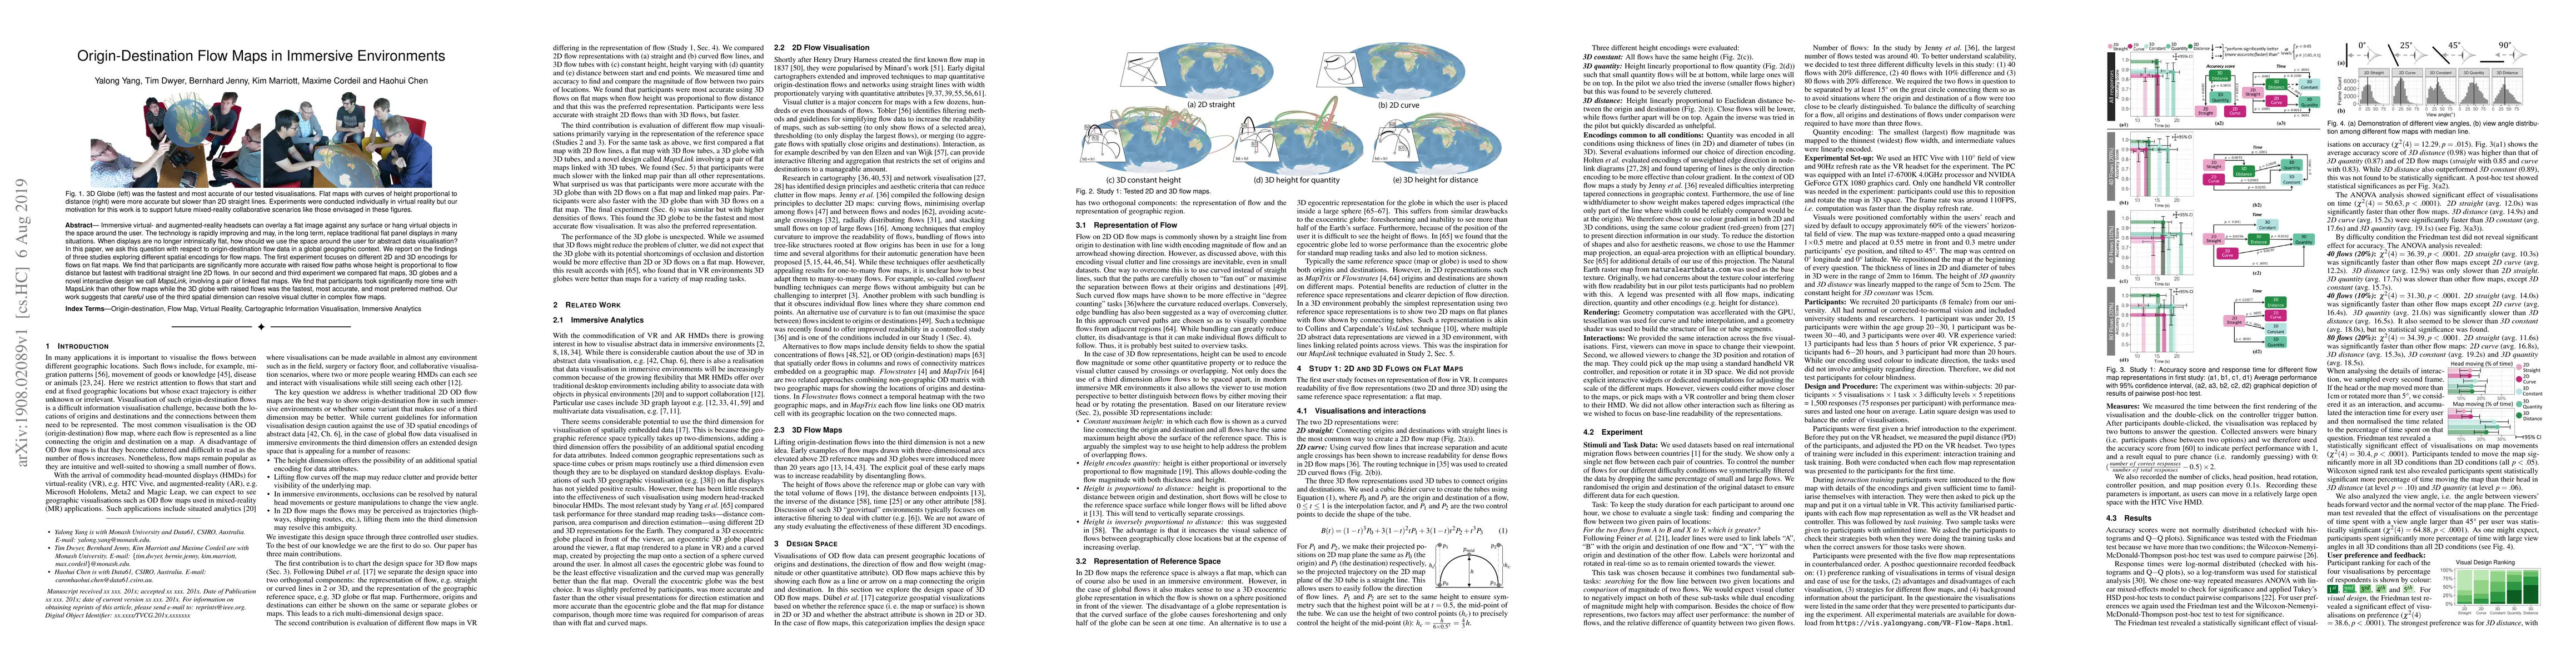
Showing flows of people and resources between multiple geographic locations is a challenging visualisation problem. We conducted two quantitative user studies to evaluate different visual representa...
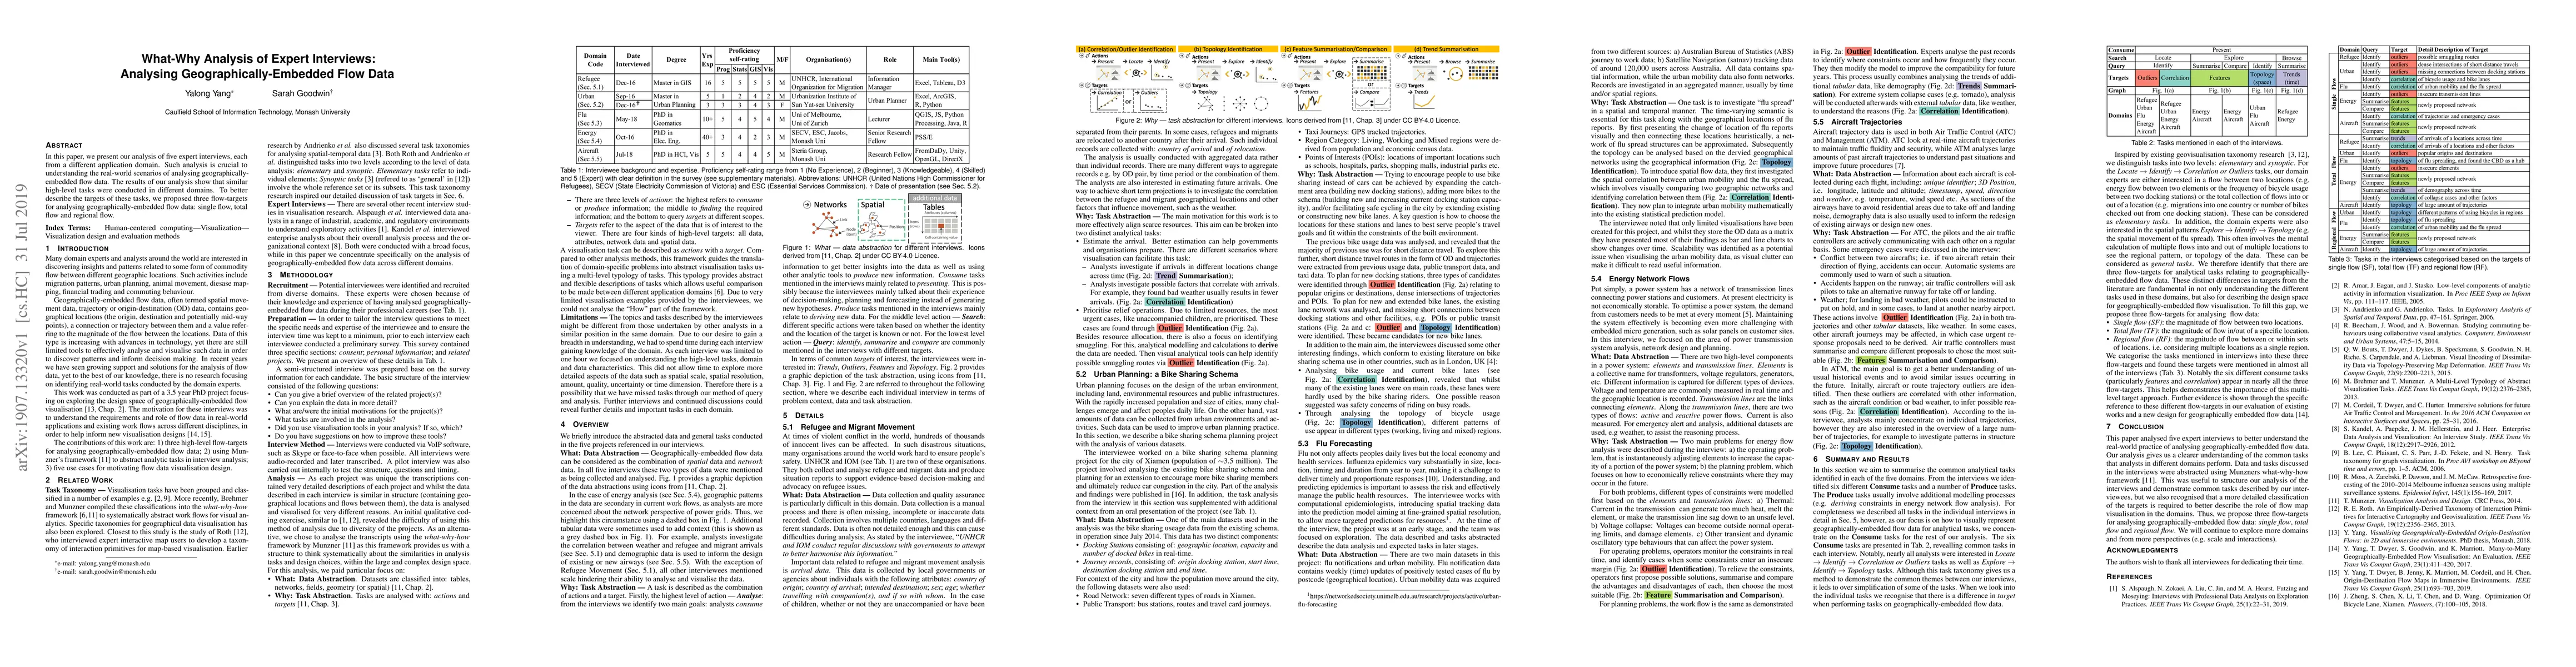
In this paper, we present our analysis of five expert interviews, each from a different application domain. Such analysis is crucial to understanding the real-world scenarios of analysing geographic...
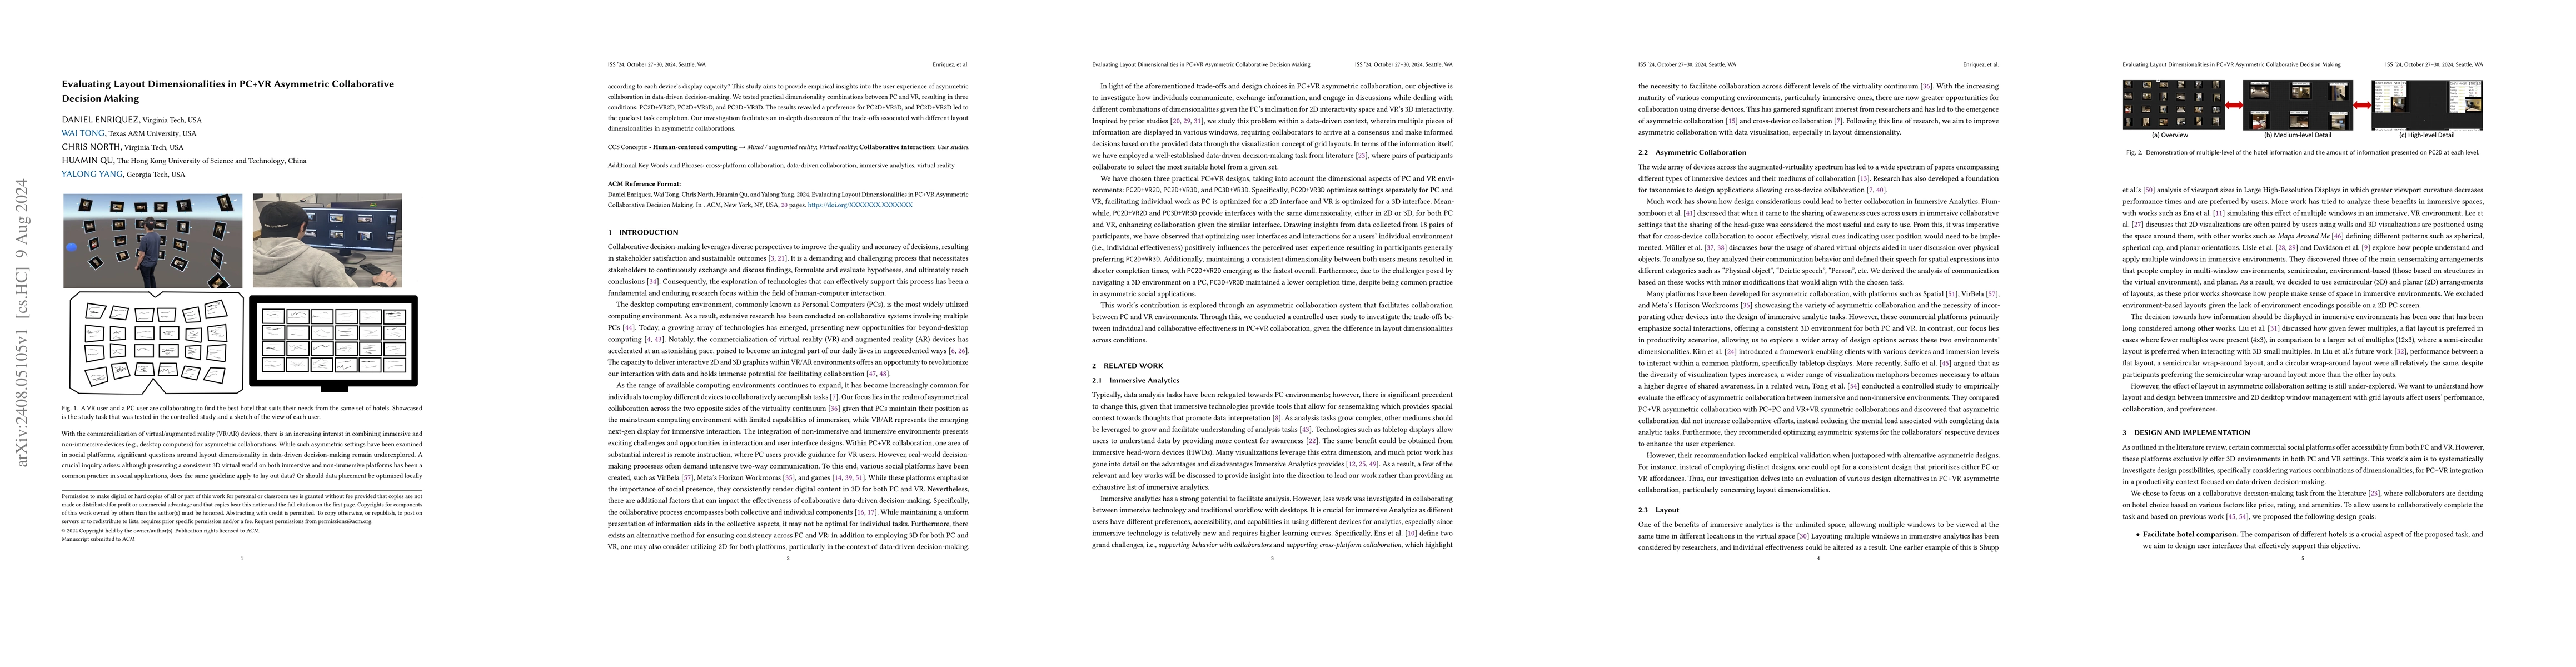
With the commercialization of virtual/augmented reality (VR/AR) devices, there is an increasing interest in combining immersive and non-immersive devices (e.g., desktop computers) for asymmetric colla...
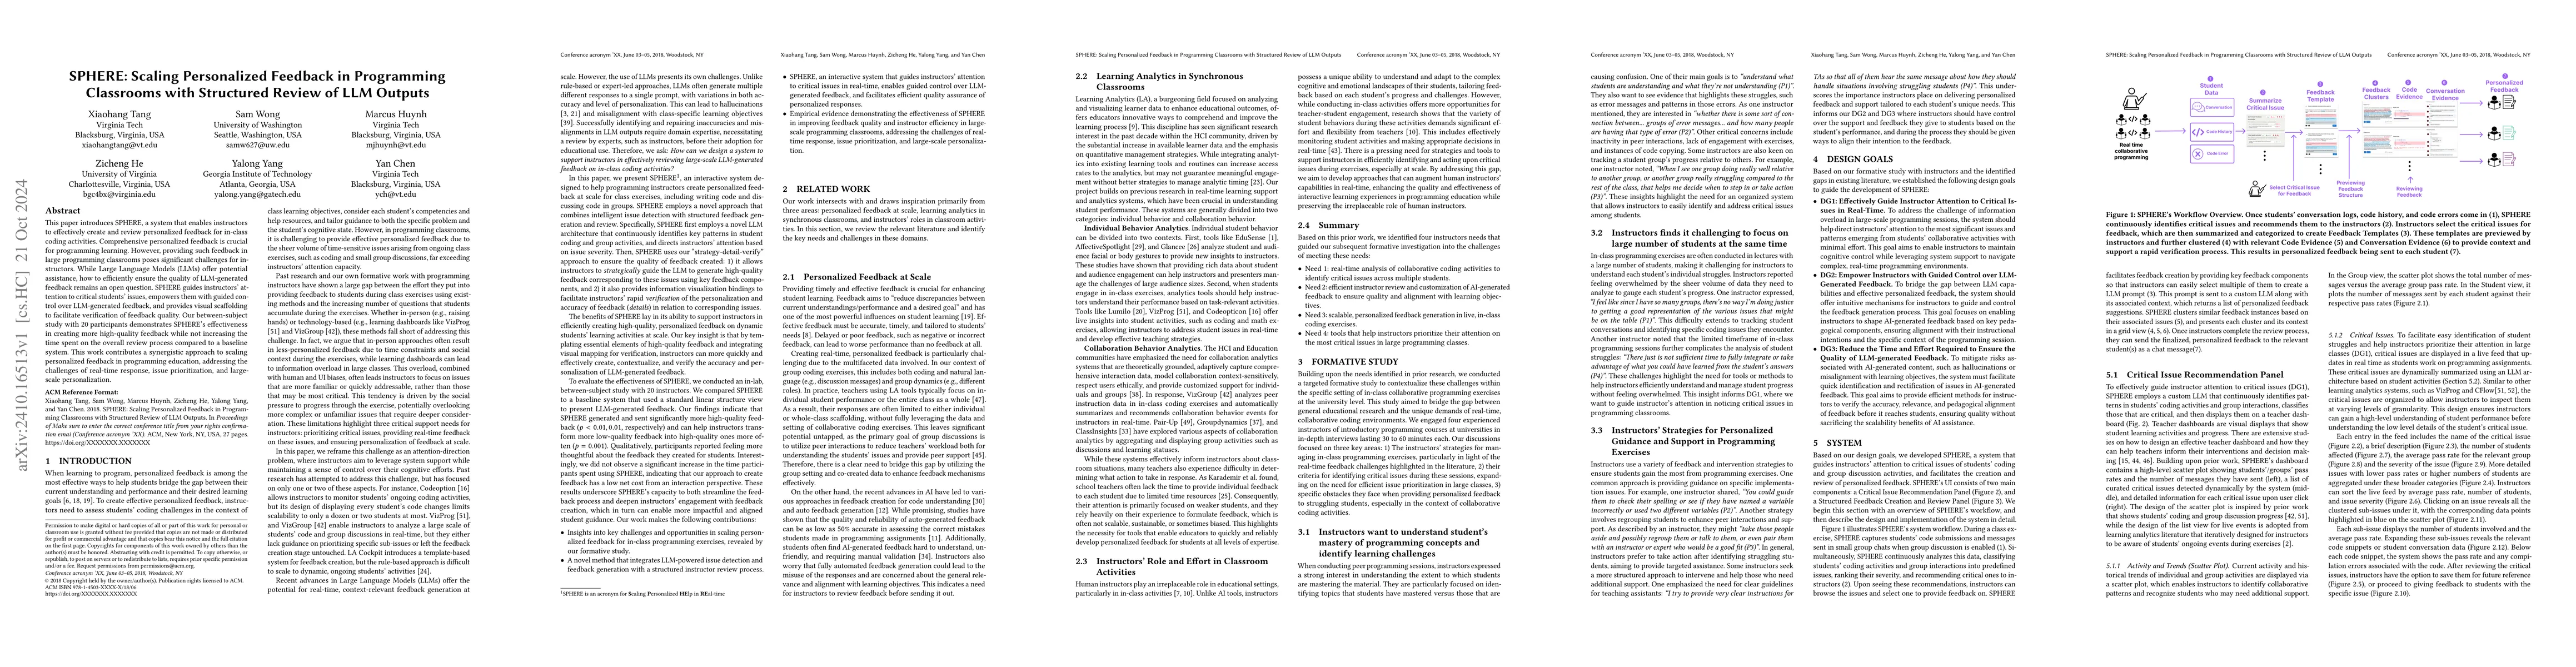
Effective personalized feedback is crucial for learning programming. However, providing personalized, real-time feedback in large programming classrooms poses significant challenges for instructors. T...
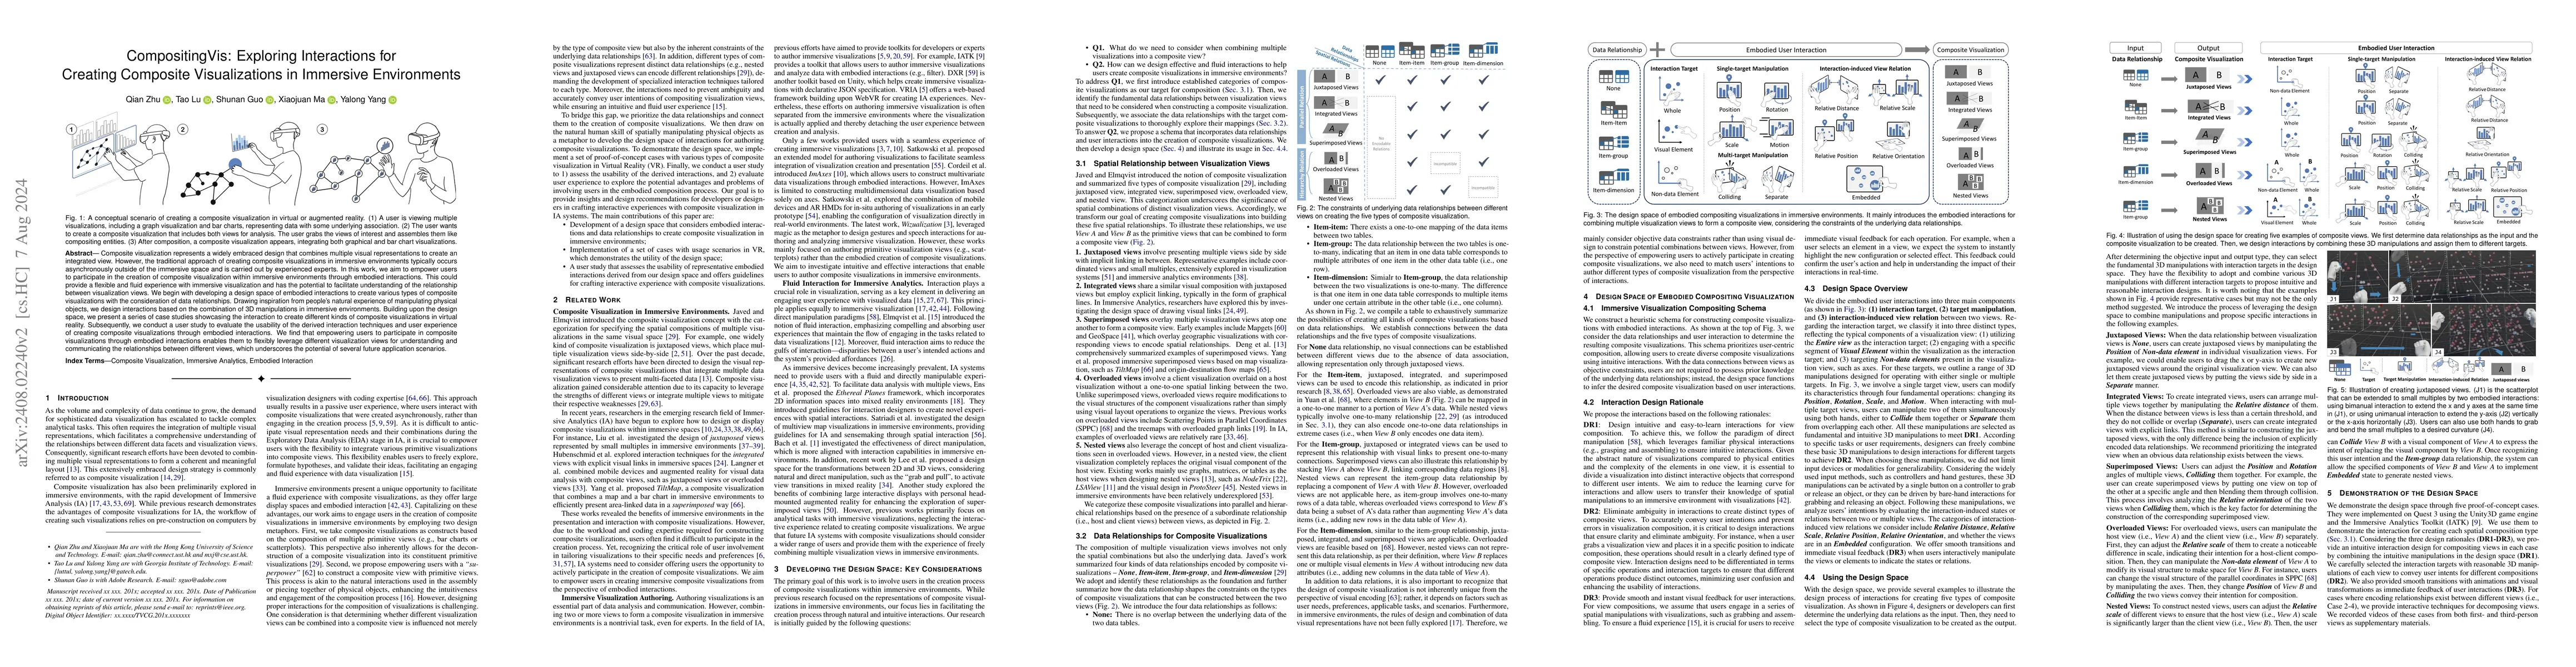
Composite visualization represents a widely embraced design that combines multiple visual representations to create an integrated view. However, the traditional approach of creating composite visualiz...
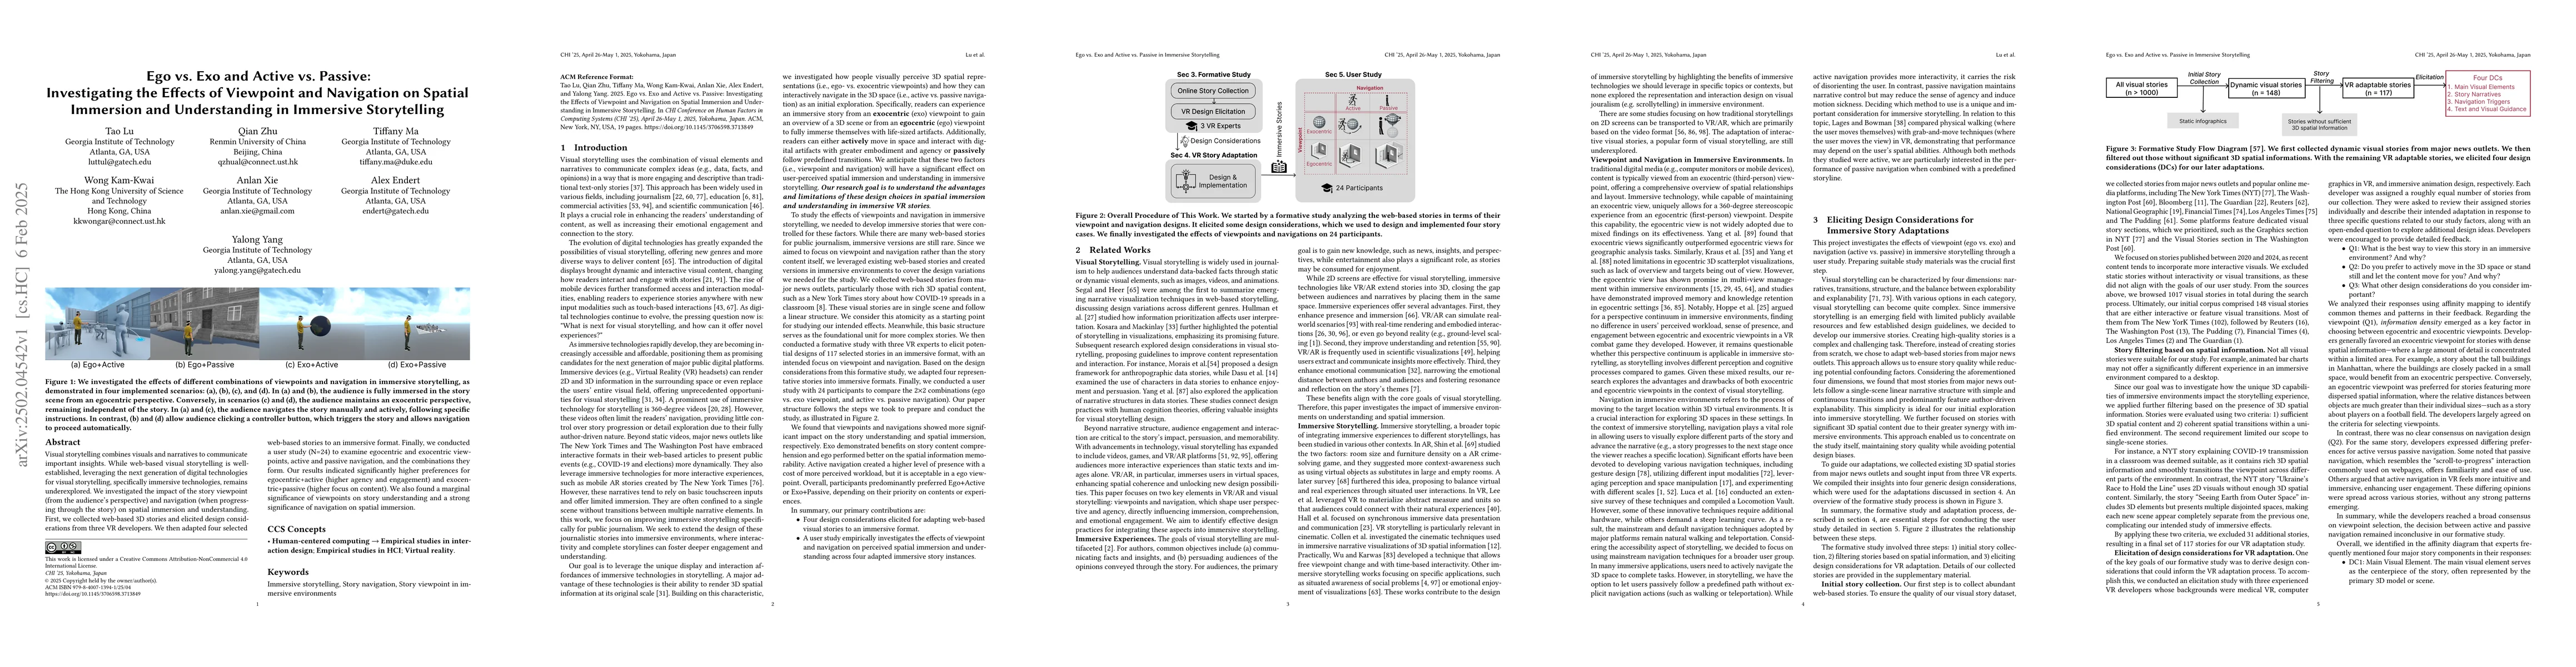
Visual storytelling combines visuals and narratives to communicate important insights. While web-based visual storytelling is well-established, leveraging the next generation of digital technologies f...
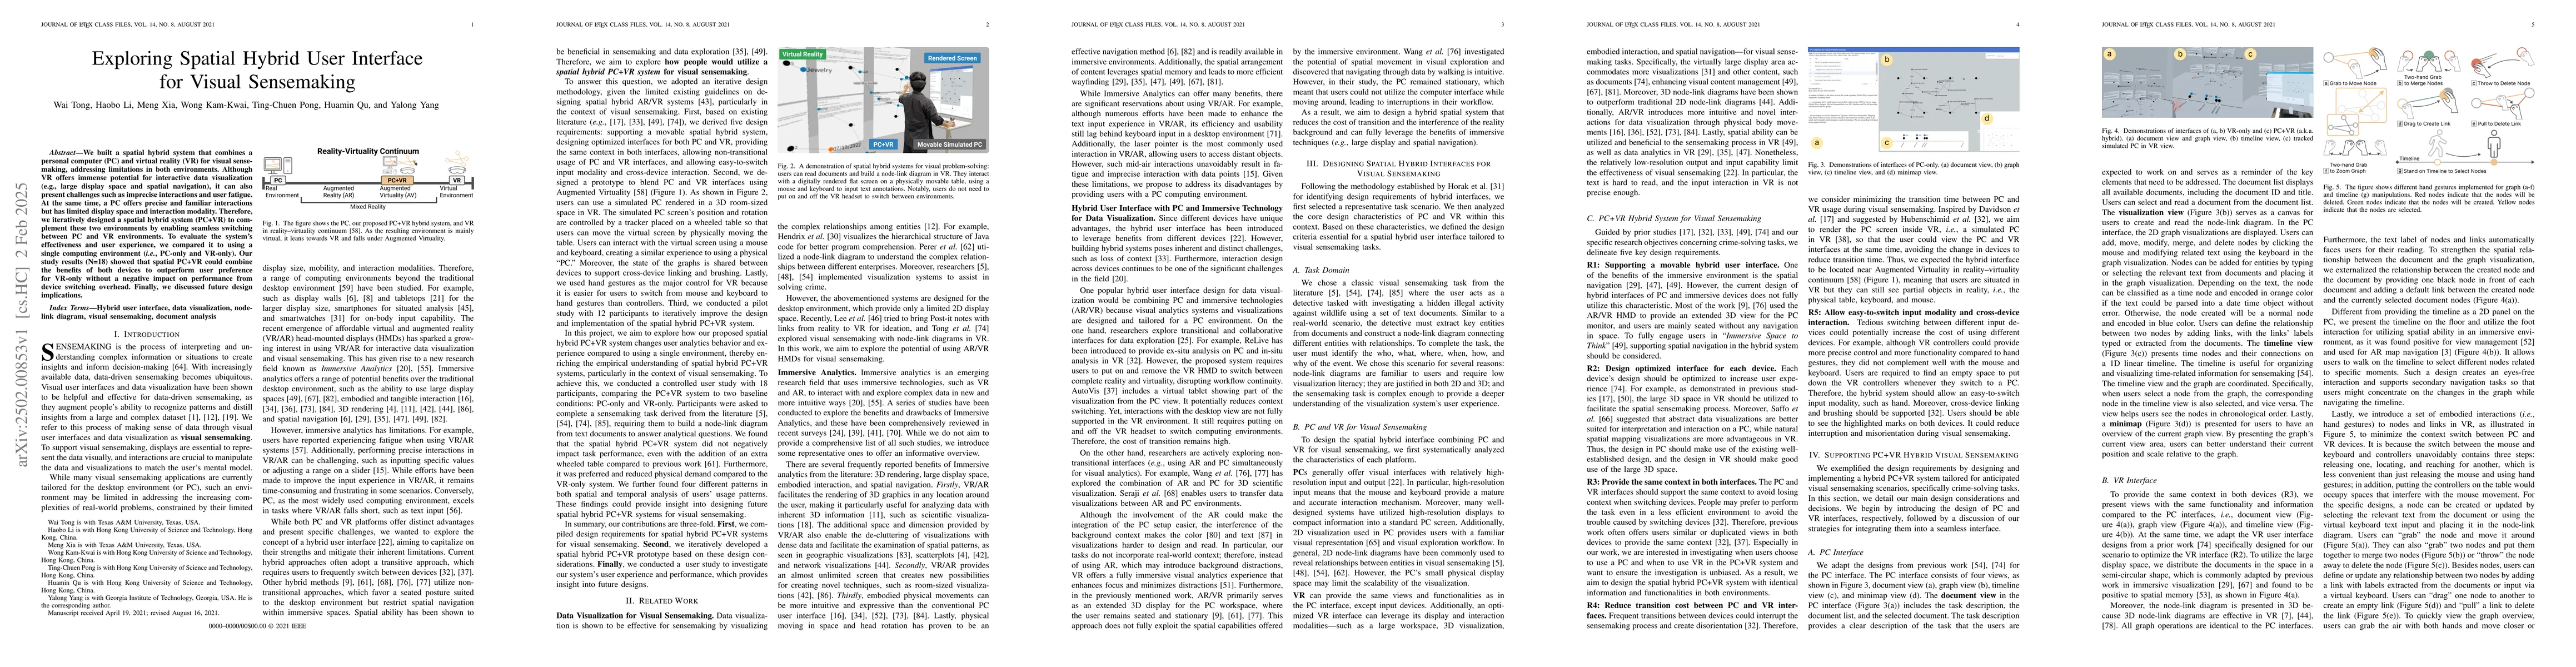
We built a spatial hybrid system that combines a personal computer (PC) and virtual reality (VR) for visual sensemaking, addressing limitations in both environments. Although VR offers immense potenti...
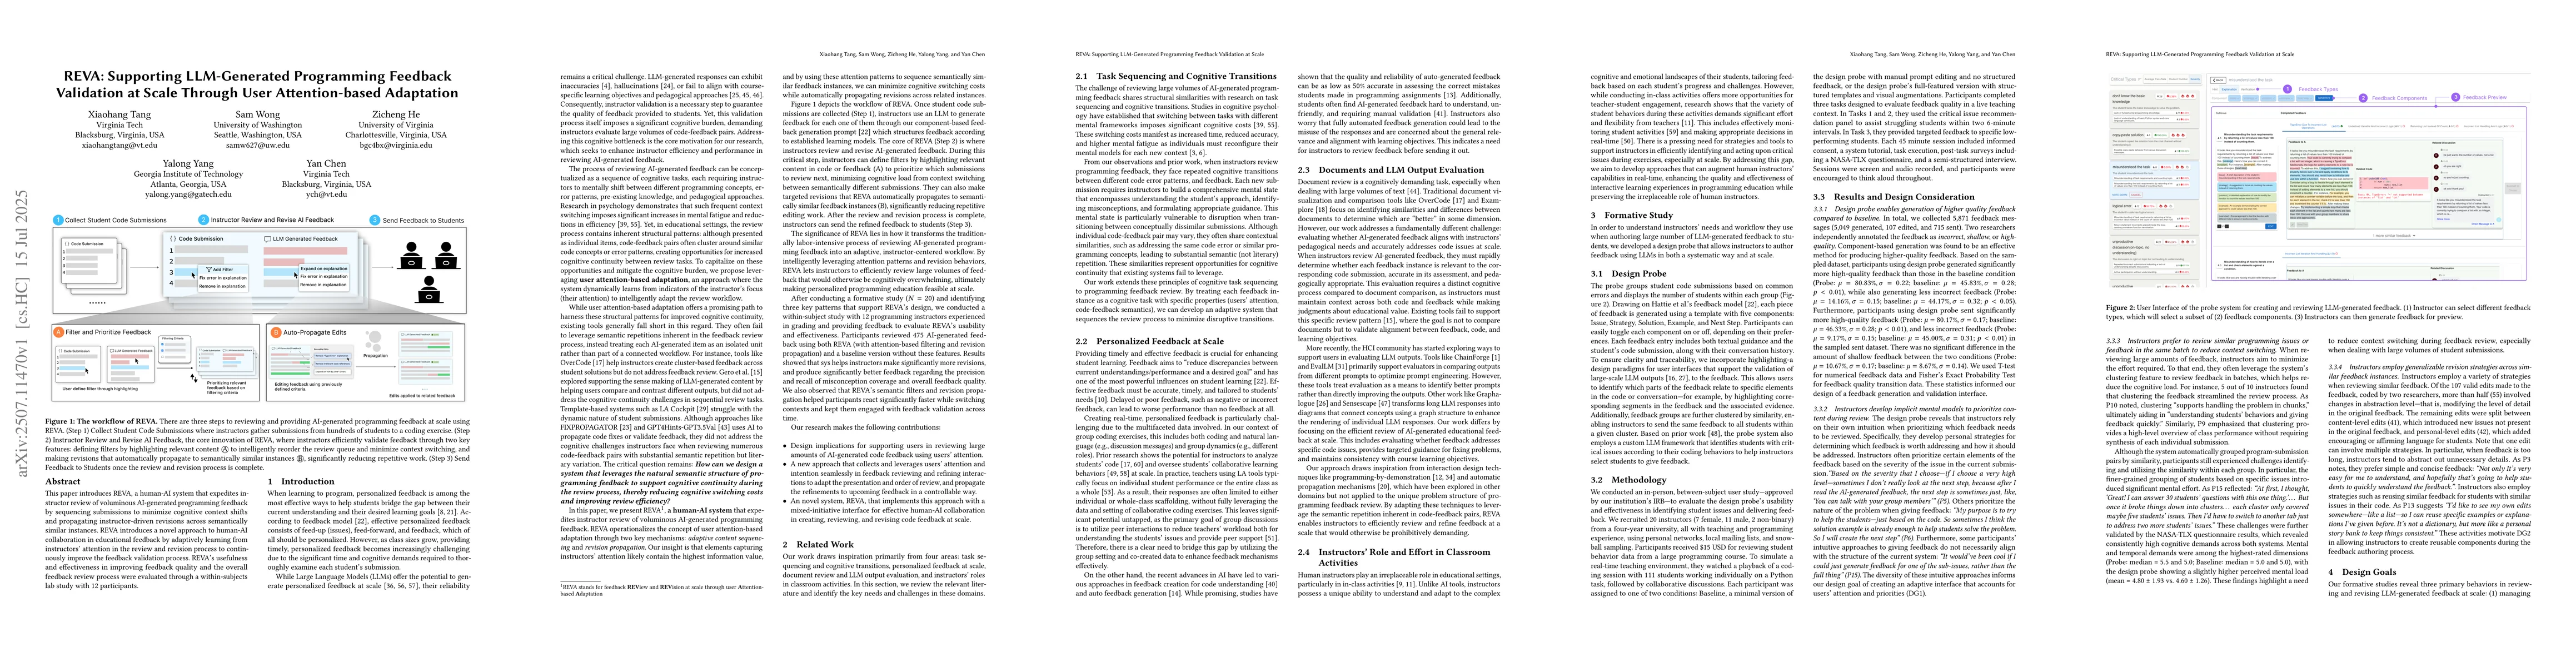
This paper introduces REVA, a human-AI system that expedites instructor review of voluminous AI-generated programming feedback by sequencing submissions to minimize cognitive context shifts and propag...
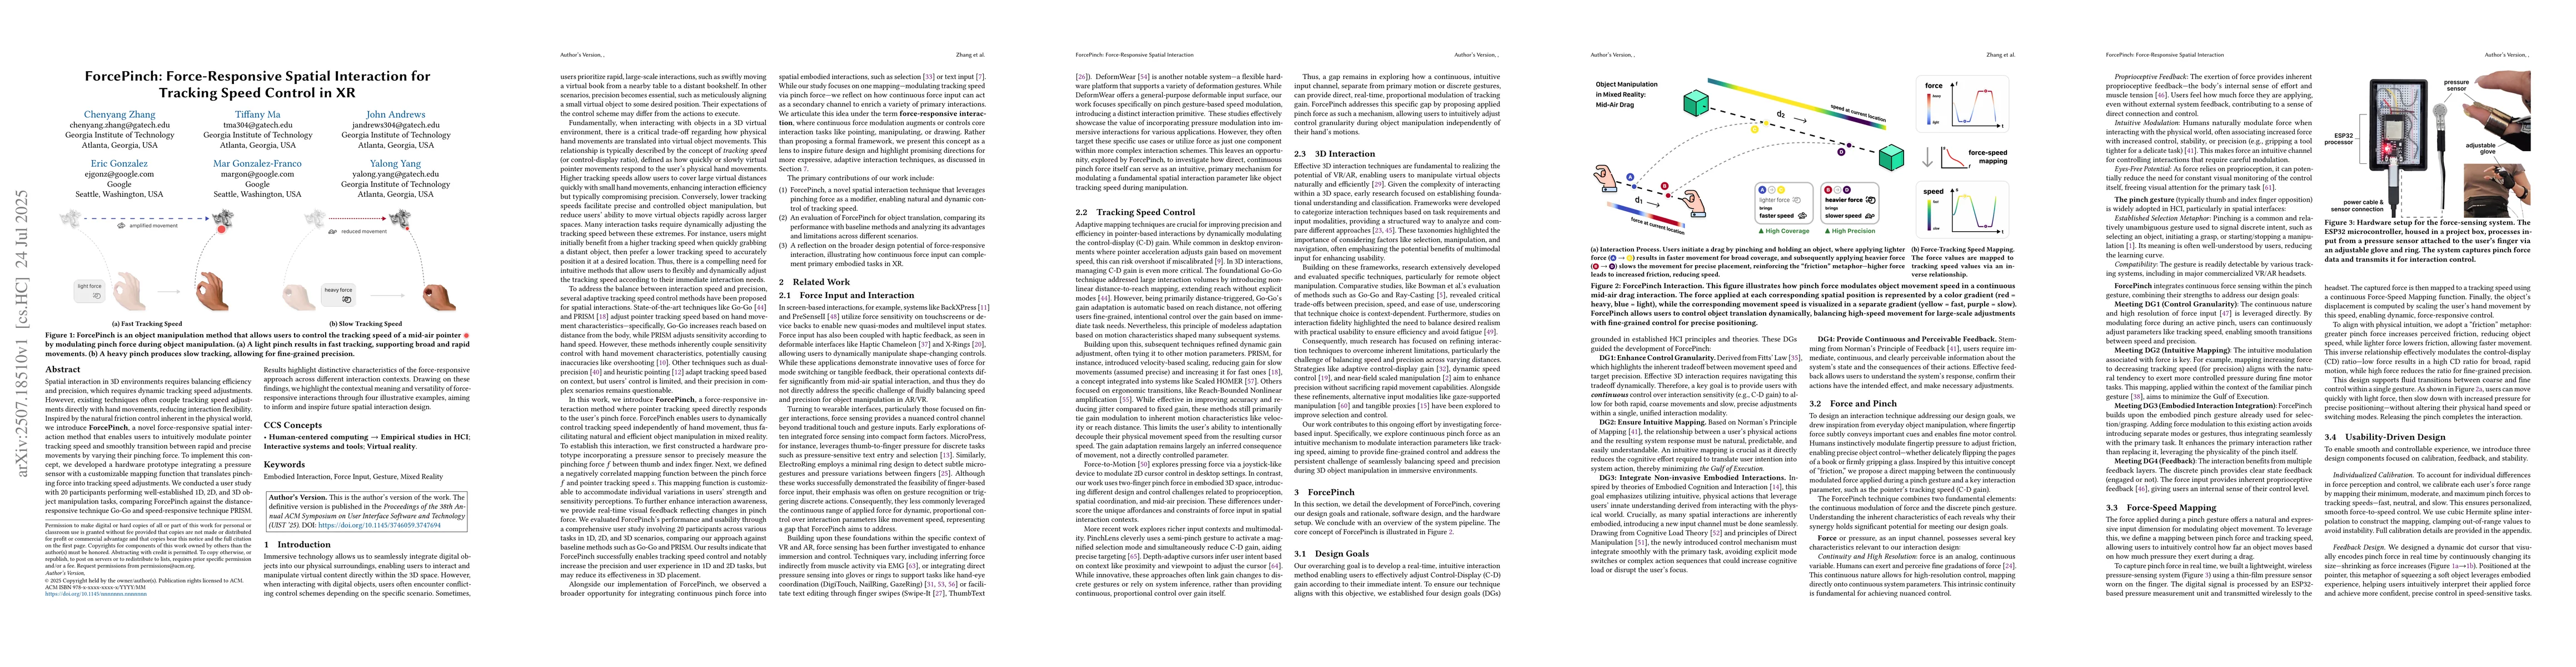
Spatial interaction in 3D environments requires balancing efficiency and precision, which requires dynamic tracking speed adjustments. However, existing techniques often couple tracking speed adjustme...
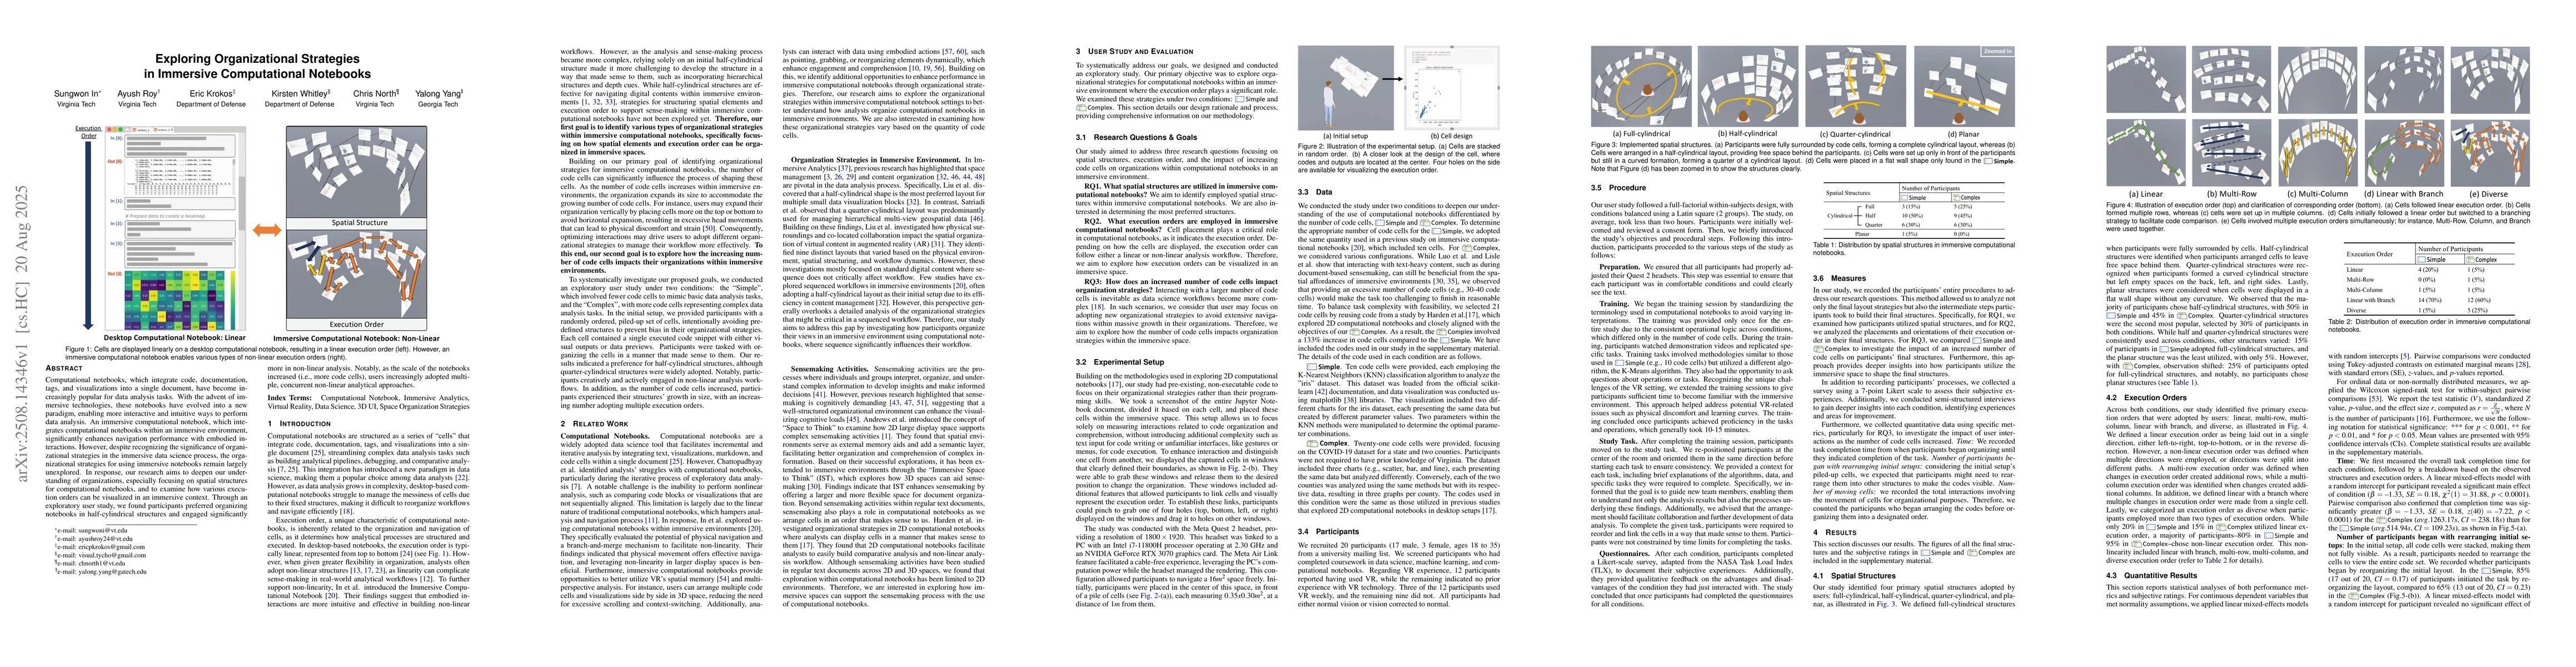
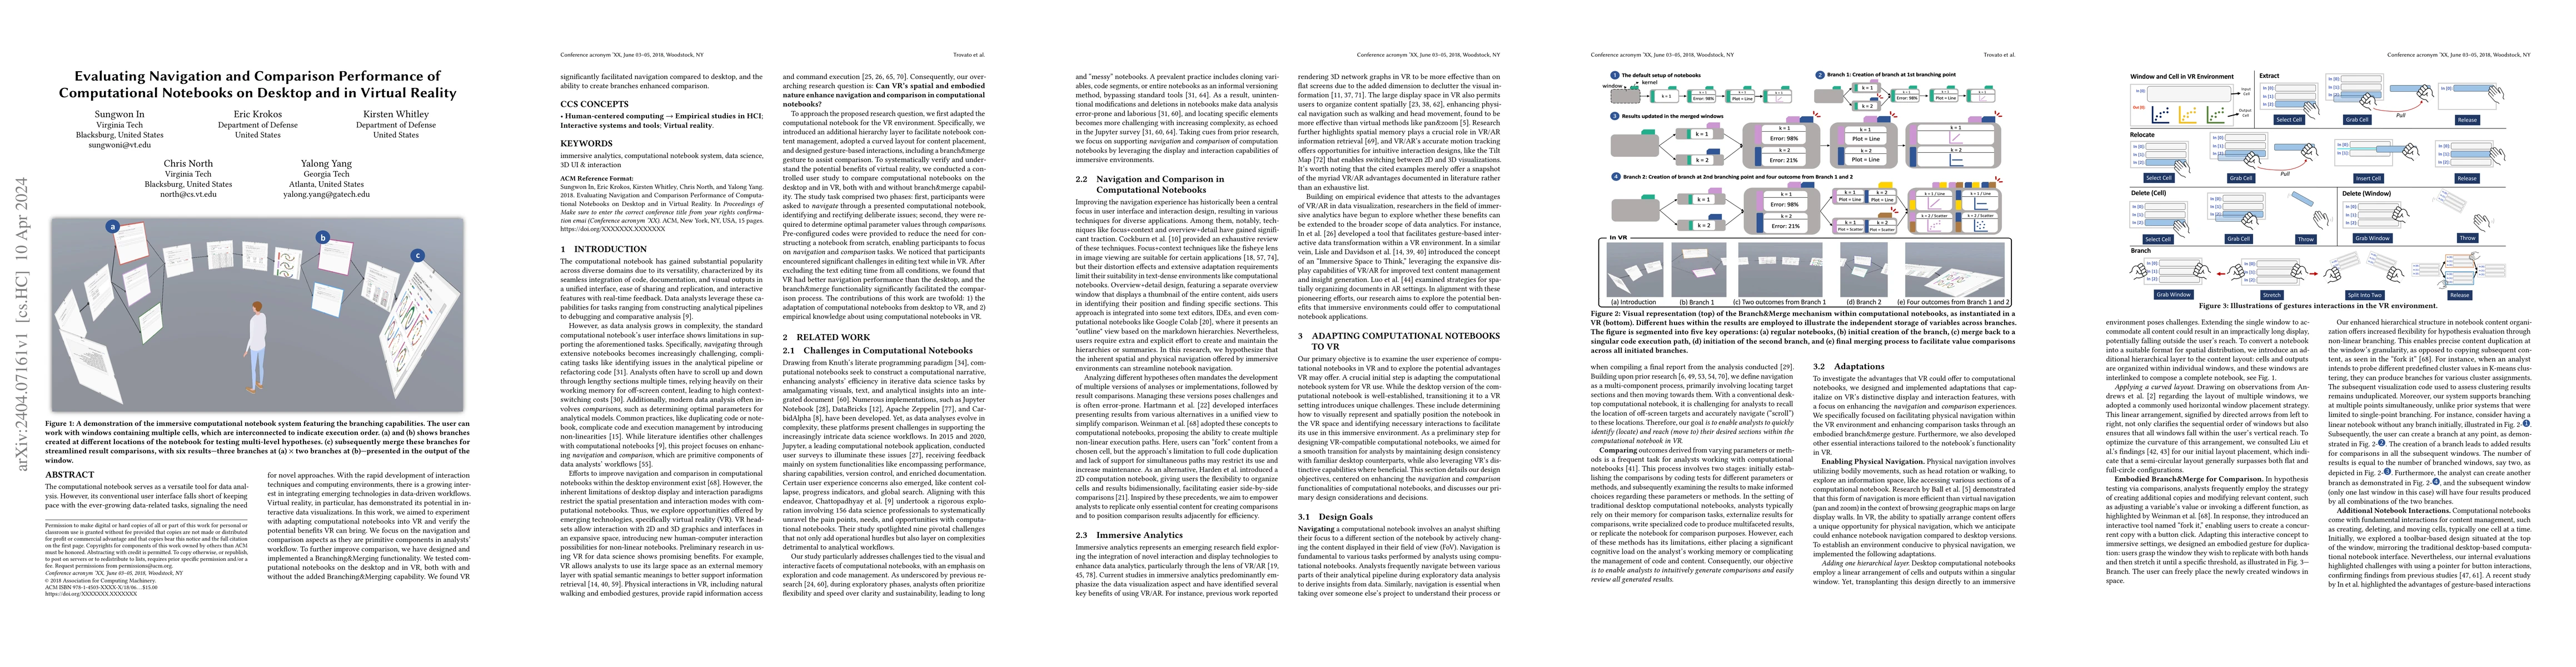
Computational notebooks, which integrate code, documentation, tags, and visualizations into a single document, have become increasingly popular for data analysis tasks. With the advent of immersive te...
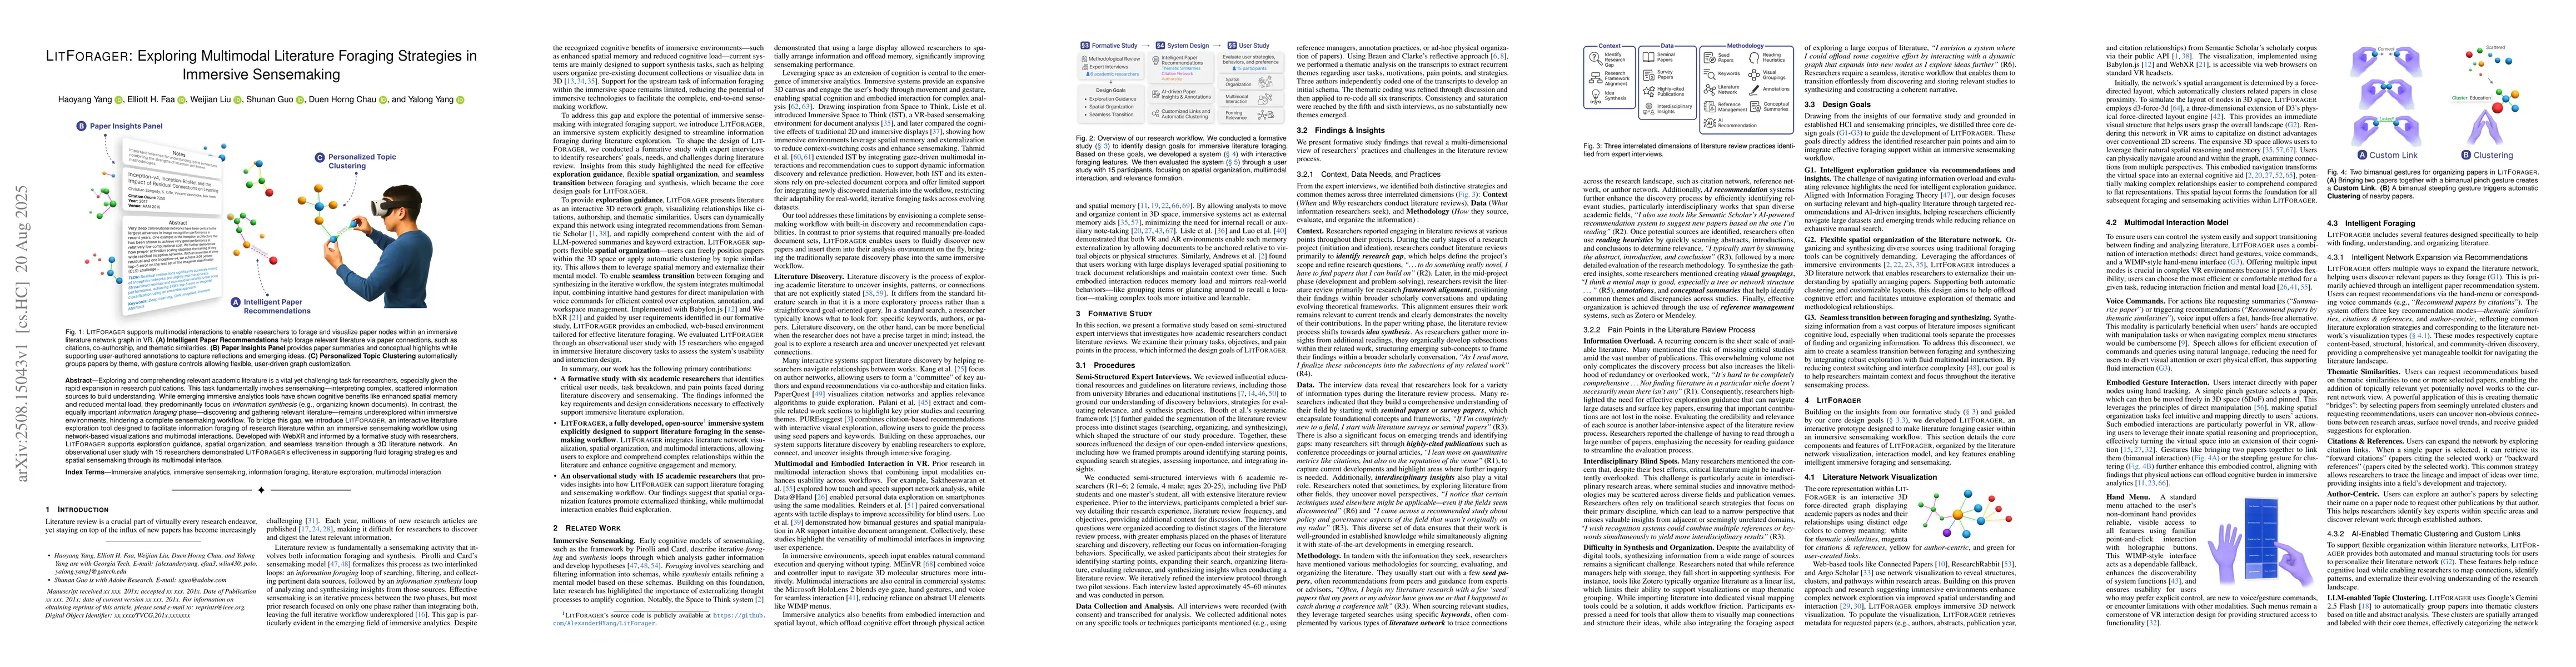
Exploring and comprehending relevant academic literature is a vital yet challenging task for researchers, especially given the rapid expansion in research publications. This task fundamentally involve...
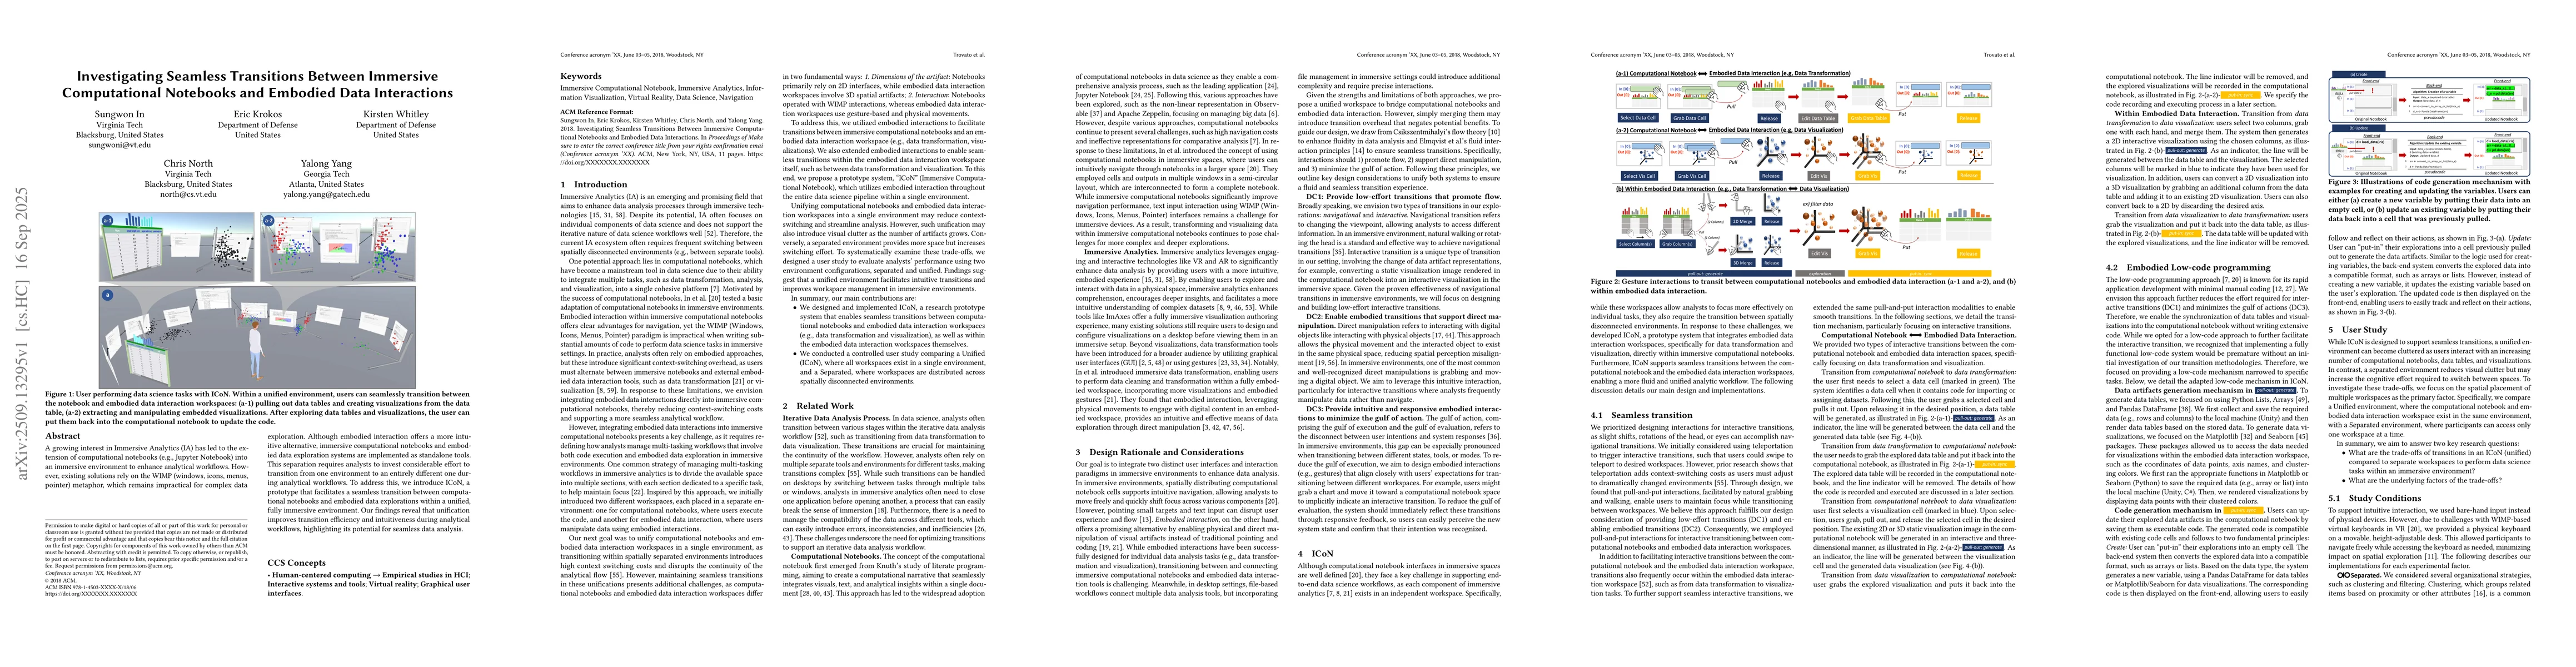
A growing interest in Immersive Analytics (IA) has led to the extension of computational notebooks (e.g., Jupyter Notebook) into an immersive environment to enhance analytical workflows. However, exis...
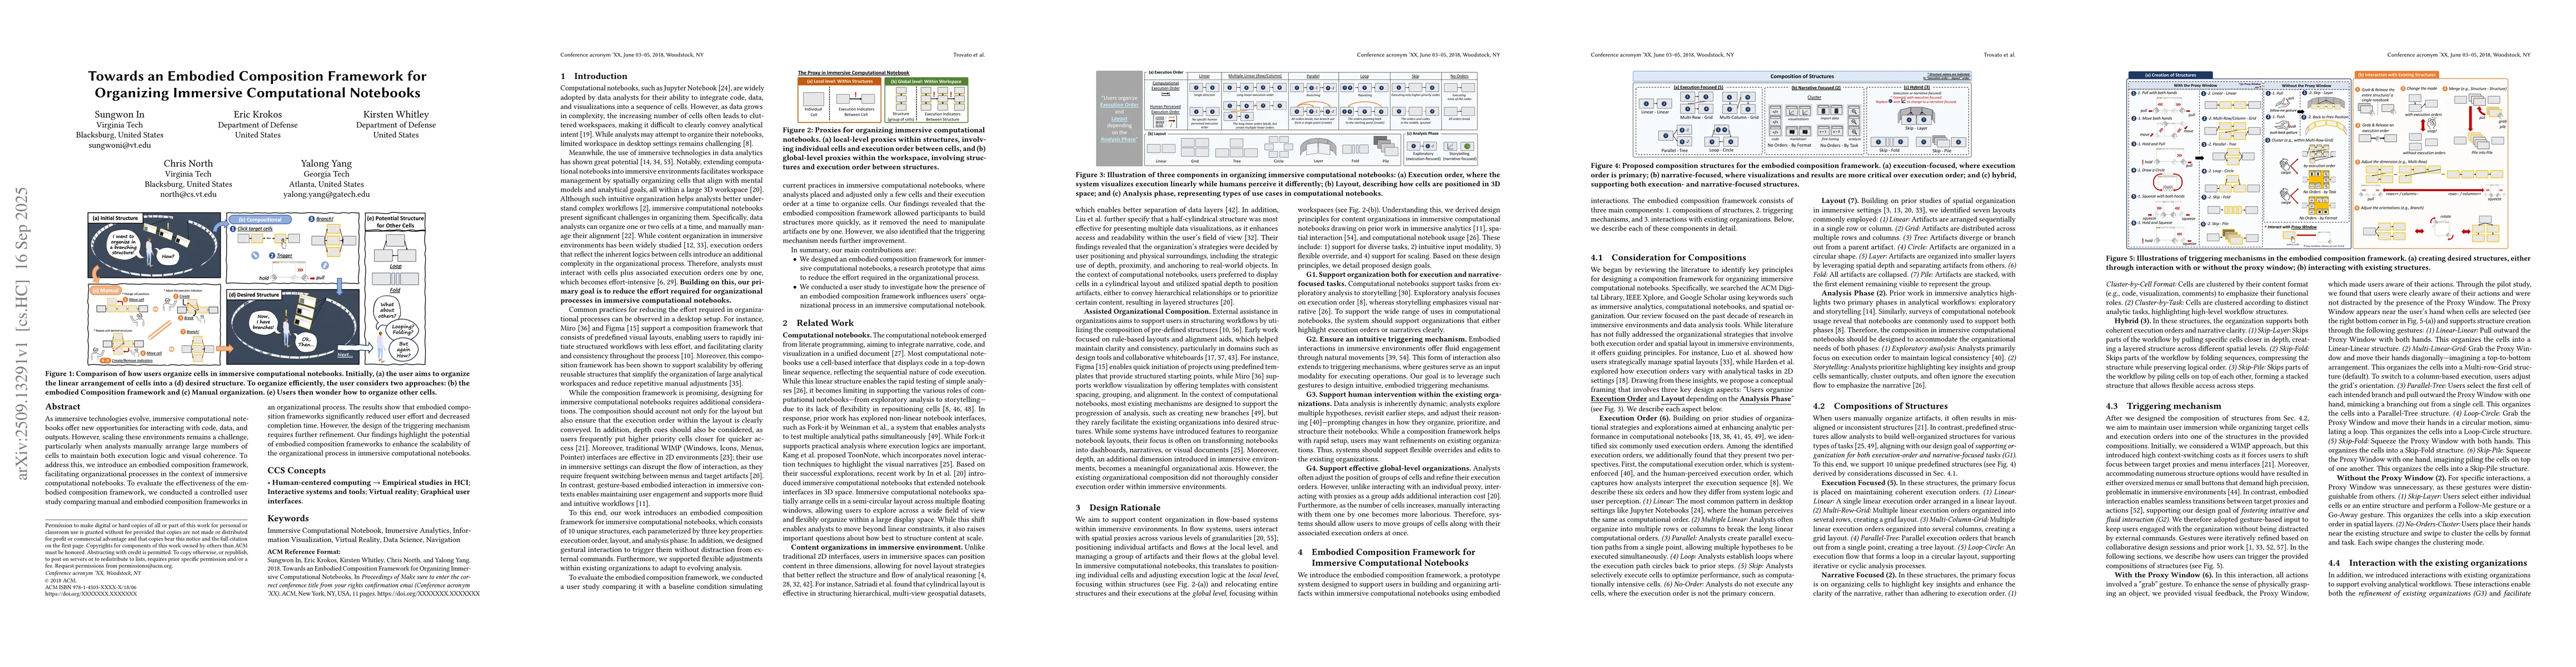
As immersive technologies evolve, immersive computational notebooks offer new opportunities for interacting with code, data, and outputs. However, scaling these environments remains a challenge, parti...
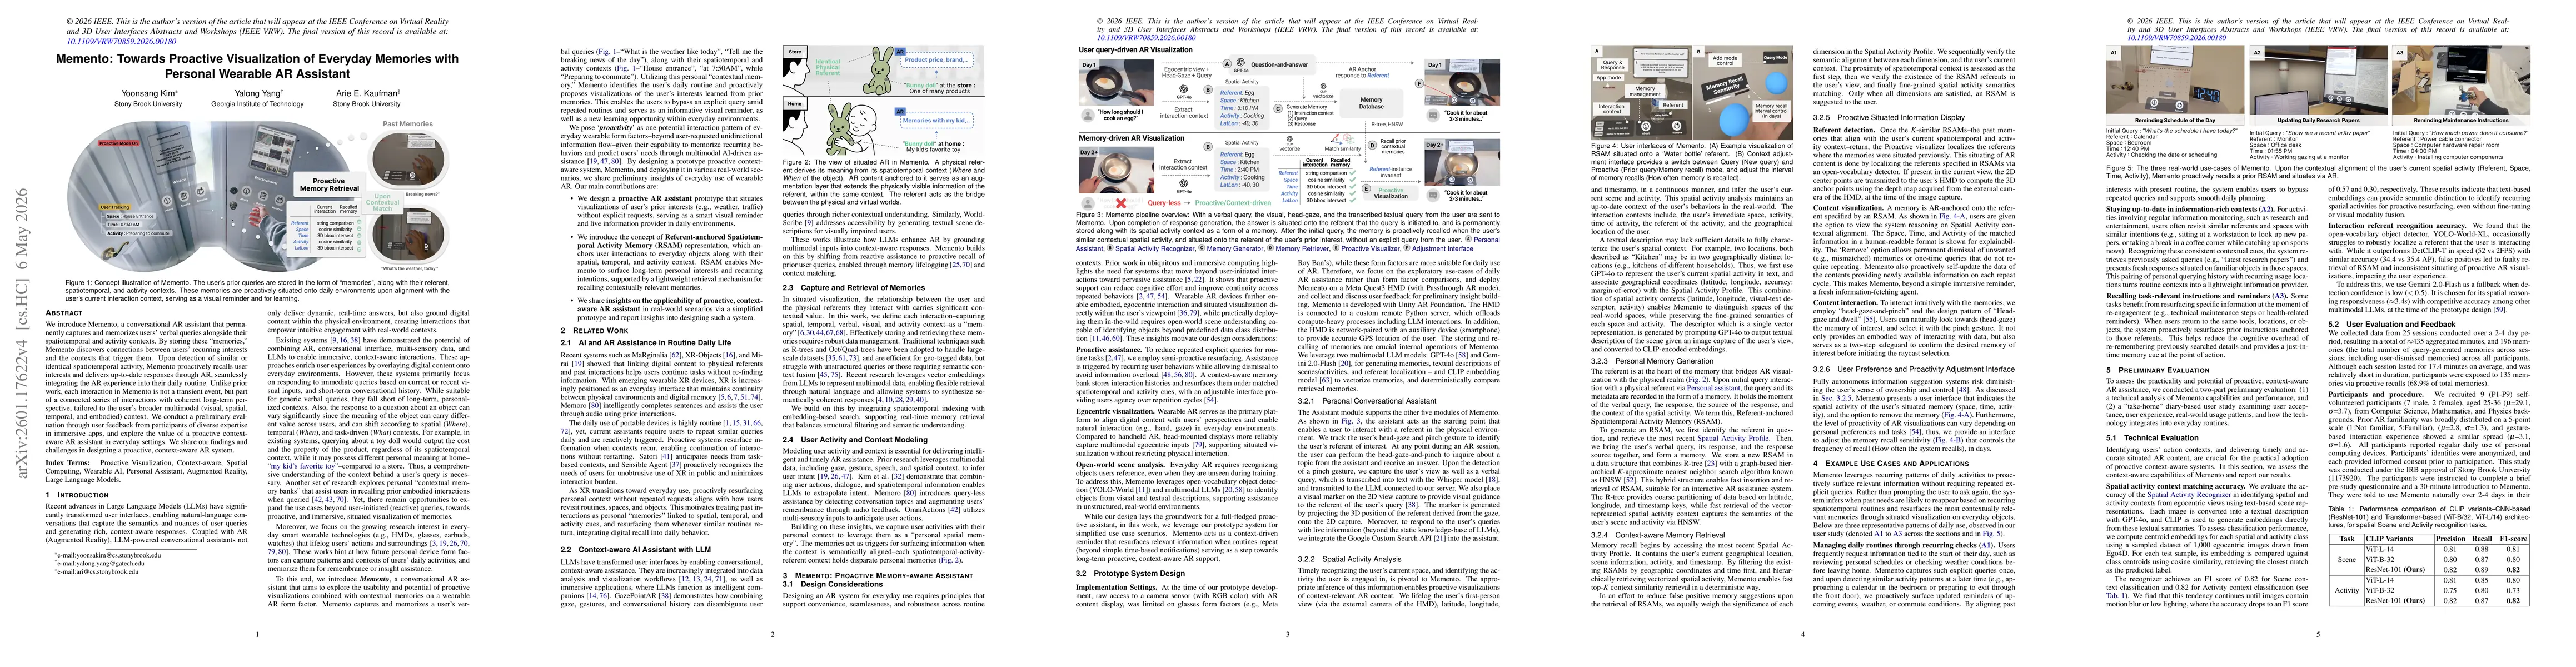
We introduce Memento, a conversational AR assistant that permanently captures and memorizes user's verbal queries alongside their spatiotemporal and activity contexts. By storing these "memories," Mem...
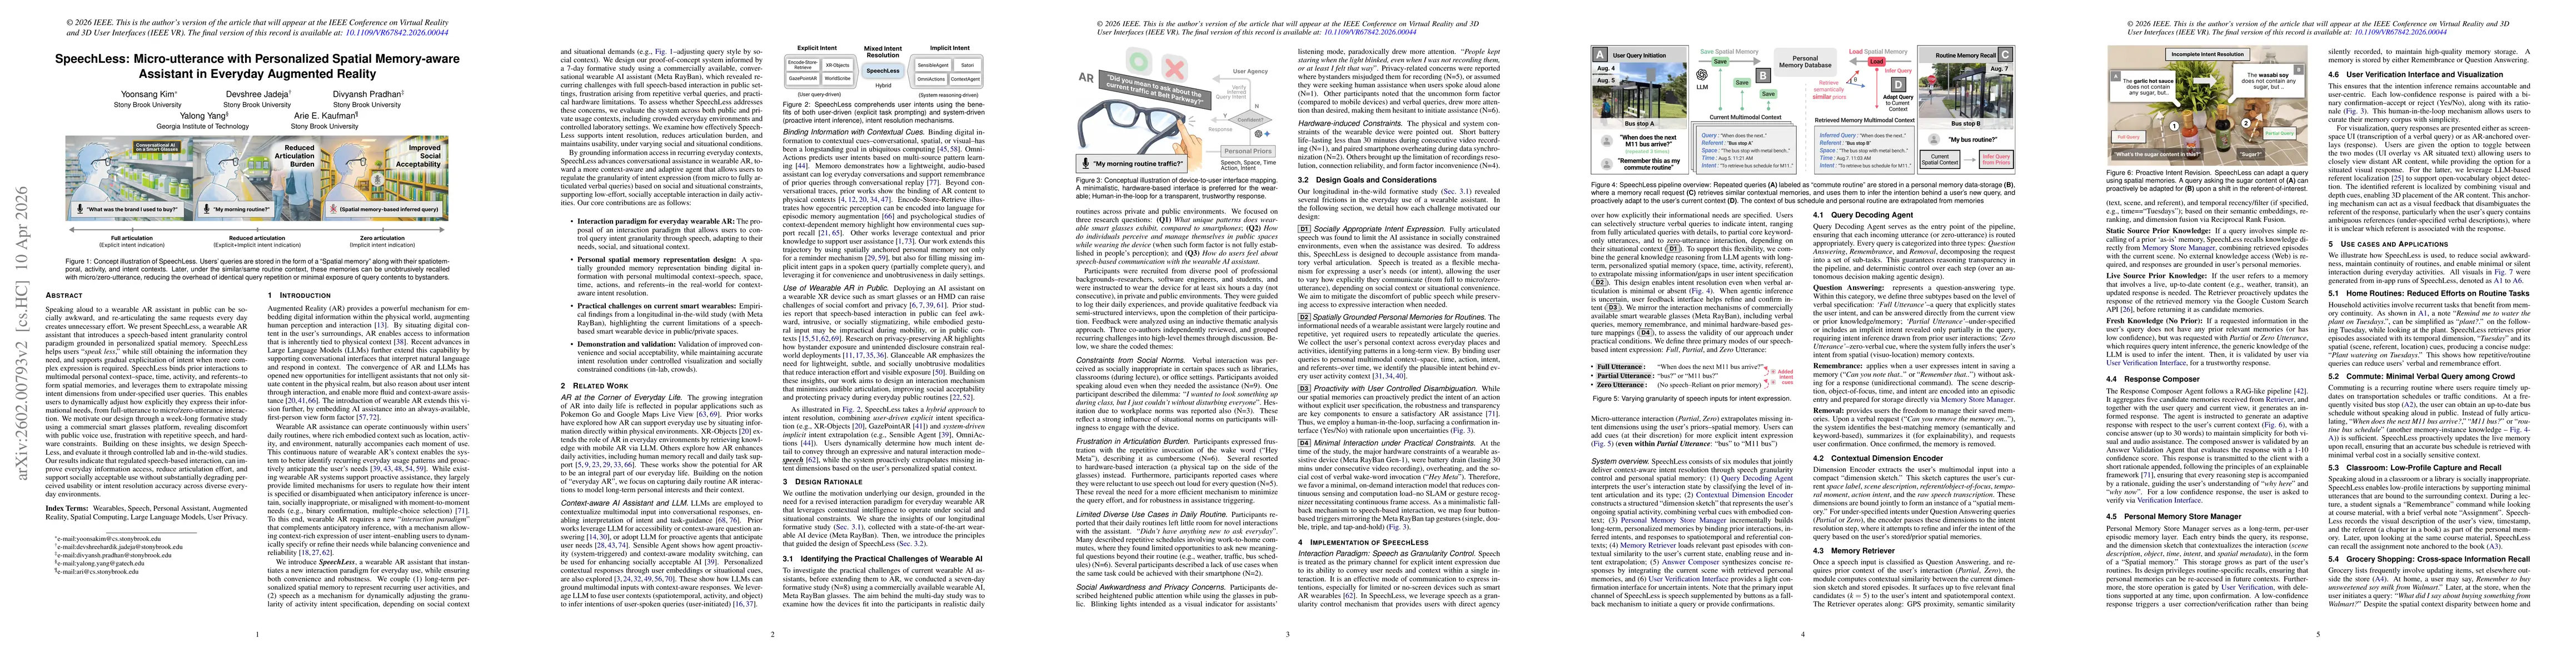
Speaking aloud to a wearable AR assistant in public can be socially awkward, and re-articulating the same requests every day creates unnecessary effort. We present SpeechLess, a wearable AR assistant ...
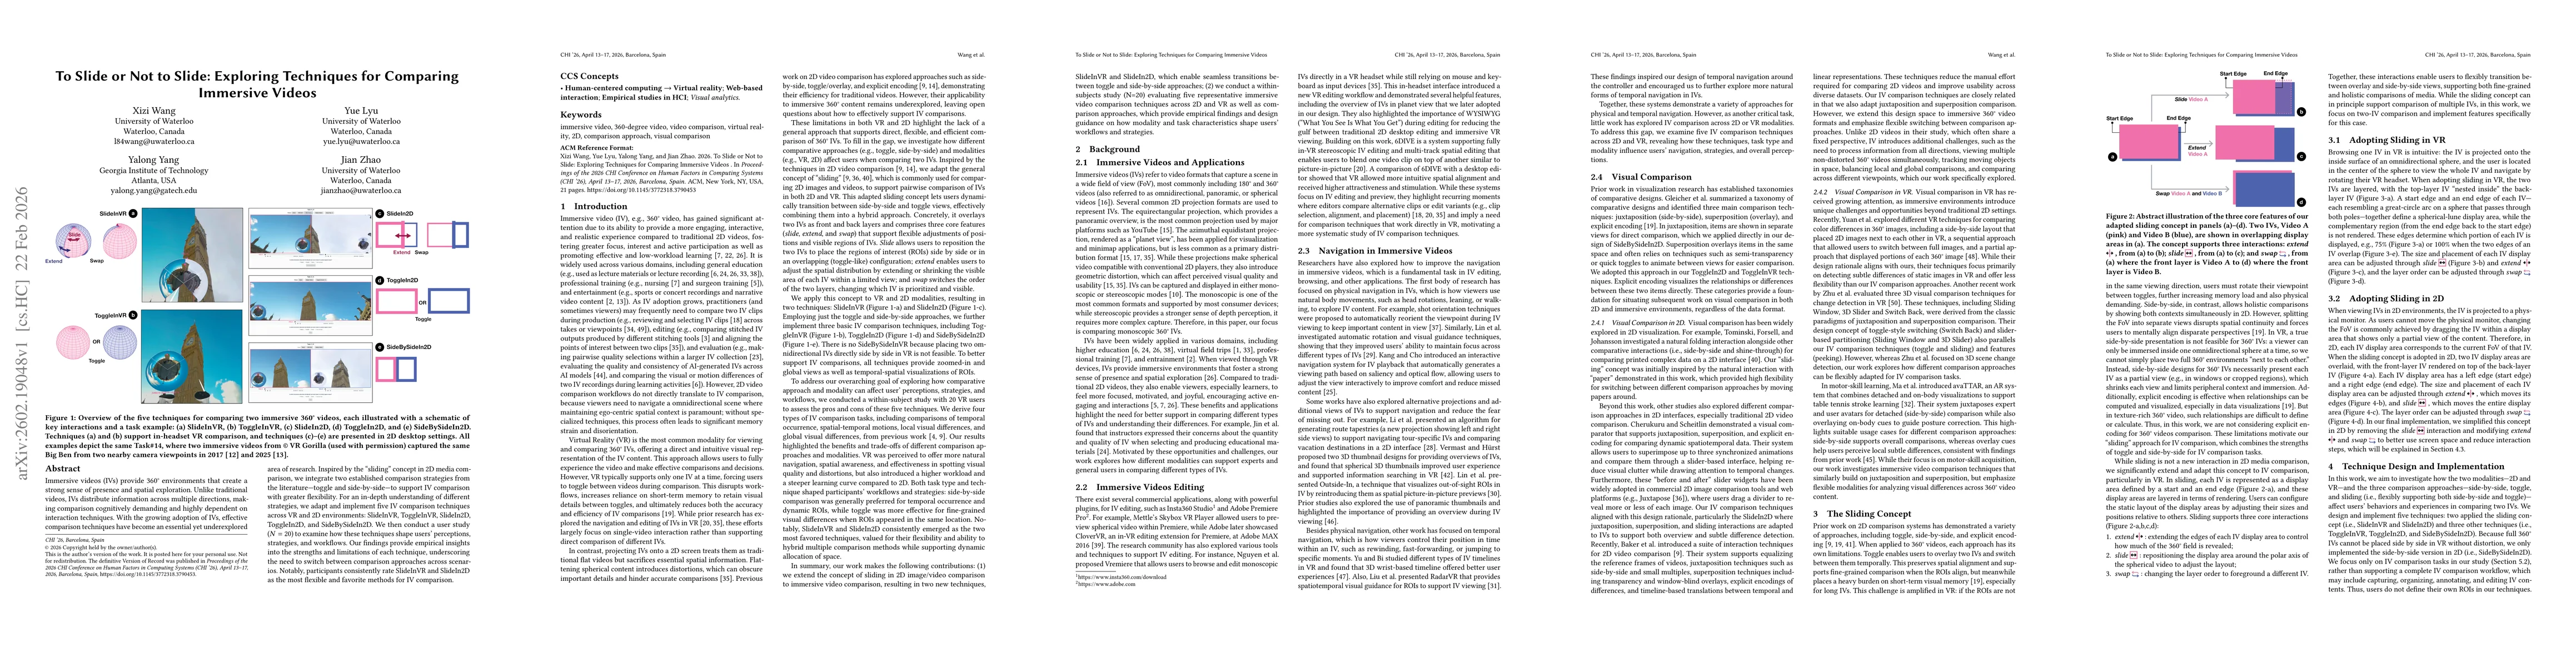
Immersive videos (IVs) provide 360° environments that create a strong sense of presence and spatial exploration. Unlike traditional videos, IVs distribute information across multiple directions, makin...
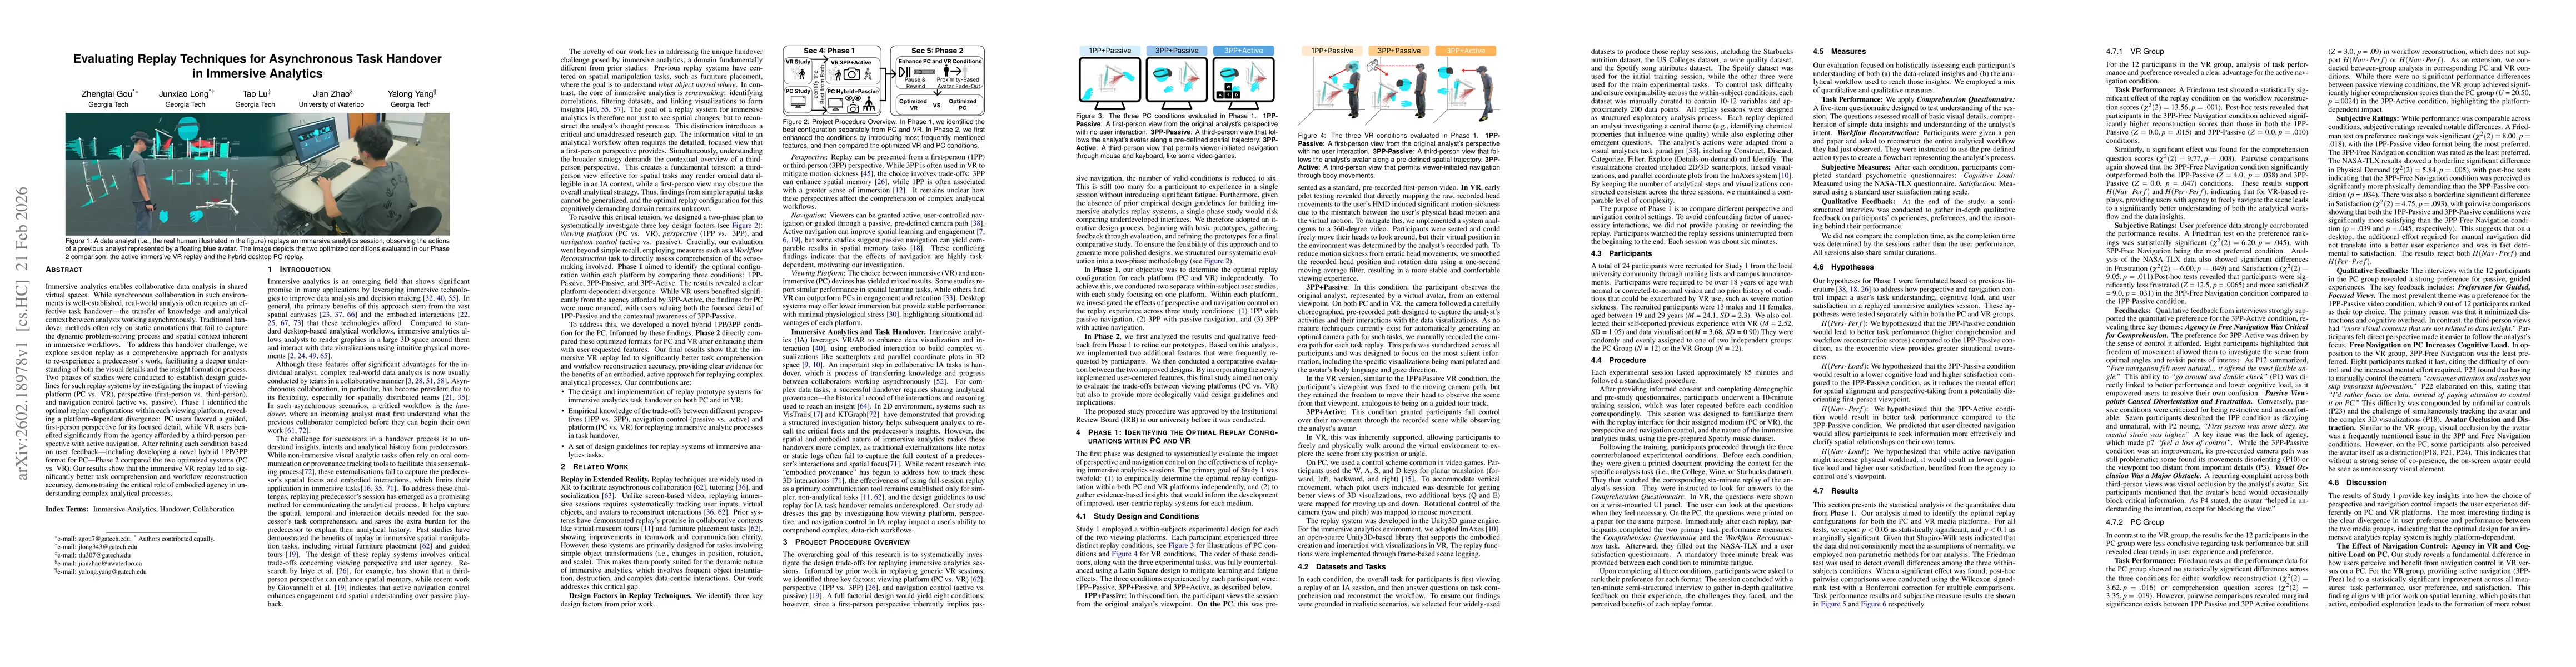
Immersive analytics enables collaborative data analysis in shared virtual spaces. While synchronous collaboration in such environments is well-established, real-world analysis often requires an effect...
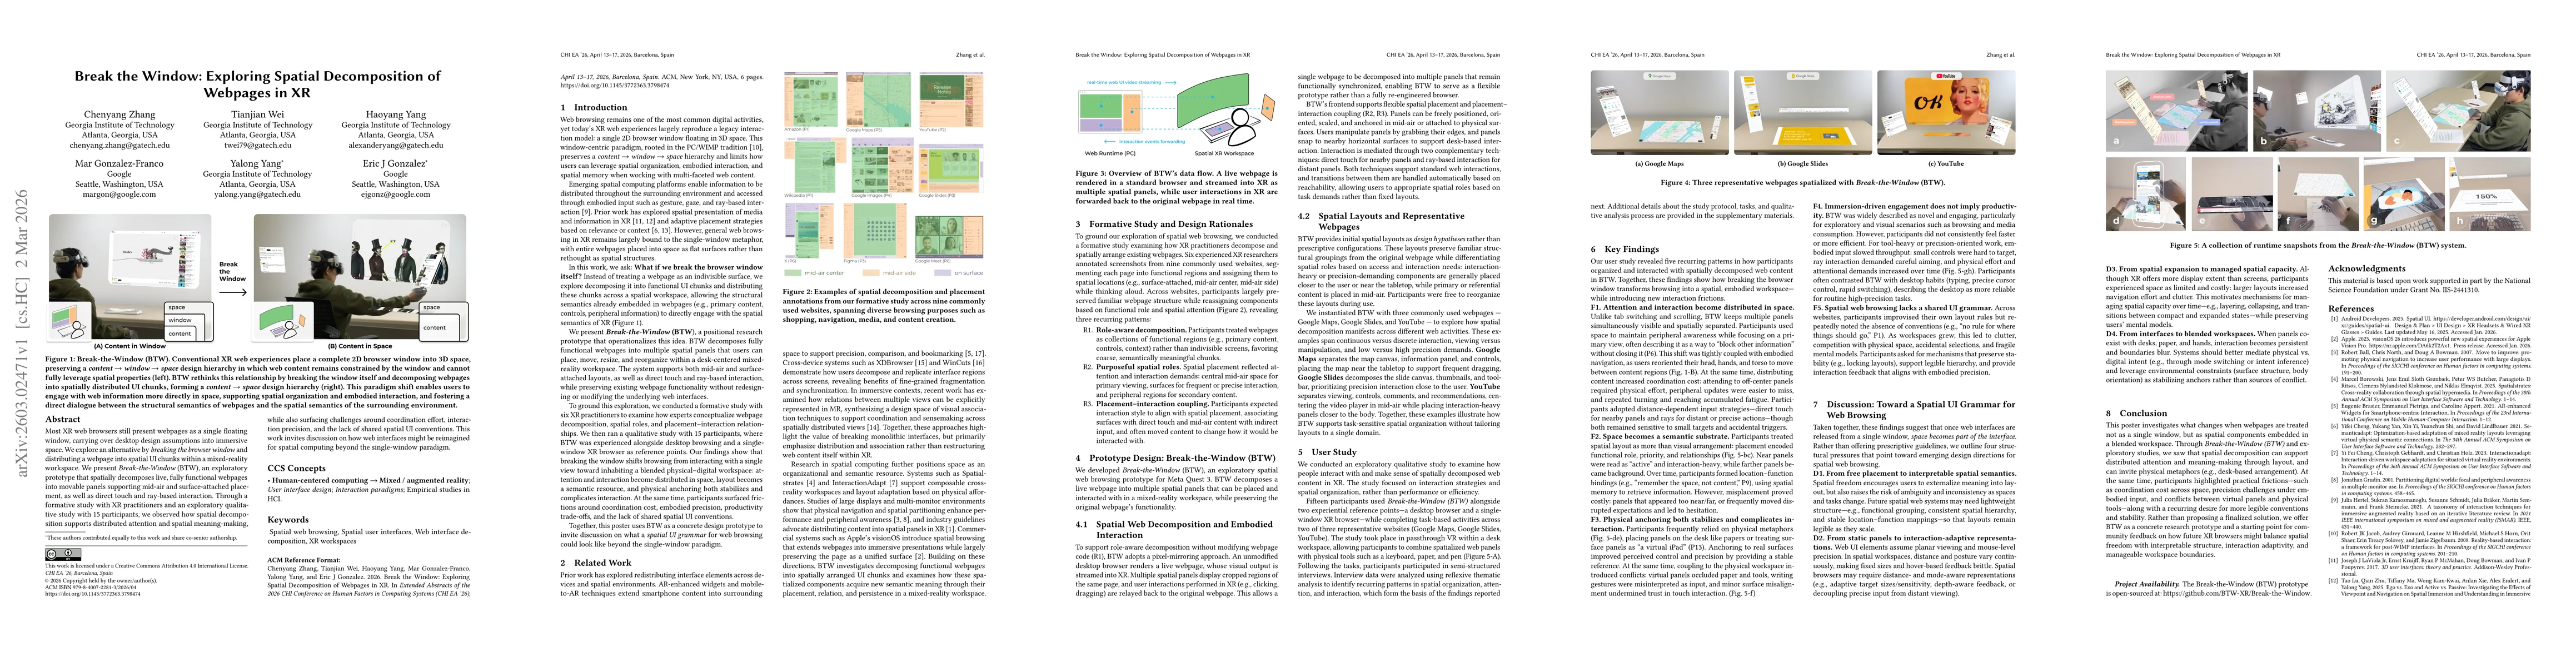
Most XR web browsers still present webpages as a single floating window, carrying over desktop design assumptions into immersive space. We explore an alternative by breaking the browser window and dis...
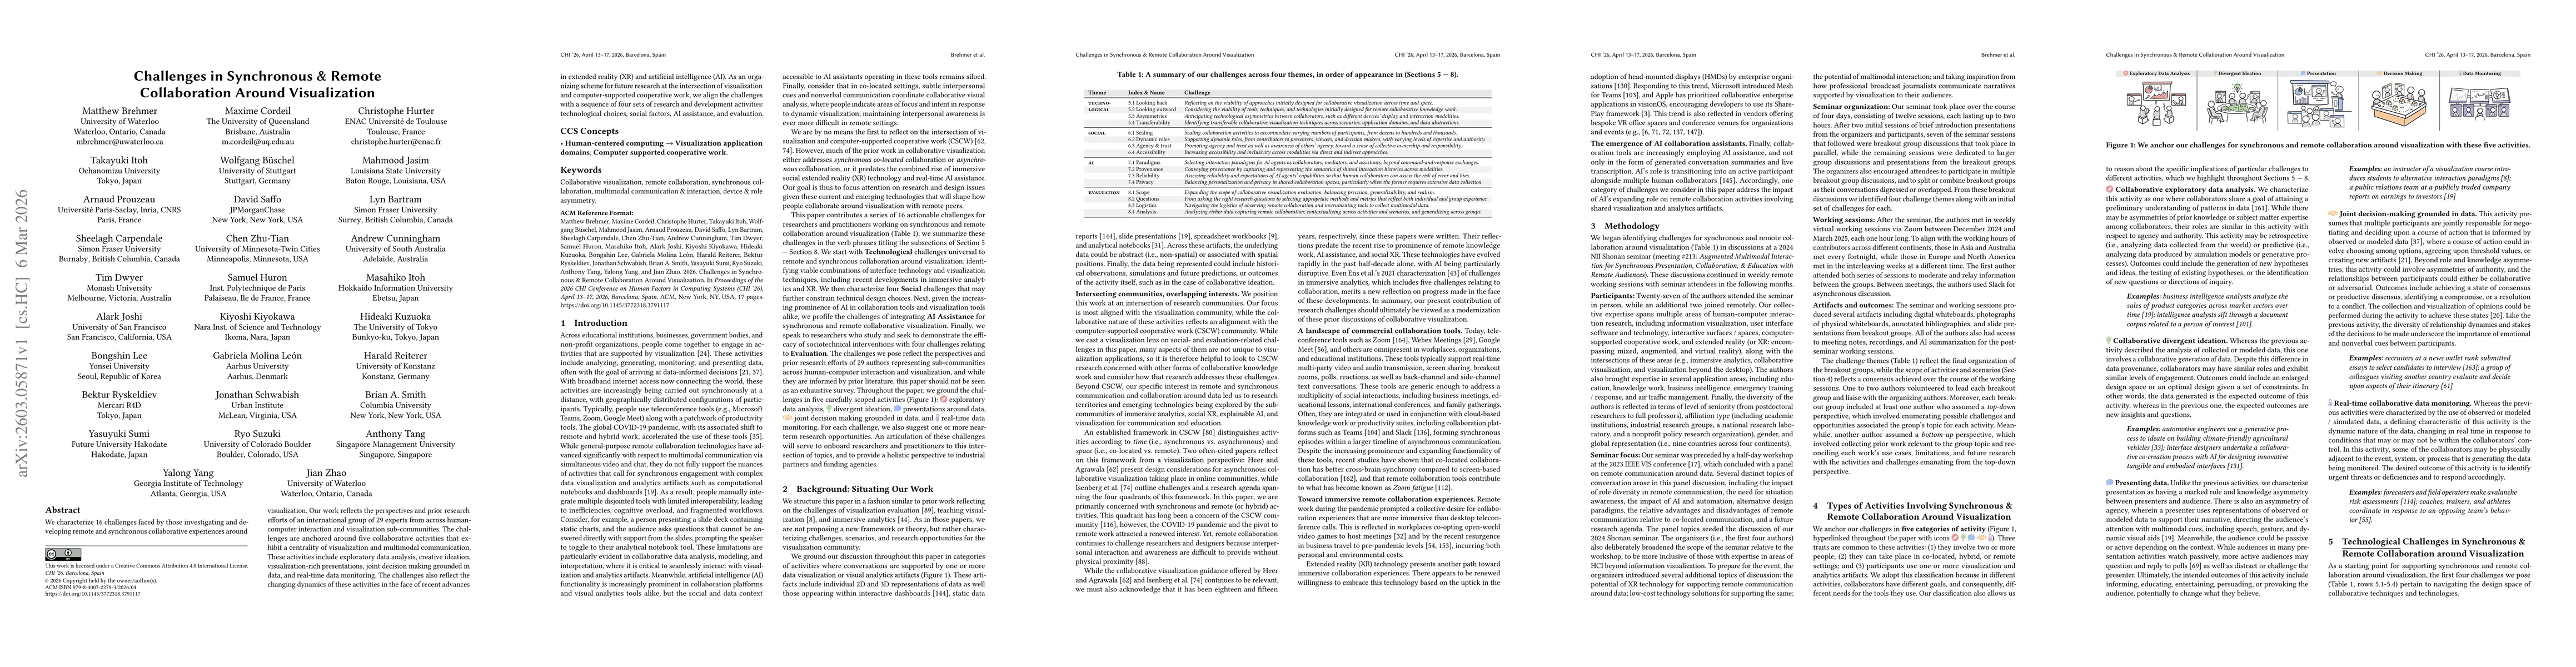
We characterize 16 challenges faced by those investigating and developing remote and synchronous collaborative experiences around visualization. Our work reflects the perspectives and prior research e...