This paper explores the development of interactive embedded visualizations to augment basketball fans' live game-viewing experiences by presenting extra data directly within the game view. The study proposes a design framework based on user-centered research and presents five novel visualization designs for specific in-game contexts, followed by a prototype evaluation showing enhanced game understanding and engagement.
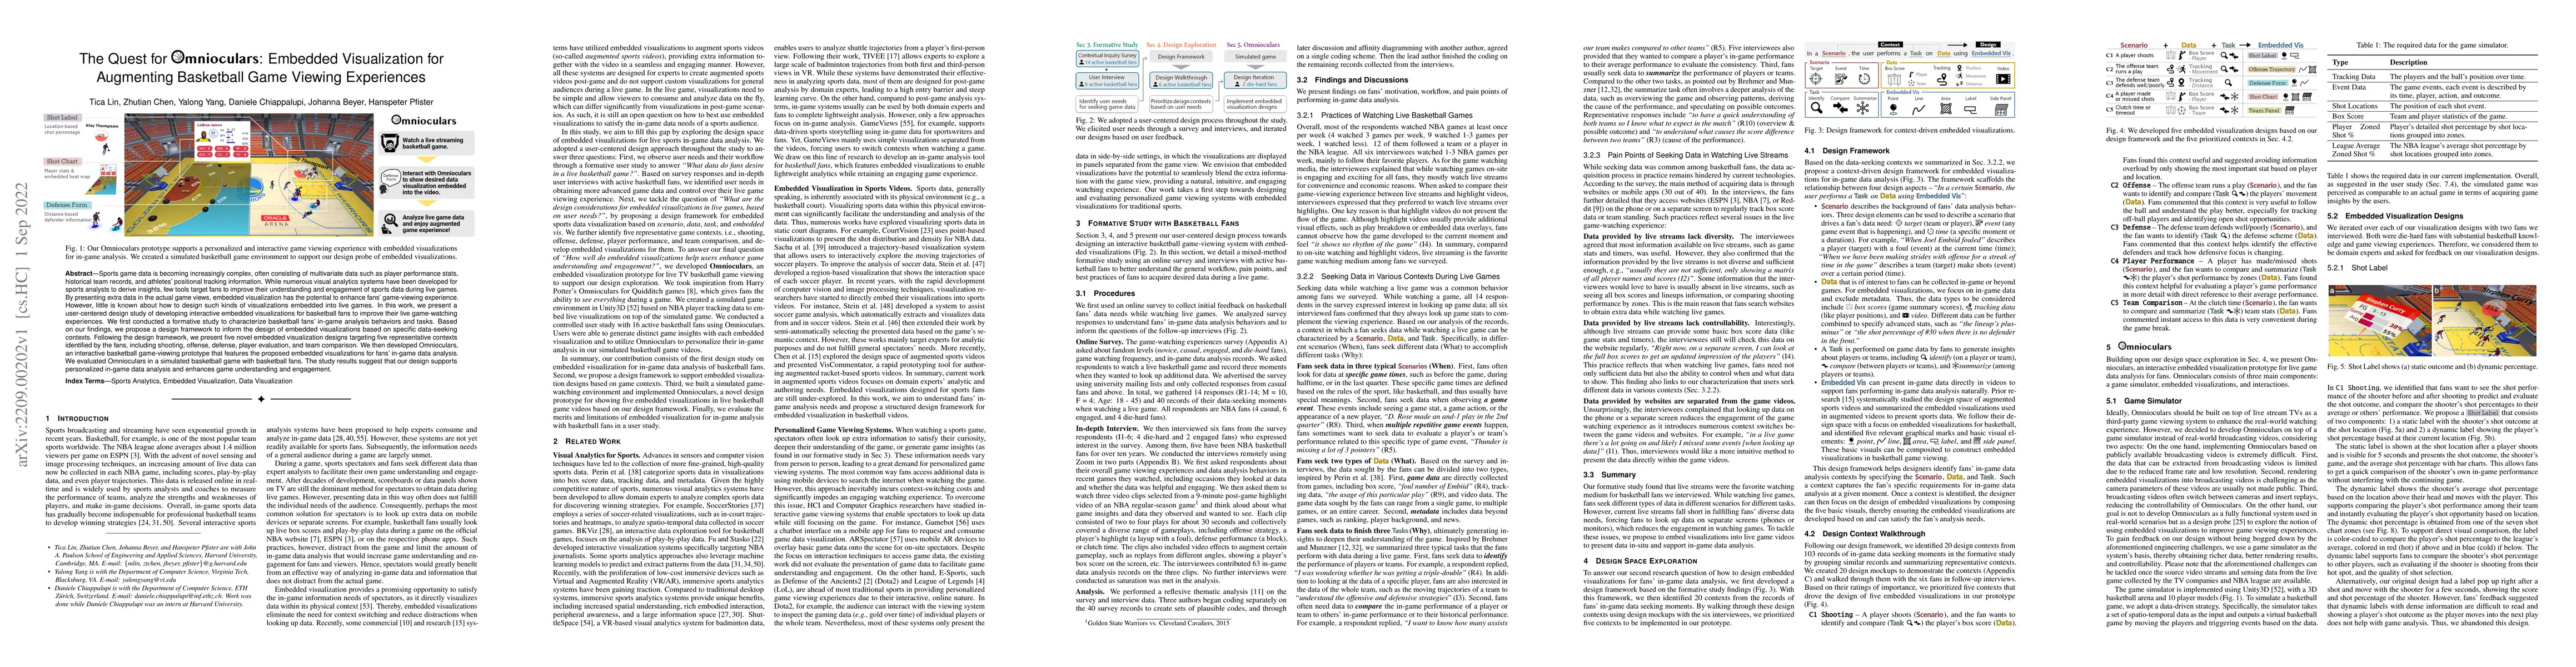
Sports game data is becoming increasingly complex, often consisting of multivariate data such as player performance stats, historical team records, and athletes' positional tracking information. While numerous visual analytics systems have been developed for sports analysts to derive insights, few tools target fans to improve their understanding and engagement of sports data during live games. By presenting extra data in the actual game views, embedded visualization has the potential to enhance fans' game-viewing experience. However, little is known about how to design such kinds of visualizations embedded into live games. In this work, we present a user-centered design study of developing interactive embedded visualizations for basketball fans to improve their live game-watching experiences. We first conducted a formative study to characterize basketball fans' in-game analysis behaviors and tasks. Based on our findings, we propose a design framework to inform the design of embedded visualizations based on specific data-seeking contexts. Following the design framework, we present five novel embedded visualization designs targeting five representative contexts identified by the fans, including shooting, offense, defense, player evaluation, and team comparison. We then developed Omnioculars, an interactive basketball game-viewing prototype that features the proposed embedded visualizations for fans' in-game data analysis. We evaluated Omnioculars in a simulated basketball game with basketball fans. The study results suggest that our design supports personalized in-game data analysis and enhances game understanding and engagement.
Get AI-generated insights about this paper's methodology, results, and significance.
Current paper (gray), citations (green), references (blue)
Hanspeter Pfister, Chen Zhu-Tian, Haijun Xia et al.
Title | Authors | Year | Actions |
---|---|---|---|
Player‐Centric Shot Maps in Table Tennis
|
A. Erades, R. Vuillemot
|
2025
|
View Paper |
Visualizing NBA information via storylines
|
Jie Lin, Chuan-Kai Yang, Chiun-How Kao
|
2025
|
View Paper |
The development of 'Petanque match statistics': an android-based application for petanque matches analysis
|
Nur Salsabila Rhesa Pandhadha Putra, Muchamad Arif Al Ardha, Nurhasan Nurhasan, Kolektus Oky Ristanto, Sauqi Sawa Bikalawan, Rizki Satrio Utomo, Kukuh Pambuka Putra, James Lin, Resfiana Irani
|
2024
|
View Paper |
Designing for Automated Sports Commentary Systems
|
Peter Andrews, Oda Elise Nordberg, Njål Borch, Frode Guribye, Morten Fjeld
|
2024
|
View Paper |
TacPrint: Visualizing the Biomechanical Fingerprint in Table Tennis
|
Jiachen Wang, Ji Ma, Zheng Zhou, Xiao Xie, Hui Zhang, Yingcai Wu, Huamin Qu
|
2024
|
View Paper |
Make Interaction Situated: Designing User Acceptable Interaction for Situated Visualization in Public Environments
|
Qian Zhu, Zhuo Wang, Wei Zeng, Wai Tong, Weiyue Lin, Xiaojuan Ma
|
2024
|
View Paper |
Context-Dependent Memory in Situated Visualization
|
Kadek Ananta Satriadi, Benjamin Tag, Tim Dwyer
|
2023
|
View Paper |
Visualization Placement for Outdoor Augmented Data Tours
|
Zeinab Ghaemi, Kadek Ananta Satriadi, Ulrich Engelke, Barrett Ens, Bernhard Jenny
|
2023
|
View Paper |
Drawing Connections: Designing Situated Links for Immersive Maps
|
Zeinab Ghaemi, Barrett Ens, Ulrich Engelke, Bernhard Jenny
|
2023
|
View Paper |
Quantifying the Impact of XR Visual Guidance on User Performance Using a Large-Scale Virtual Assembly Experiment
|
Leon Pietschmann, P. Zuercher, Erik Bub'ik, Zhutian Chen, Hanspeter Pfister, Thomas Bohné
|
2023
|
View Paper |
Visualizing Tennis Matches as Nested Stories
|
Ying Zhu, Akhil Javvaji
|
2023
|
View Paper |
More Than Data Stories: Broadening the Role of Visualization in Contemporary Journalism
|
Yu Fu, J. Stasko
|
2023
|
View Paper |
Visual Exploration and Planning of the Automated Material Handling System for Smart Factory in the Immersive Environment
|
Yifei Zhang, Yougao Li, Xiangyang Xue, Jianfeng Feng, Siming Chen
|
2023
|
View Paper |
Deimos: A Grammar of Dynamic Embodied Immersive Visualisation Morphs and Transitions
|
Benjamin Lee, Arvind Satyanarayan, Maxime Cordeil, Arnaud Prouzeau, B. Jenny, Tim Dwyer
|
2023
|
View Paper |
The Ball is in Our Court: Conducting Visualization Research With Sports Experts
|
Tica Lin, Zhutian Chen, Johanna Beyer, Yingcai Wu, Hanspeter Pfister, Yalong Yang, Melanie Tory, Daniel F. Keefe
|
2022
|
View Paper |
Situated Visualization in Motion
|
L. Yao, A. Bezerianos, Petra Isenberg
|
2020
|
View Paper |
GenVis: Visualizing Genre Detection in Movie Trailers for Enhanced Understanding
|
Faheem Shaukat, N. Ejaz, Zeeshan Ashraf, Mrim M. Alnfiai, Mona Mohammed Alnahari, Reemiah Muneer Alotaibi
|
2024
|
View Paper |
Visual Analysis of Table Tennis Game Tactics
|
View Paper | ||
Visual Analysis of Table Tennis Game Tactics
|
View Paper | ||
Visual Analysis of Table Tennis Game Tactics
|
View Paper | ||
Visual Analysis of Table Tennis Game Tactics
|
View Paper | ||
Visual Analysis of Table Tennis Game Tactics
|
View Paper | ||
Visual Analysis of Table Tennis Game Tactics
|
View Paper | ||
Visual Analysis of Table Tennis Game Tactics
|
View Paper | ||
Visual Analysis of Table Tennis Game Tactics
|
View Paper | ||
Visual Analysis of Table Tennis Game Tactics
|
View Paper | ||
Visual Analysis of Table Tennis Game Tactics
|
View Paper |
Comments (0)