Learning Style Similarity for Searching Infographics
Publication
Metrics
AI Quick Summary
A method is presented to measure style similarity between infographics using computer vision and machine learning algorithms, achieving effective results with color histograms and Histograms-of-Gradients features.
Paper Preview
Abstract
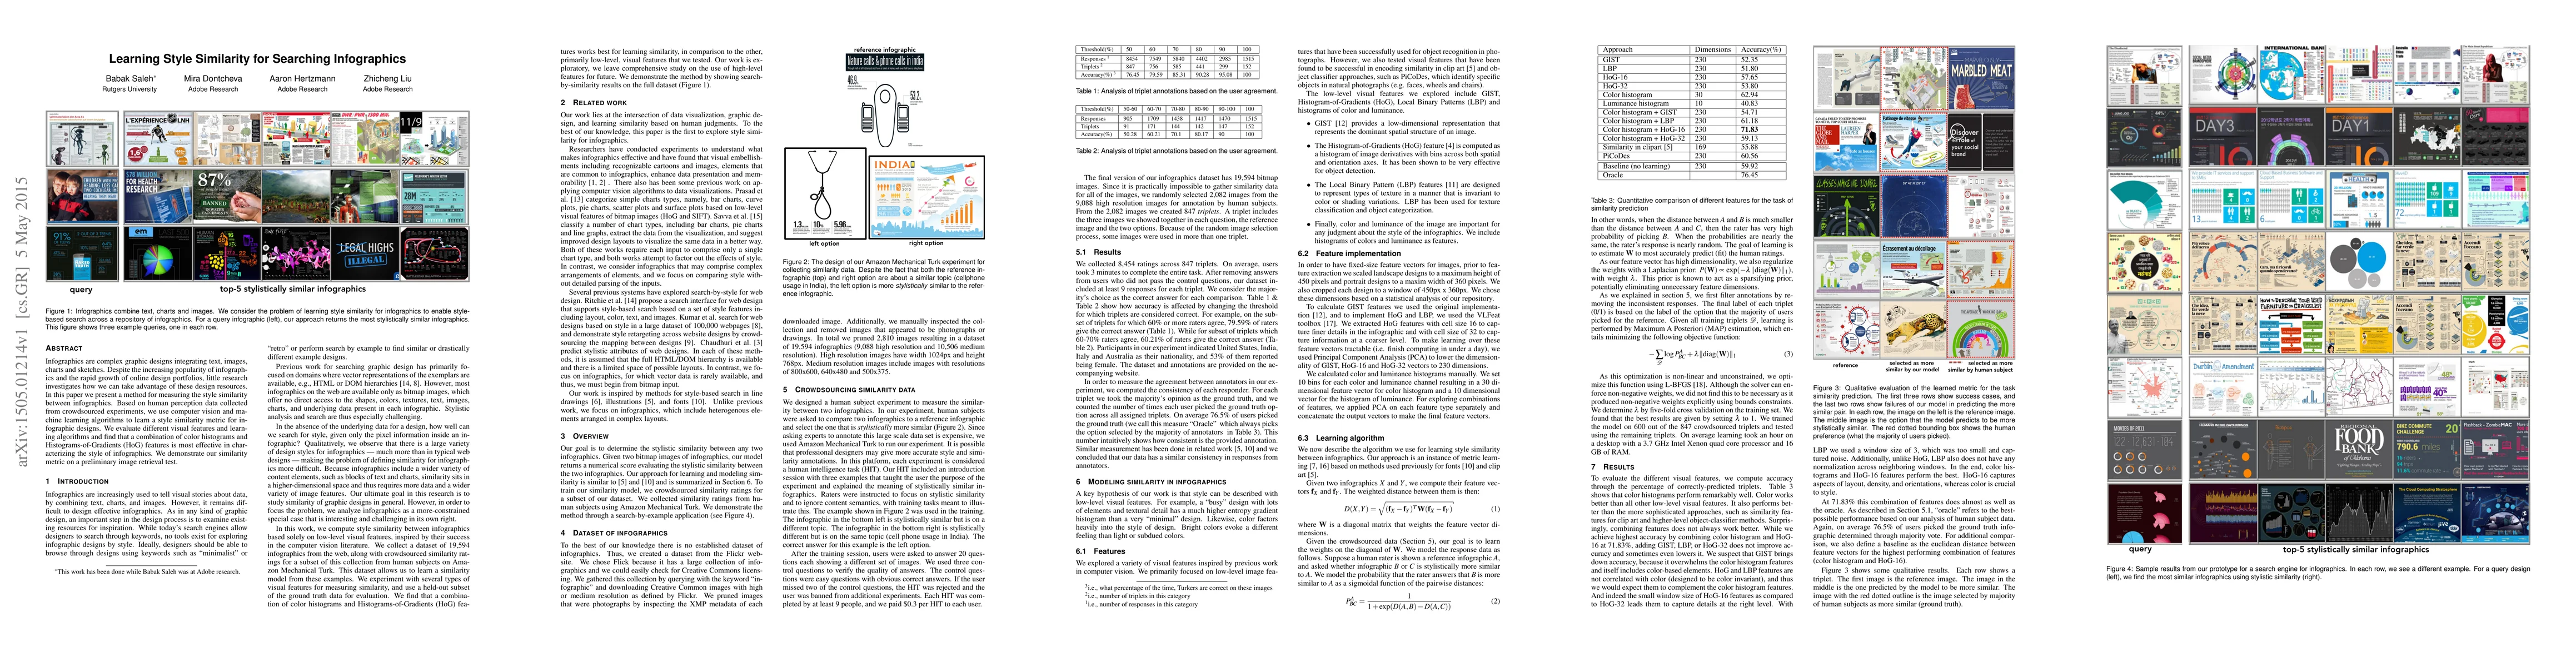
Infographics are complex graphic designs integrating text, images, charts and sketches. Despite the increasing popularity of infographics and the rapid growth of online design portfolios, little research investigates how we can take advantage of these design resources. In this paper we present a method for measuring the style similarity between infographics. Based on human perception data collected from crowdsourced experiments, we use computer vision and machine learning algorithms to learn a style similarity metric for infographic designs. We evaluate different visual features and learning algorithms and find that a combination of color histograms and Histograms-of-Gradients (HoG) features is most effective in characterizing the style of infographics. We demonstrate our similarity metric on a preliminary image retrieval test.
AI Key Findings
Get AI-generated insights about this paper's methodology, results, significance, and more — seven facets brought into focus.
Impact
Paper Details
PDF Preview
Key Terms
Citation Network
Current paper (gray), citations (green), references (blue)
Display is limited for performance on very large graphs.
Discussion 0