Authors
Summary
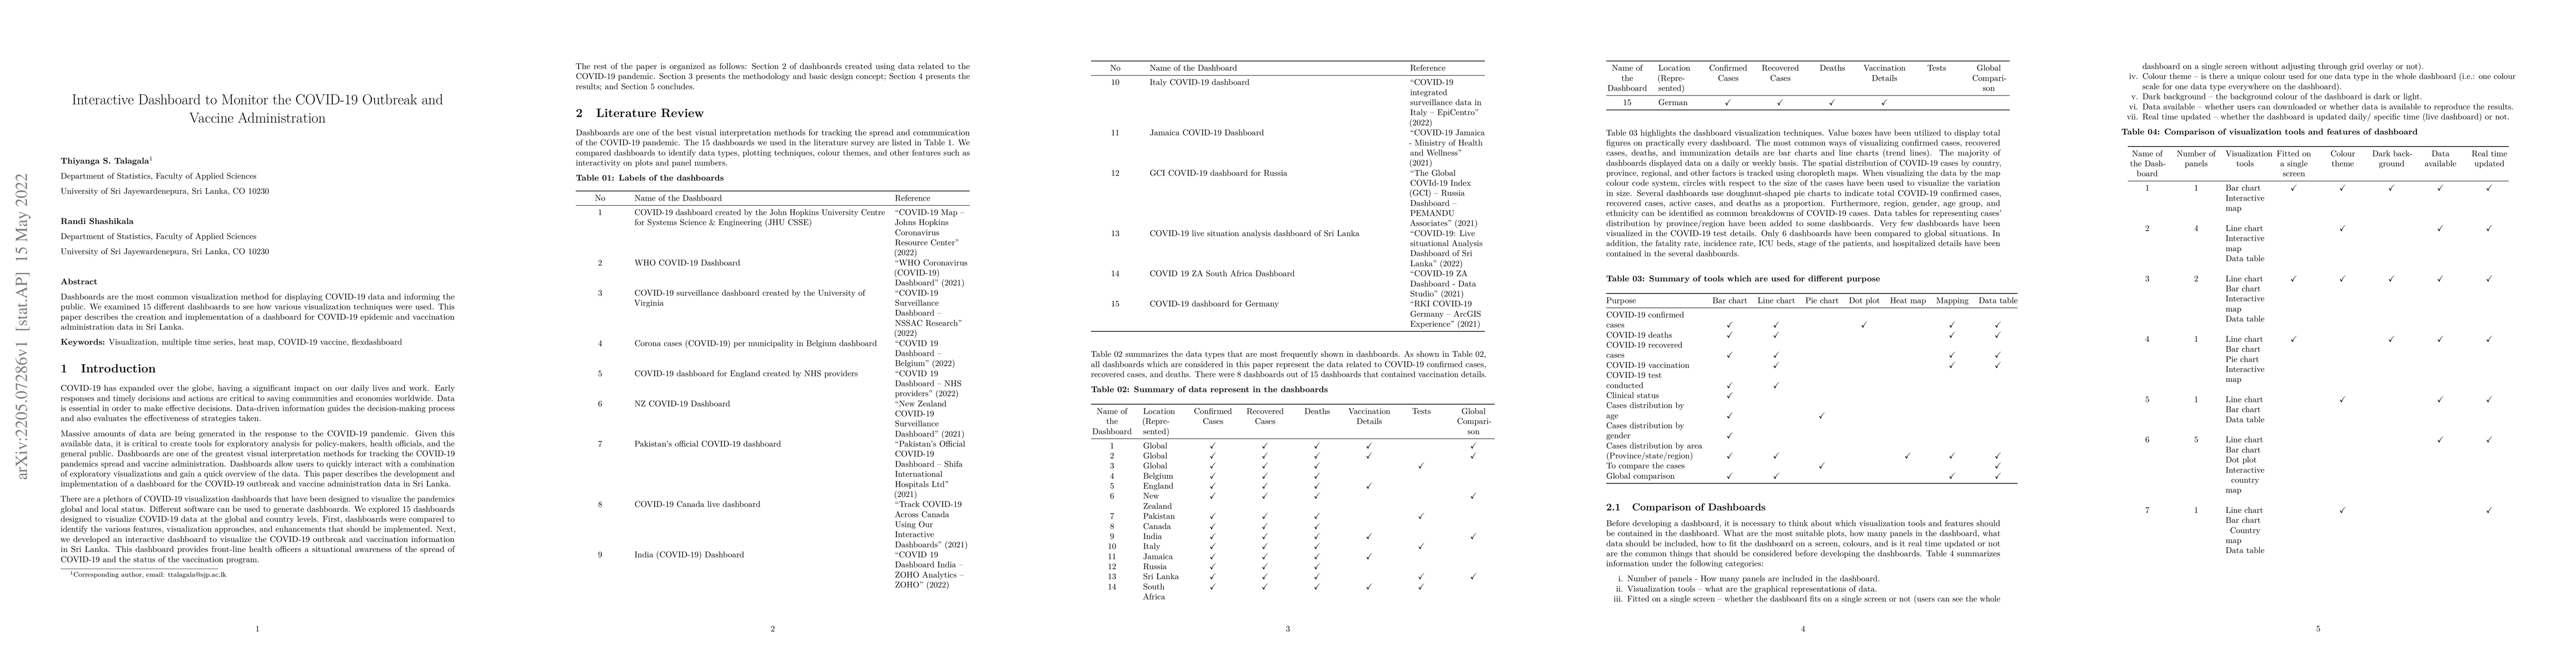
Dashboards are the most common visualization method for displaying COVID-19 data and informing the public. We examined 15 different dashboards to see how various visualization techniques were used. This paper describes the creation and implementation of a dashboard for COVID-19 epidemic and vaccination administration data in Sri Lanka.
AI Key Findings
Get AI-generated insights about this paper's methodology, results, and significance.
Paper Details
PDF Preview
Key Terms
covid
(0.526)
covid
(0.509)
visualization
(0.471)
epidemic
(0.344)
creation
(0.296)
examined
(0.287)
paper describes
(0.278)
describes
(0.263)
Citation Network
Current paper (gray), citations (green), references (blue)
Display is limited for performance on very large graphs.
Current Paper
Citations
References
Click to view
Similar Papers
Found 4 papers| Title | Authors | Year | Actions |
|---|
Comments (0)