Interactive slice visualization for exploring machine learning models
Publication
Metrics
AI Quick Summary
This paper proposes interactive slice visualization techniques to enhance interpretability of complex machine learning models, implemented in the R package \pkg{condvis2}. The approach allows users to explore model fits by interrogating, explaining, validating, and comparing them through direct interaction or automated touring algorithms.
Paper Preview
Abstract
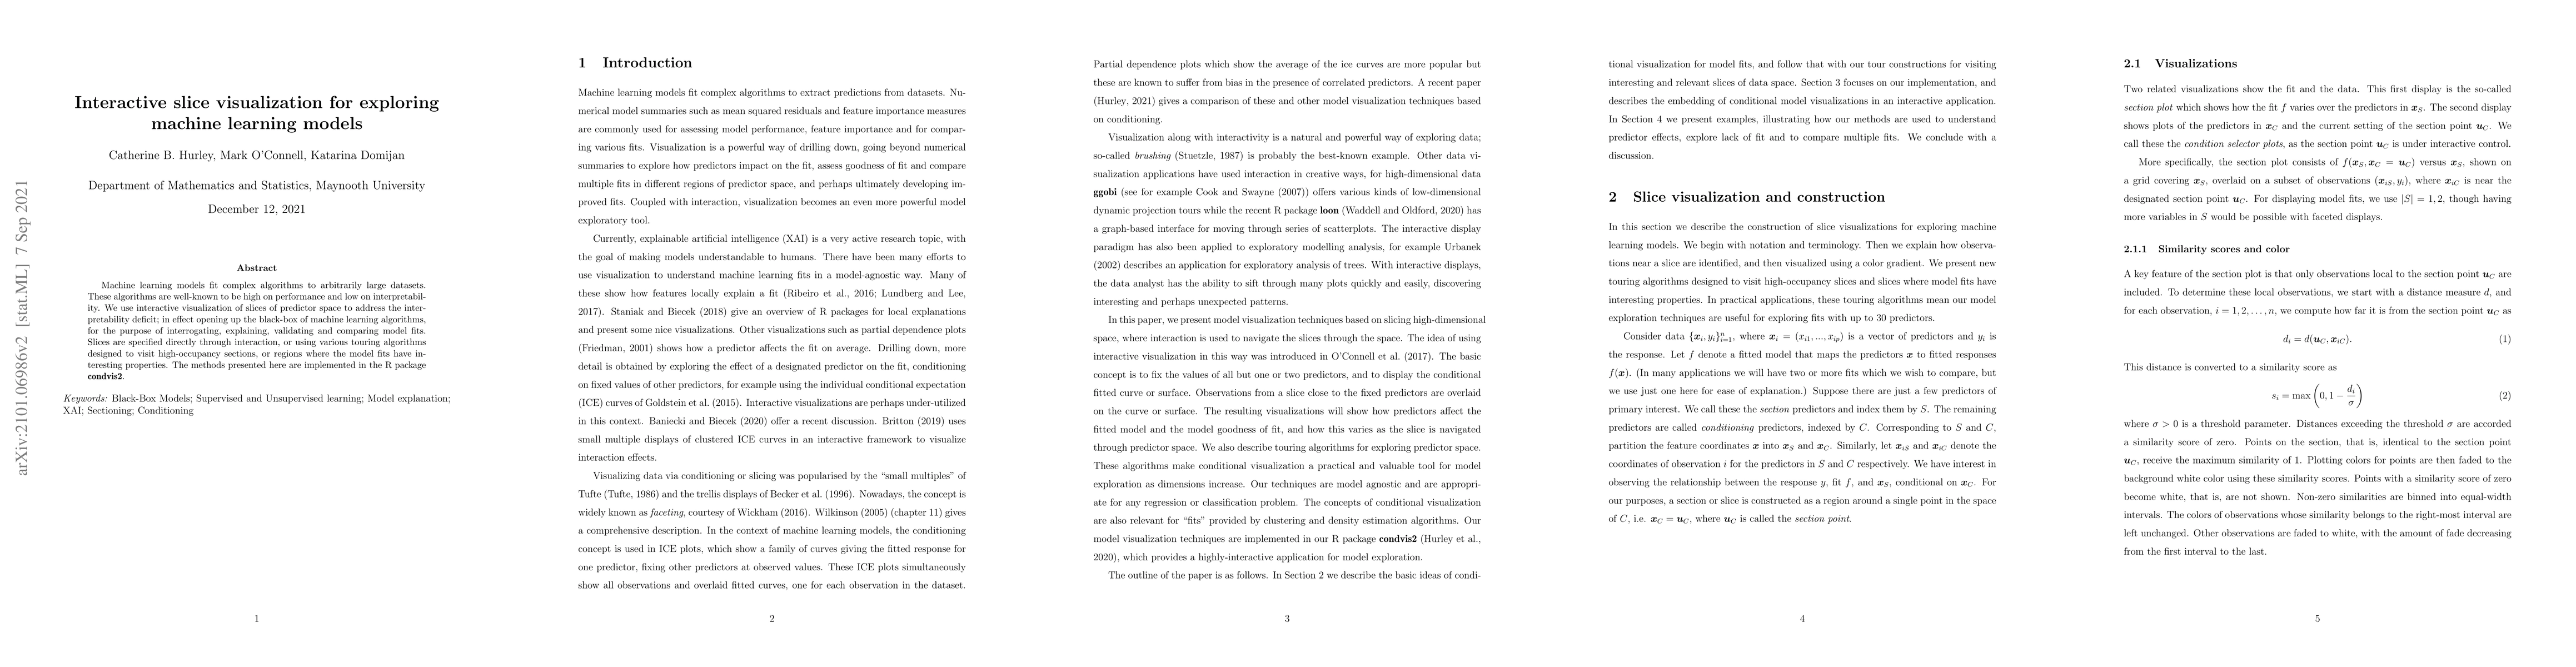
Machine learning models fit complex algorithms to arbitrarily large datasets. These algorithms are well-known to be high on performance and low on interpretability. We use interactive visualization of slices of predictor space to address the interpretability deficit; in effect opening up the black-box of machine learning algorithms, for the purpose of interrogating, explaining, validating and comparing model fits. Slices are specified directly through interaction, or using various touring algorithms designed to visit high-occupancy sections or regions where the model fits have interesting properties. The methods presented here are implemented in the R package \pkg{condvis2}.
AI Key Findings
Get AI-generated insights about this paper's methodology, results, significance, and more — seven facets brought into focus.
Impact
Paper Details
Authors
PDF Preview
Key Terms
Citation Network
Current paper (gray), citations (green), references (blue)
Display is limited for performance on very large graphs.
Discussion 0