Self-service Data Classification Using Interactive Visualization and Interpretable Machine Learning
Publication
Metrics
AI Quick Summary
This paper proposes an Iterative Visual Logical Classifier (IVLC) for self-service data classification, combining interpretable machine learning with interactive visualization. The approach uses an interactive visualization system and automated optimization algorithms to enable end users to classify data confidently and accurately, especially in sensitive domains like medical data.
Paper Preview
Abstract
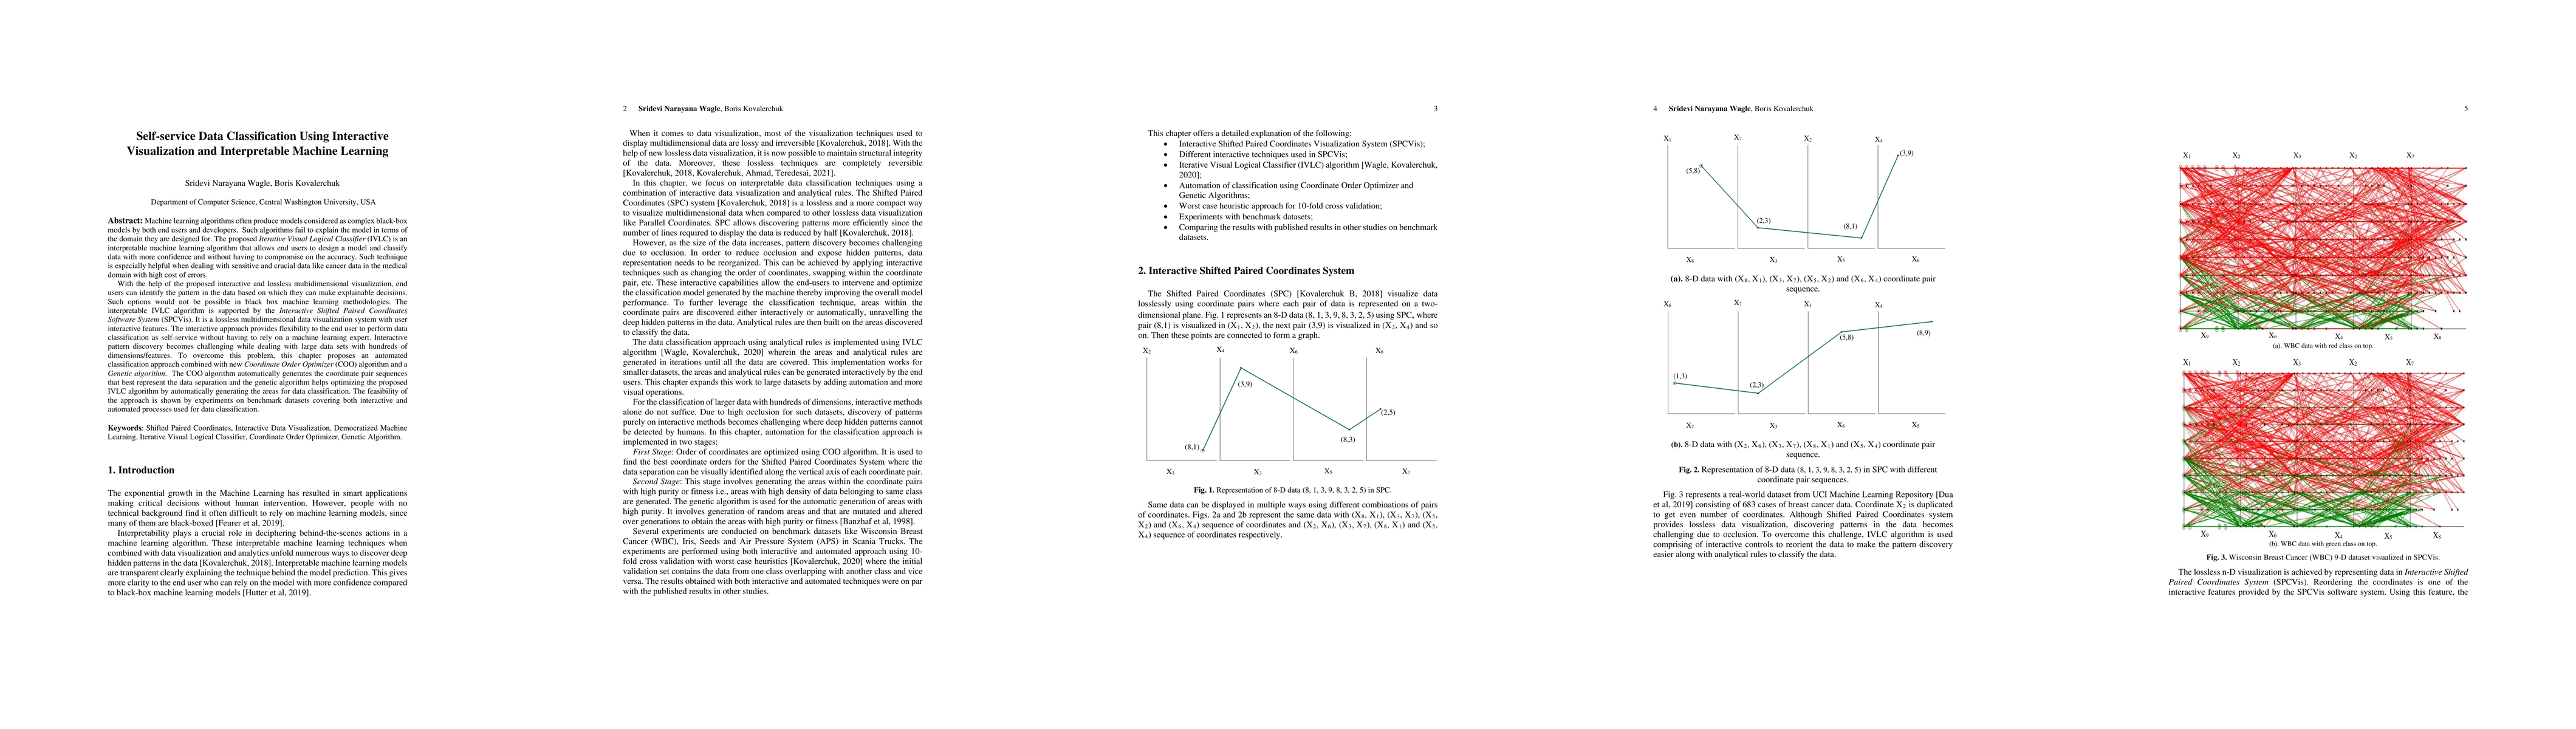
Machine learning algorithms often produce models considered as complex black-box models by both end users and developers. They fail to explain the model in terms of the domain they are designed for. The proposed Iterative Visual Logical Classifier (IVLC) is an interpretable machine learning algorithm that allows end users to design a model and classify data with more confidence and without having to compromise on the accuracy. Such technique is especially helpful when dealing with sensitive and crucial data like cancer data in the medical domain with high cost of errors. With the help of the proposed interactive and lossless multidimensional visualization, end users can identify the pattern in the data based on which they can make explainable decisions. Such options would not be possible in black box machine learning methodologies. The interpretable IVLC algorithm is supported by the Interactive Shifted Paired Coordinates Software System (SPCVis). It is a lossless multidimensional data visualization system with user interactive features. The interactive approach provides flexibility to the end user to perform data classification as self-service without having to rely on a machine learning expert. Interactive pattern discovery becomes challenging while dealing with large data sets with hundreds of dimensions/features. To overcome this problem, this chapter proposes an automated classification approach combined with new Coordinate Order Optimizer (COO) algorithm and a Genetic algorithm. The COO algorithm automatically generates the coordinate pair sequences that best represent the data separation and the genetic algorithm helps optimizing the proposed IVLC algorithm by automatically generating the areas for data classification. The feasibility of the approach is shown by experiments on benchmark datasets covering both interactive and automated processes used for data classification.
AI Key Findings
Get AI-generated insights about this paper's methodology, results, significance, and more — seven facets brought into focus.
Impact
Paper Details
Authors
PDF Preview
Key Terms
Citation Network
Current paper (gray), citations (green), references (blue)
Display is limited for performance on very large graphs.
Discussion 0