Publication
Metrics
Paper Preview
Abstract
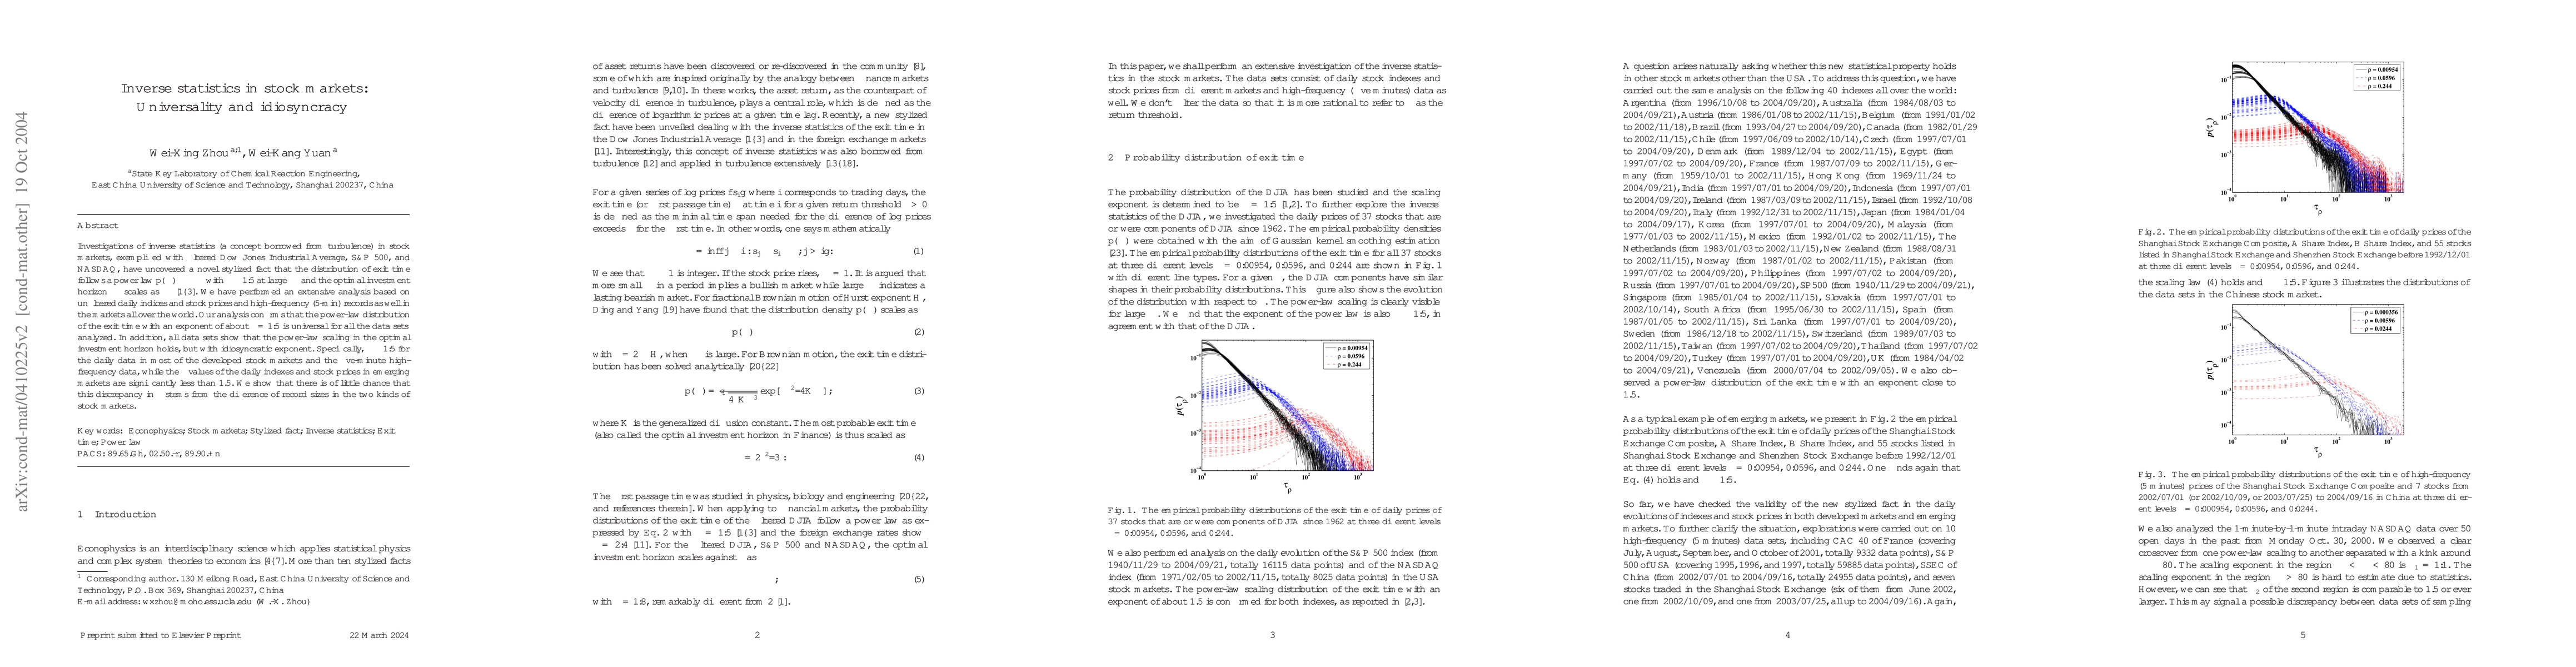
Investigations of inverse statistics (a concept borrowed from turbulence) in stock markets, exemplified with filtered Dow Jones Industrial Average, S&P 500, and NASDAQ, have uncovered a novel stylized fact that the distribution of exit time follows a power law $p(\tau_\rho) \sim \tau\rho^{-\alpha}$ with $\alpha \approx 1.5$ at large $\tau_\rho$ and the optimal investment horizon $\tau_\rho^*$ scales as $\rho^\gamma$ [1-3]. We have performed an extensive analysis based on unfiltered daily indices and stock prices and high-frequency (5-min) records as well in the markets all over the world. Our analysis confirms that the power-law distribution of the exit time with an exponent of about $\alpha=1.5$ is universal for all the data sets analyzed. In addition, all data sets show that the power-law scaling in the optimal investment horizon holds, but with idiosyncratic exponent. Specifically, $\gamma \approx 1.5$ for the daily data in most of the developed stock markets and the five-minute high-frequency data, while the $\gamma$ values of the daily indexes and stock prices in emerging markets are significantly less than 1.5. We show that there is of little chance that this discrepancy in $\gamma$ stems from the difference of record sizes in the two kinds of stock markets.
AI Key Findings
Get AI-generated insights about this paper's methodology, results, significance, and more — seven facets brought into focus.
Impact
Paper Details
PDF Preview
Citation Network
Current paper (gray), citations (green), references (blue)
Display is limited for performance on very large graphs.
Discussion 0