Juniper: A Tree+Table Approach to Multivariate Graph Visualization
Publication
Metrics
AI Quick Summary
Juniper introduces a scalable tree+table visualization technique for large, multivariate graphs, combining a linear tree layout with a table to display diverse attributes, facilitating easier analysis. The tool supports dynamic growth, restructuring, and aggregation of the tree, and is demonstrated effectively on networks like scholarly citations and story characters.
Paper Preview
Abstract
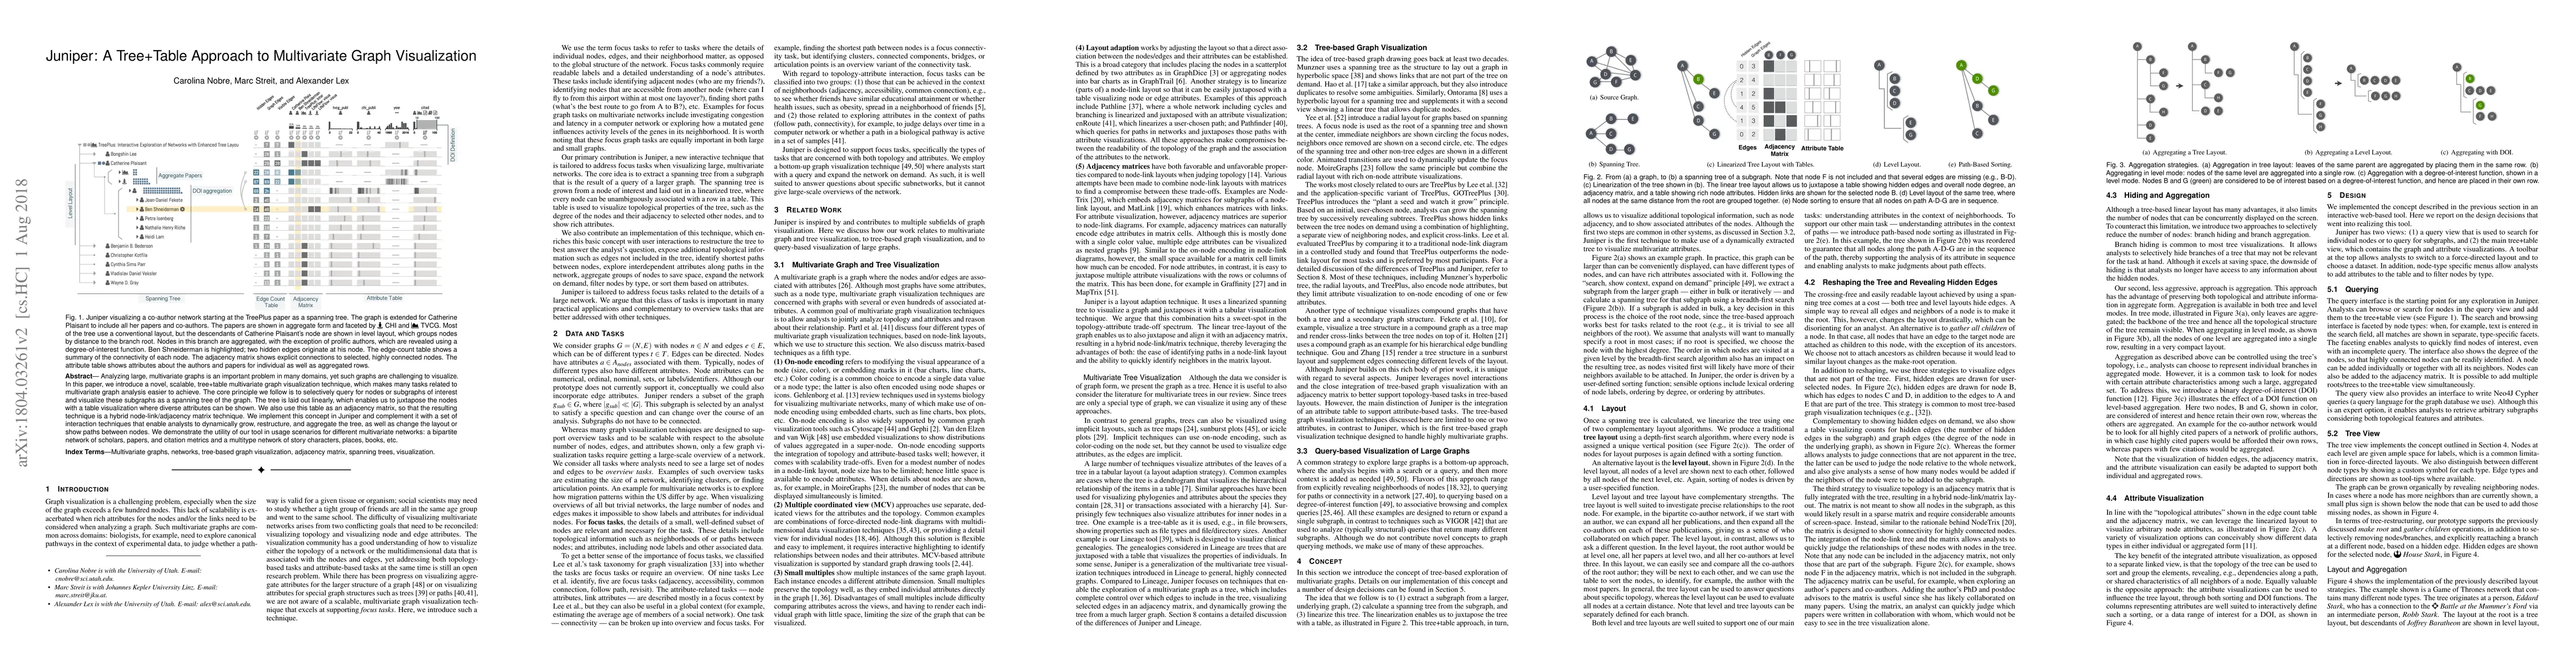
Analyzing large, multivariate graphs is an important problem in many domains, yet such graphs are challenging to visualize. In this paper, we introduce a novel, scalable, tree+table multivariate graph visualization technique, which makes many tasks related to multivariate graph analysis easier to achieve. The core principle we follow is to selectively query for nodes or subgraphs of interest and visualize these subgraphs as a spanning tree of the graph. The tree is laid out linearly, which enables us to juxtapose the nodes with a table visualization where diverse attributes can be shown. We also use this table as an adjacency matrix, so that the resulting technique is a hybrid node-link/adjacency matrix technique. We implement this concept in Juniper and complement it with a set of interaction techniques that enable analysts to dynamically grow, restructure, and aggregate the tree, as well as change the layout or show paths between nodes. We demonstrate the utility of our tool in usage scenarios for different multivariate networks: a bipartite network of scholars, papers, and citation metrics and a multitype network of story characters, places, books, etc.
AI Key Findings
Get AI-generated insights about this paper's methodology, results, significance, and more — seven facets brought into focus.
Impact
Paper Details
PDF Preview
Key Terms
Citation Network
Current paper (gray), citations (green), references (blue)
Display is limited for performance on very large graphs.
Discussion 0