Landslide mapping from Sentinel-2 imagery through change detection
Publication
Metrics
AI Quick Summary
This paper proposes an automated method for mapping newly-occurred landslides using Sentinel-2 imagery and change detection, featuring a novel deep learning architecture for fusing bi-temporal image pairs and DEM data. It also introduces a new geodatabase of validated landslide inventories and releases the dataset and code openly.
Paper Preview
Abstract
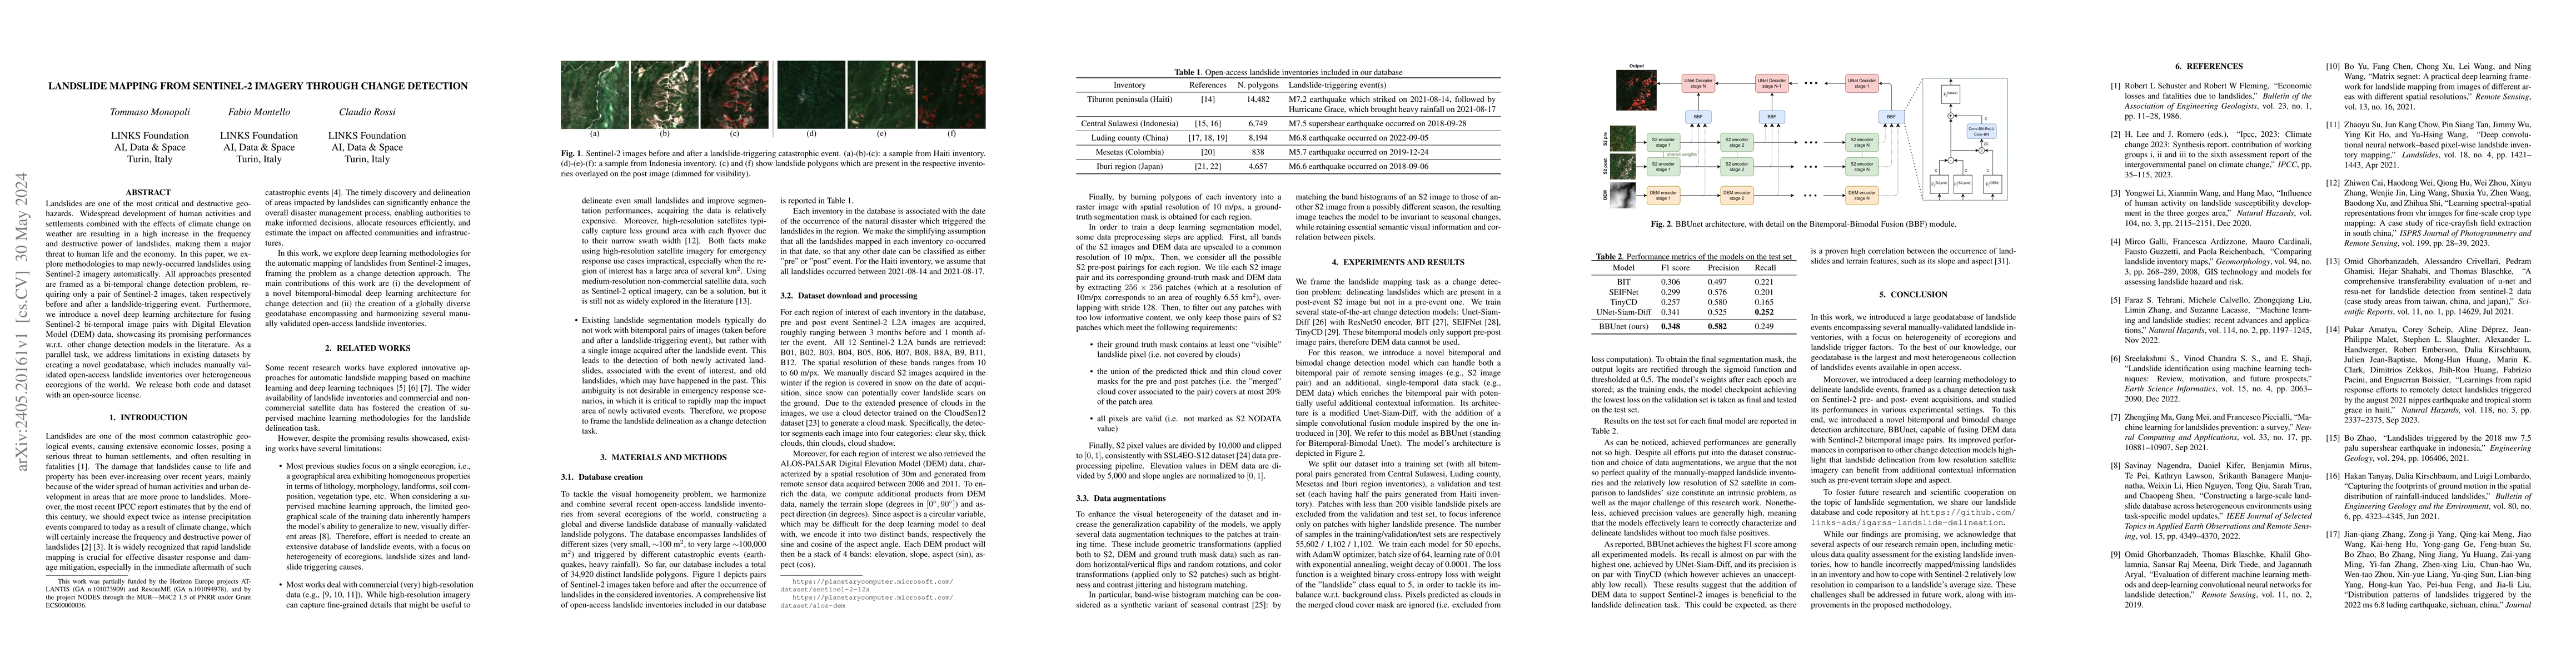
Landslides are one of the most critical and destructive geohazards. Widespread development of human activities and settlements combined with the effects of climate change on weather are resulting in a high increase in the frequency and destructive power of landslides, making them a major threat to human life and the economy. In this paper, we explore methodologies to map newly-occurred landslides using Sentinel-2 imagery automatically. All approaches presented are framed as a bi-temporal change detection problem, requiring only a pair of Sentinel-2 images, taken respectively before and after a landslide-triggering event. Furthermore, we introduce a novel deep learning architecture for fusing Sentinel-2 bi-temporal image pairs with Digital Elevation Model (DEM) data, showcasing its promising performances w.r.t. other change detection models in the literature. As a parallel task, we address limitations in existing datasets by creating a novel geodatabase, which includes manually validated open-access landslide inventories over heterogeneous ecoregions of the world. We release both code and dataset with an open-source license.
AI Key Findings
Get AI-generated insights about this paper's methodology, results, significance, and more — seven facets brought into focus.
Impact
Paper Details
Authors
PDF Preview
Key Terms
Citation Network
Current paper (gray), citations (green), references (blue)
Display is limited for performance on very large graphs.
Discussion 0