Authors
Summary
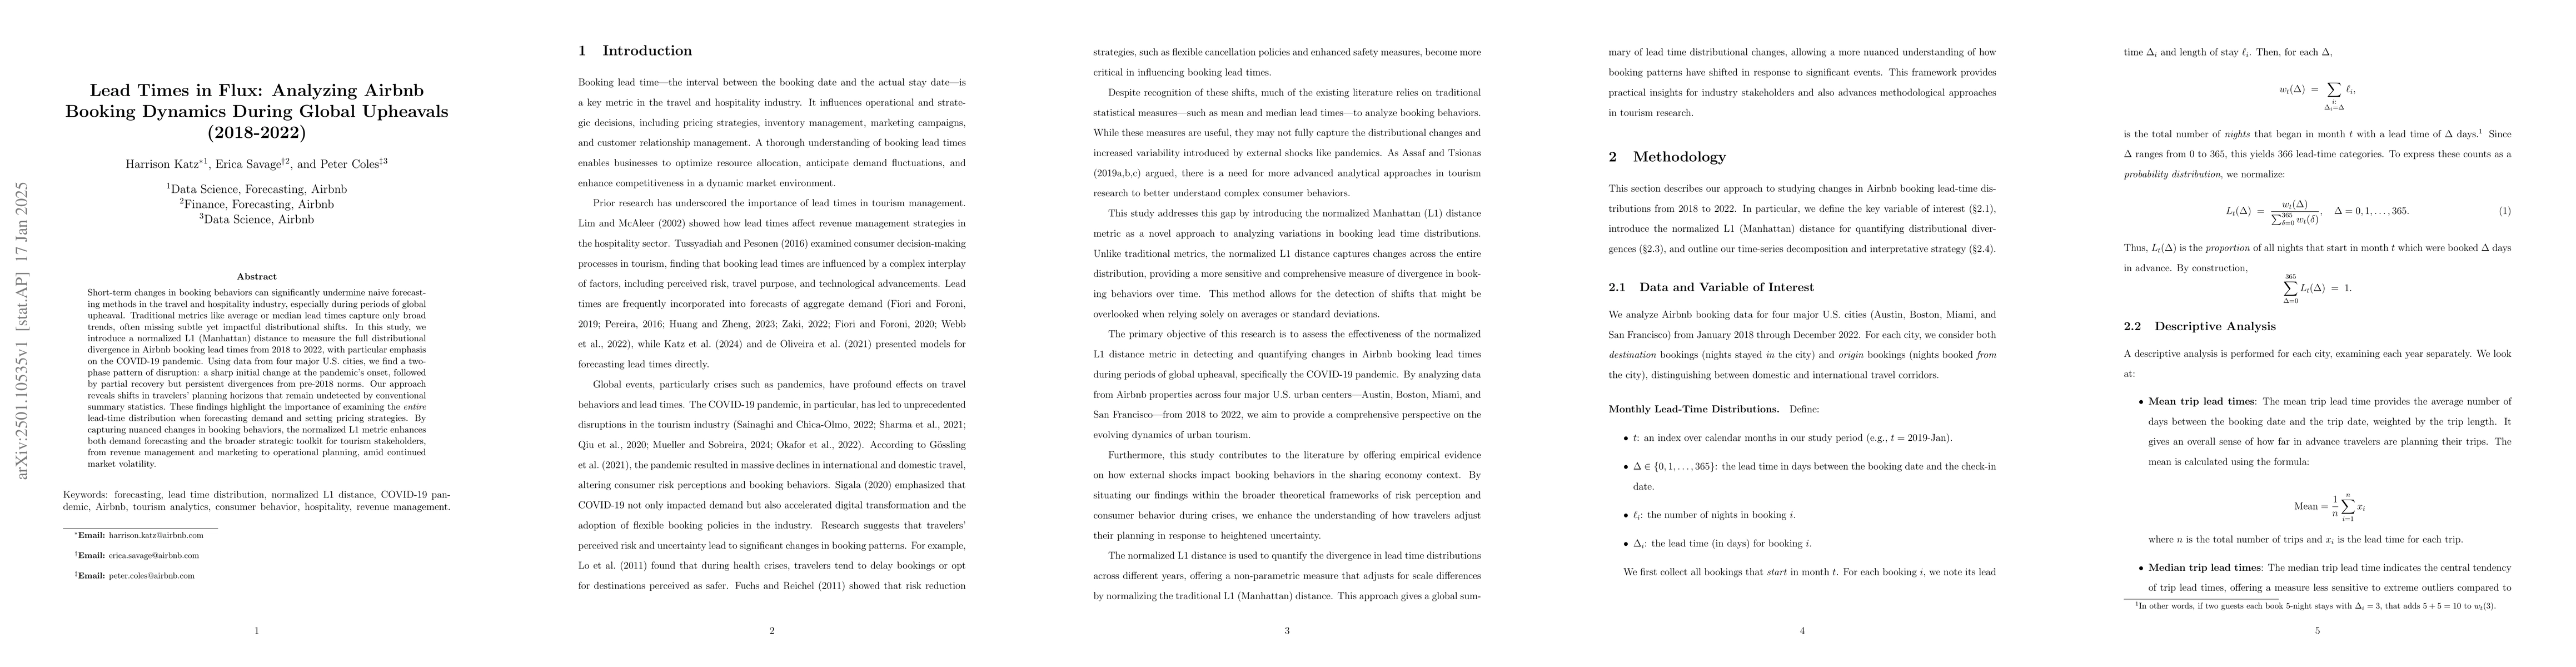
Short-term shifts in booking behaviors can disrupt forecasting in the travel and hospitality industry, especially during global crises. Traditional metrics like average or median lead times often overlook important distribution changes. This study introduces a normalized L1 (Manhattan) distance to assess Airbnb booking lead time divergences from 2018 to 2022, focusing on the COVID-19 pandemic across four major U.S. cities. We identify a two-phase disruption: an abrupt change at the pandemic's onset followed by partial recovery with persistent deviations from pre-2018 patterns. Our method reveals changes in travelers' planning horizons that standard statistics miss, highlighting the need to analyze the entire lead-time distribution for more accurate demand forecasting and pricing strategies. The normalized L1 metric provides valuable insights for tourism stakeholders navigating ongoing market volatility.
AI Key Findings
Get AI-generated insights about this paper's methodology, results, and significance.
Paper Details
PDF Preview
Similar Papers
Found 4 papersGhost Booking as a New Philanthropy Channel: A Case Study on Ukraine-Russia Conflict
Pan Hui, Gareth Tyson, Ehsan-Ul Haq et al.
Global Simulation of the Solar Wind: A Comparison With Parker Solar Probe Observations During 2018-2022
Chin-Chun Wu, Kan Liou, Brian E. Wood et al.
No citations found for this paper.
Comments (0)