lfda: An R Package for Local Fisher Discriminant Analysis and Visualization
Publication
Metrics
AI Quick Summary
Summary: The lfda R package facilitates local Fisher discriminant analysis, including kernel and semi-supervised variants, and offers visualization tools for 2D and 3D results using ggfortify and rgl.
Paper Preview
Abstract
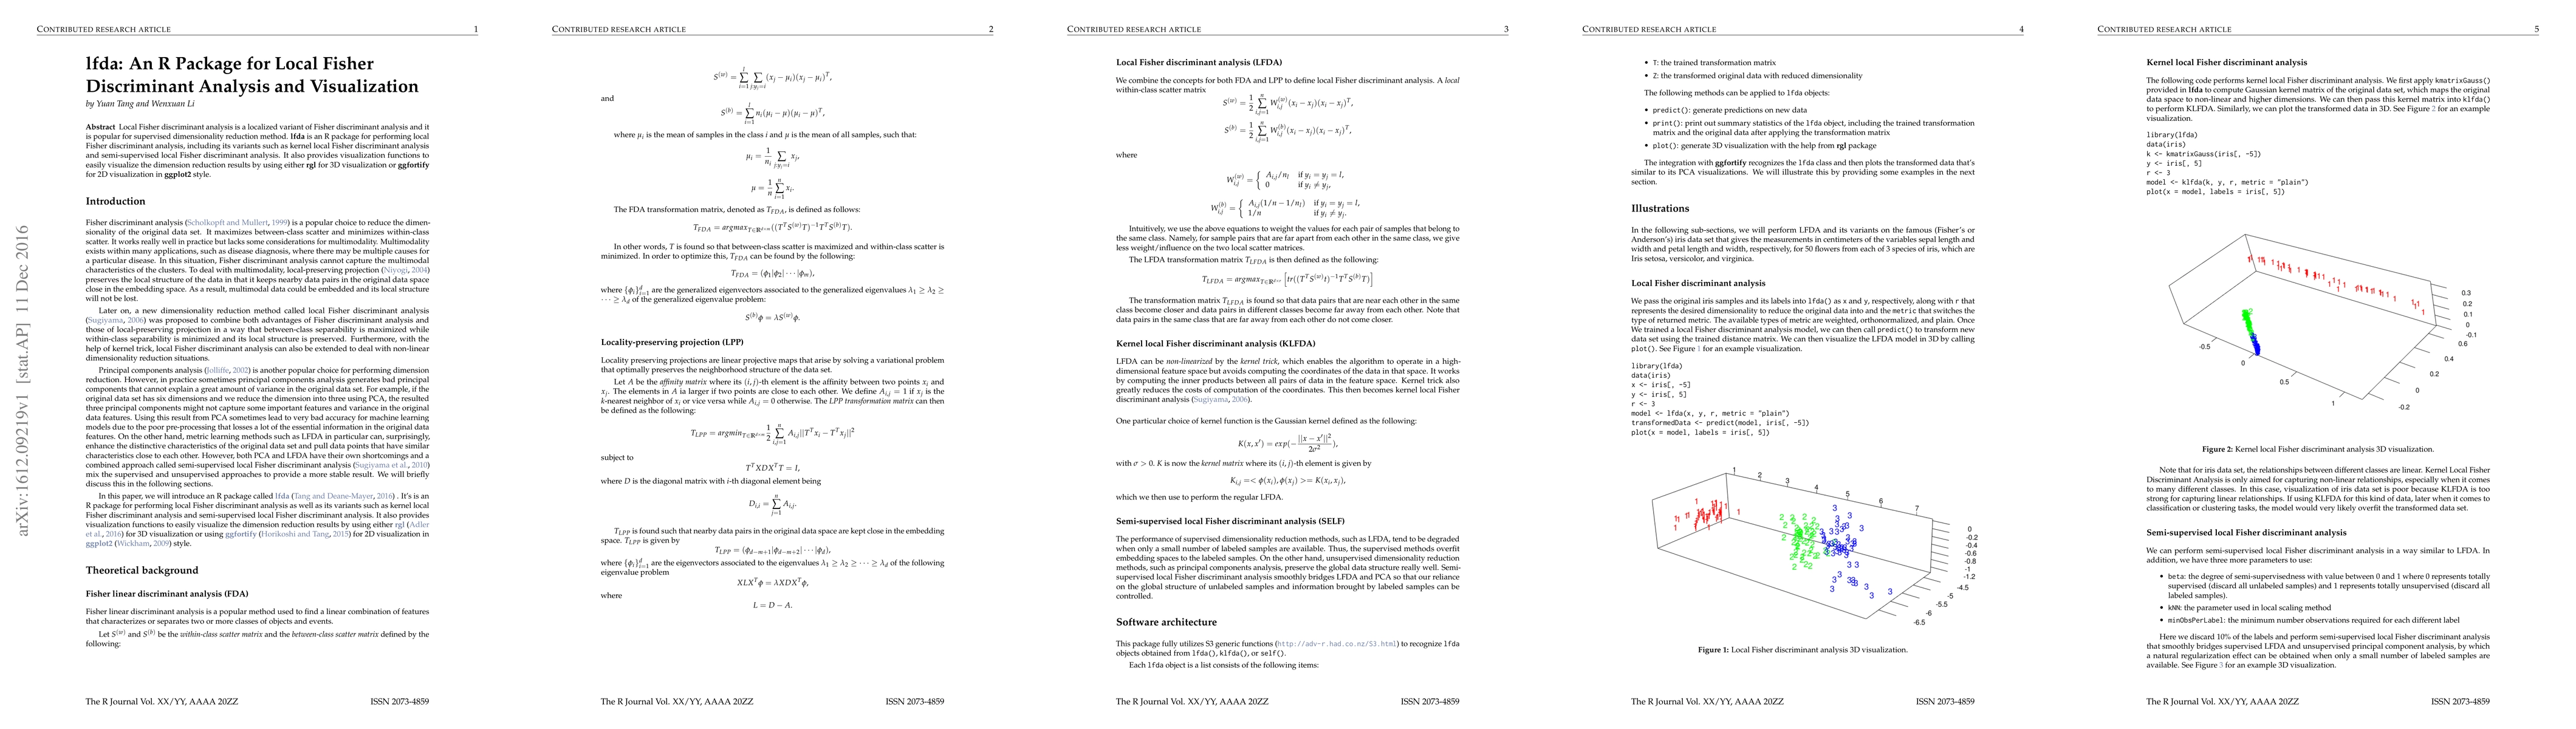
Local Fisher discriminant analysis is a localized variant of Fisher discriminant analysis and it is popular for supervised dimensionality reduction method. lfda is an R package for performing local Fisher discriminant analysis, including its variants such as kernel local Fisher discriminant analysis and semi-supervised local Fisher discriminant analysis. It also provides visualization functions to easily visualize the dimension reduction results by using either rgl for 3D visualization or ggfortify for 2D visualization in ggplot2 style.
AI Key Findings
Get AI-generated insights about this paper's methodology, results, significance, and more — seven facets brought into focus.
Impact
Paper Details
PDF Preview
Key Terms
Citation Network
Current paper (gray), citations (green), references (blue)
Display is limited for performance on very large graphs.
Discussion 0