Multivariate Analysis and Visualization using R Package muvis
Publication
Metrics
AI Quick Summary
The R package muvis offers comprehensive tools for multivariate data analysis, including preprocessing, dimensionality reduction, and visualization, with novel methods for identifying differing probability distributions between sample groups. It aims to bridge the gap between advanced methods and accessible software for diverse R users.
Paper Preview
Abstract
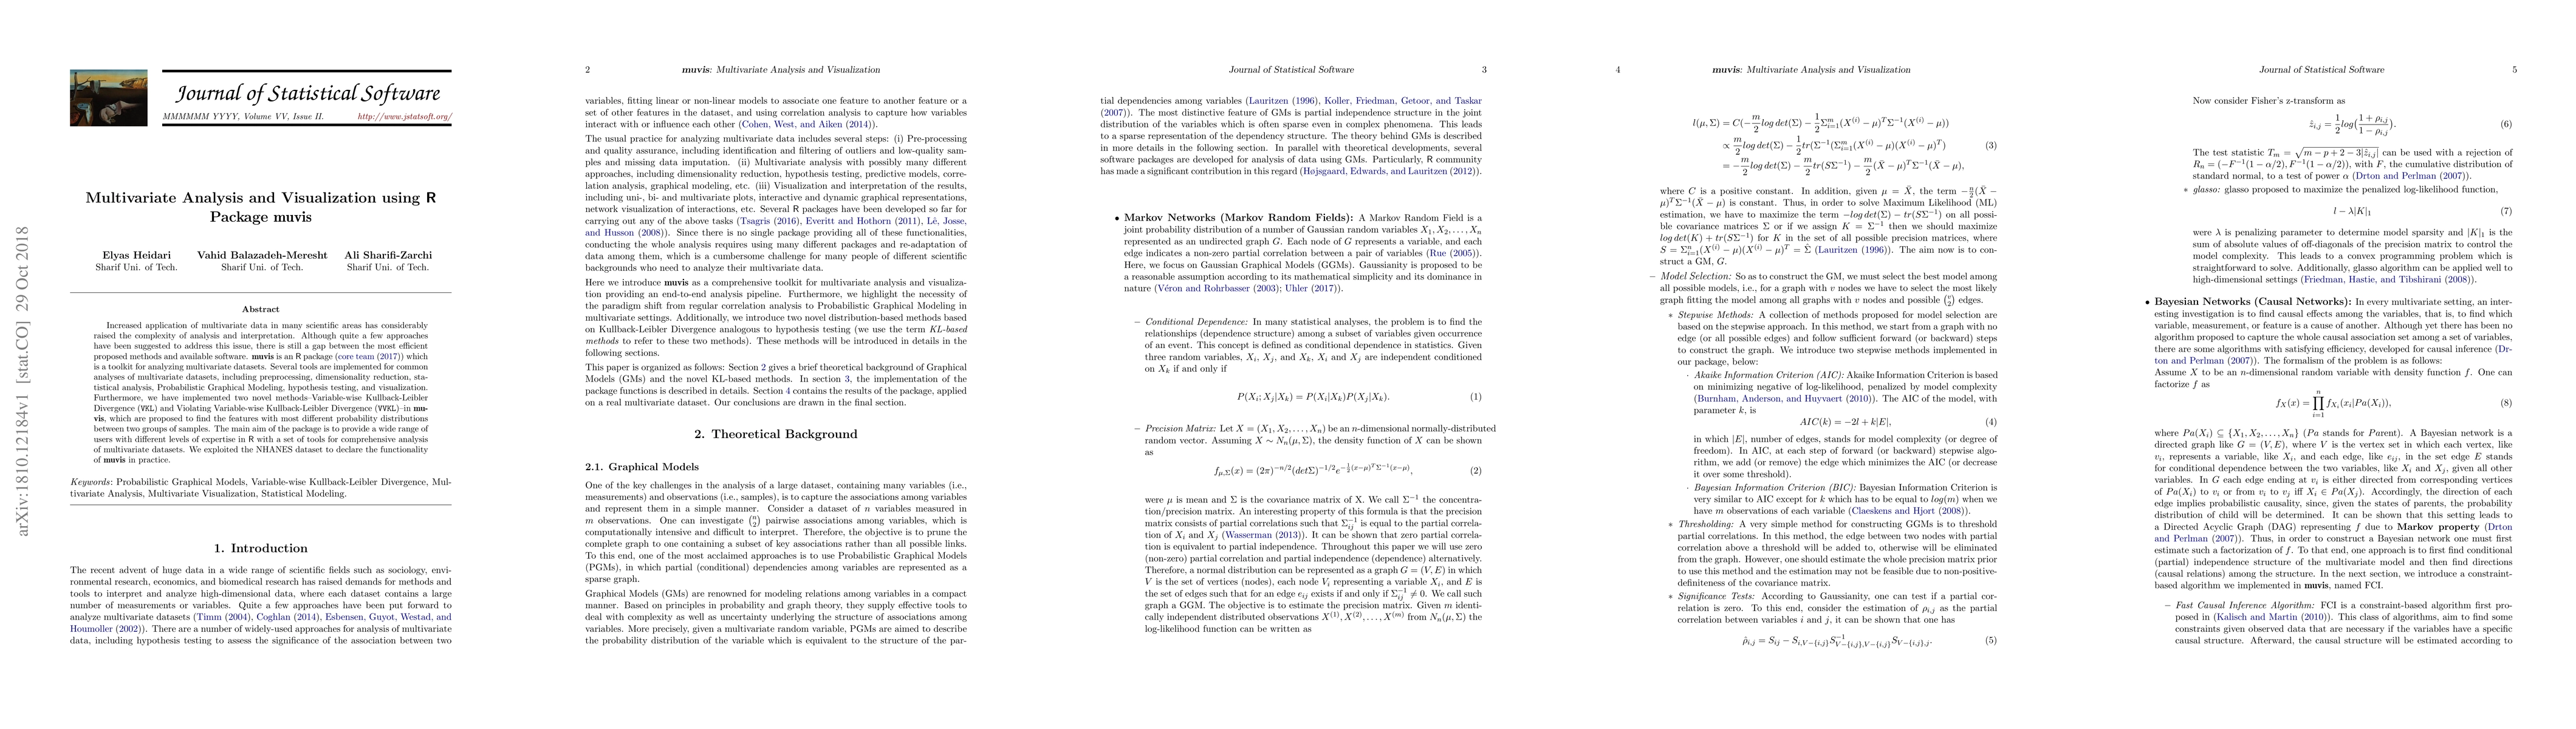
Increased application of multivariate data in many scientific areas has considerably raised the complexity of analysis and interpretation. Although quite a few approaches have been put forward to address this issue, there is still a gap between the most efficient proposed methods and available software. muvis is an R package (core team (2017)) which is a toolkit for analyzing multivariate datasets. Several tools are implemented for common analyses of multivariate datasets, including preprocessing, dimensionality reduction, statistical analysis, Probabilistic Graphical Modeling, hypothesis testing, and visualization. Furthermore, we have implemented two novel methods--Variable-wise Kullback-Leibler Divergence (VKL) and Violating Variable-wise Kullback-Leibler Divergence (VVKL)--which are proposed to find the features with most different probability distributions between two specific groups of samples. The main aim of the package is to provide a wide range of users with different levels of expertise in R with a set of tools for comprehensive analysis of multivariate datasets. We exploited the NHANES dataset to declare the functionality of muvis in practice.
AI Key Findings
Get AI-generated insights about this paper's methodology, results, significance, and more — seven facets brought into focus.
Impact
Paper Details
PDF Preview
Key Terms
Citation Network
Current paper (gray), citations (green), references (blue)
Display is limited for performance on very large graphs.
Discussion 0