Lidar-based Norwegian tree species detection using deep learning
Publication
Metrics
AI Quick Summary
This research develops a deep learning model for Norwegian tree species detection using only lidar data, achieving a macro-averaged F1 score of 0.70, which, while not surpassing combined aerial and lidar methods, benefits from freely accessible lidar imagery and labels.
Paper Preview
Abstract
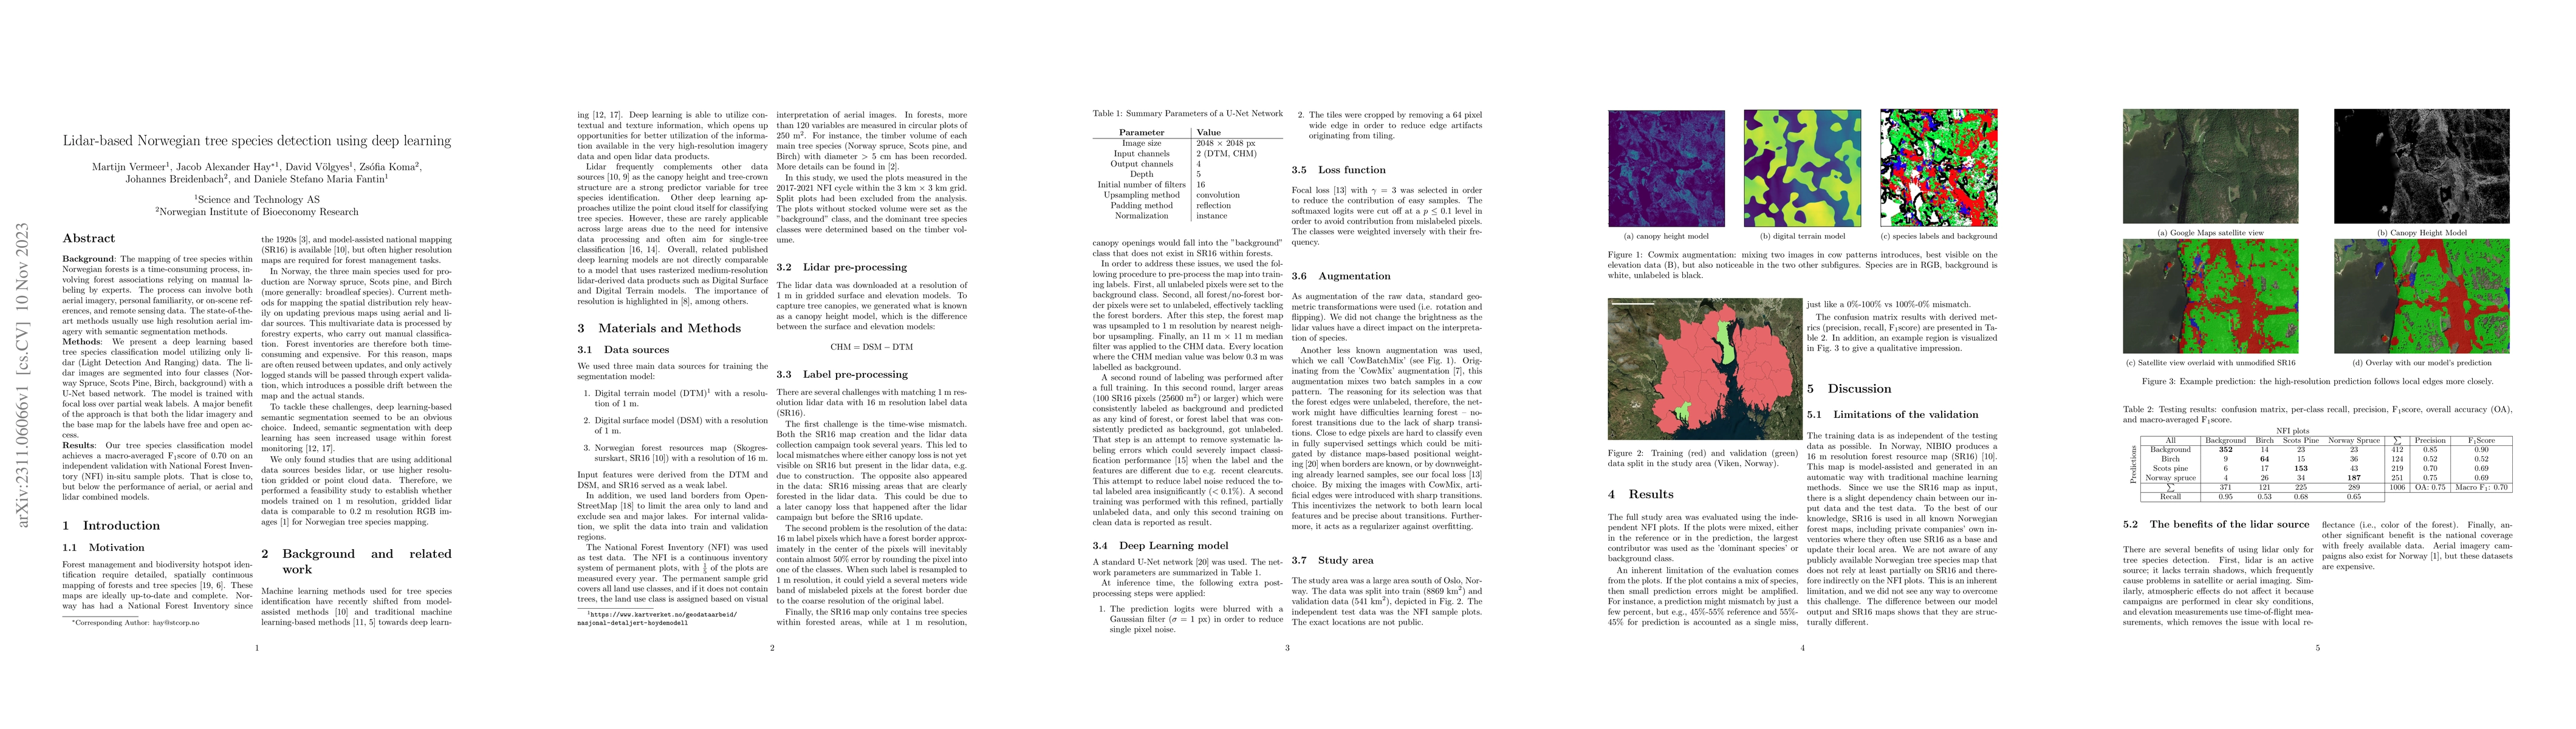
Background: The mapping of tree species within Norwegian forests is a time-consuming process, involving forest associations relying on manual labeling by experts. The process can involve both aerial imagery, personal familiarity, or on-scene references, and remote sensing data. The state-of-the-art methods usually use high resolution aerial imagery with semantic segmentation methods. Methods: We present a deep learning based tree species classification model utilizing only lidar (Light Detection And Ranging) data. The lidar images are segmented into four classes (Norway Spruce, Scots Pine, Birch, background) with a U-Net based network. The model is trained with focal loss over partial weak labels. A major benefit of the approach is that both the lidar imagery and the base map for the labels have free and open access. Results: Our tree species classification model achieves a macro-averaged F1 score of 0.70 on an independent validation with National Forest Inventory (NFI) in-situ sample plots. That is close to, but below the performance of aerial, or aerial and lidar combined models.
AI Key Findings
Get AI-generated insights about this paper's methodology, results, significance, and more — seven facets brought into focus.
Impact
Paper Details
Authors
PDF Preview
Key Terms
Citation Network
Current paper (gray), citations (green), references (blue)
Display is limited for performance on very large graphs.
Discussion 0