Publication
Metrics
AI Quick Summary
This paper constructs complex networks of US S&P500 stock returns to analyze market correlations, revealing that nonlinear dependencies significantly increase during financial crises, contrary to the expectation of reduced linear correlations. It proposes using network centrality as an early warning indicator for market crises and demonstrates improved portfolio optimization by integrating nonlinear dependency measures.
Paper Preview
Abstract
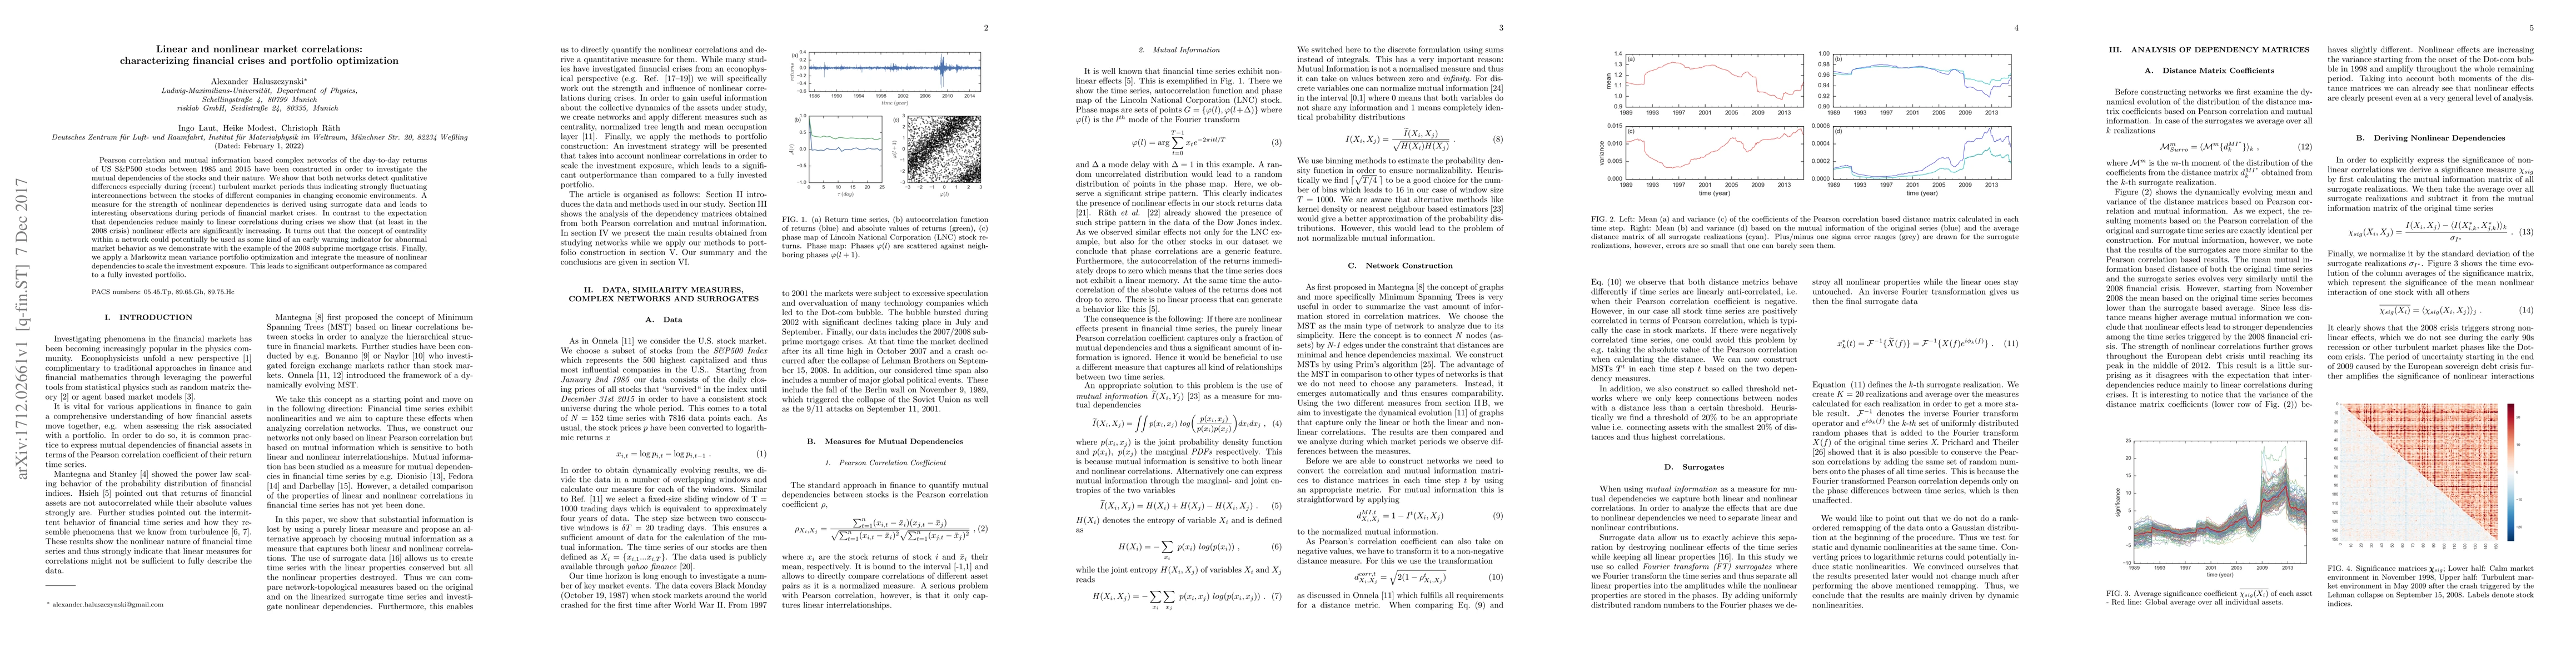
Pearson correlation and mutual information based complex networks of the day-to-day returns of US S&P500 stocks between 1985 and 2015 have been constructed in order to investigate the mutual dependencies of the stocks and their nature. We show that both networks detect qualitative differences especially during (recent) turbulent market periods thus indicating strongly fluctuating interconnections between the stocks of different companies in changing economic environments. A measure for the strength of nonlinear dependencies is derived using surrogate data and leads to interesting observations during periods of financial market crises. In contrast to the expectation that dependencies reduce mainly to linear correlations during crises we show that (at least in the 2008 crisis) nonlinear effects are significantly increasing. It turns out that the concept of centrality within a network could potentially be used as some kind of an early warning indicator for abnormal market behavior as we demonstrate with the example of the 2008 subprime mortgage crisis. Finally, we apply a Markowitz mean variance portfolio optimization and integrate the measure of nonlinear dependencies to scale the investment exposure. This leads to significant outperformance as compared to a fully invested portfolio.
AI Key Findings
Get AI-generated insights about this paper's methodology, results, significance, and more — seven facets brought into focus.
Impact
Paper Details
PDF Preview
Key Terms
Citation Network
Current paper (gray), citations (green), references (blue)
Display is limited for performance on very large graphs.
Discussion 0