Quick Summary:

The research introduces Lux, a framework that provides real-time visualization recommendations for dataframes in computational notebooks. Lux adds minimal overhead to pandas, offering visualization suggestions and analysis directions, which have been positively evaluated by data scientists in usability studies and adopted by practitioners with over 3.1k Github stars.

Summary

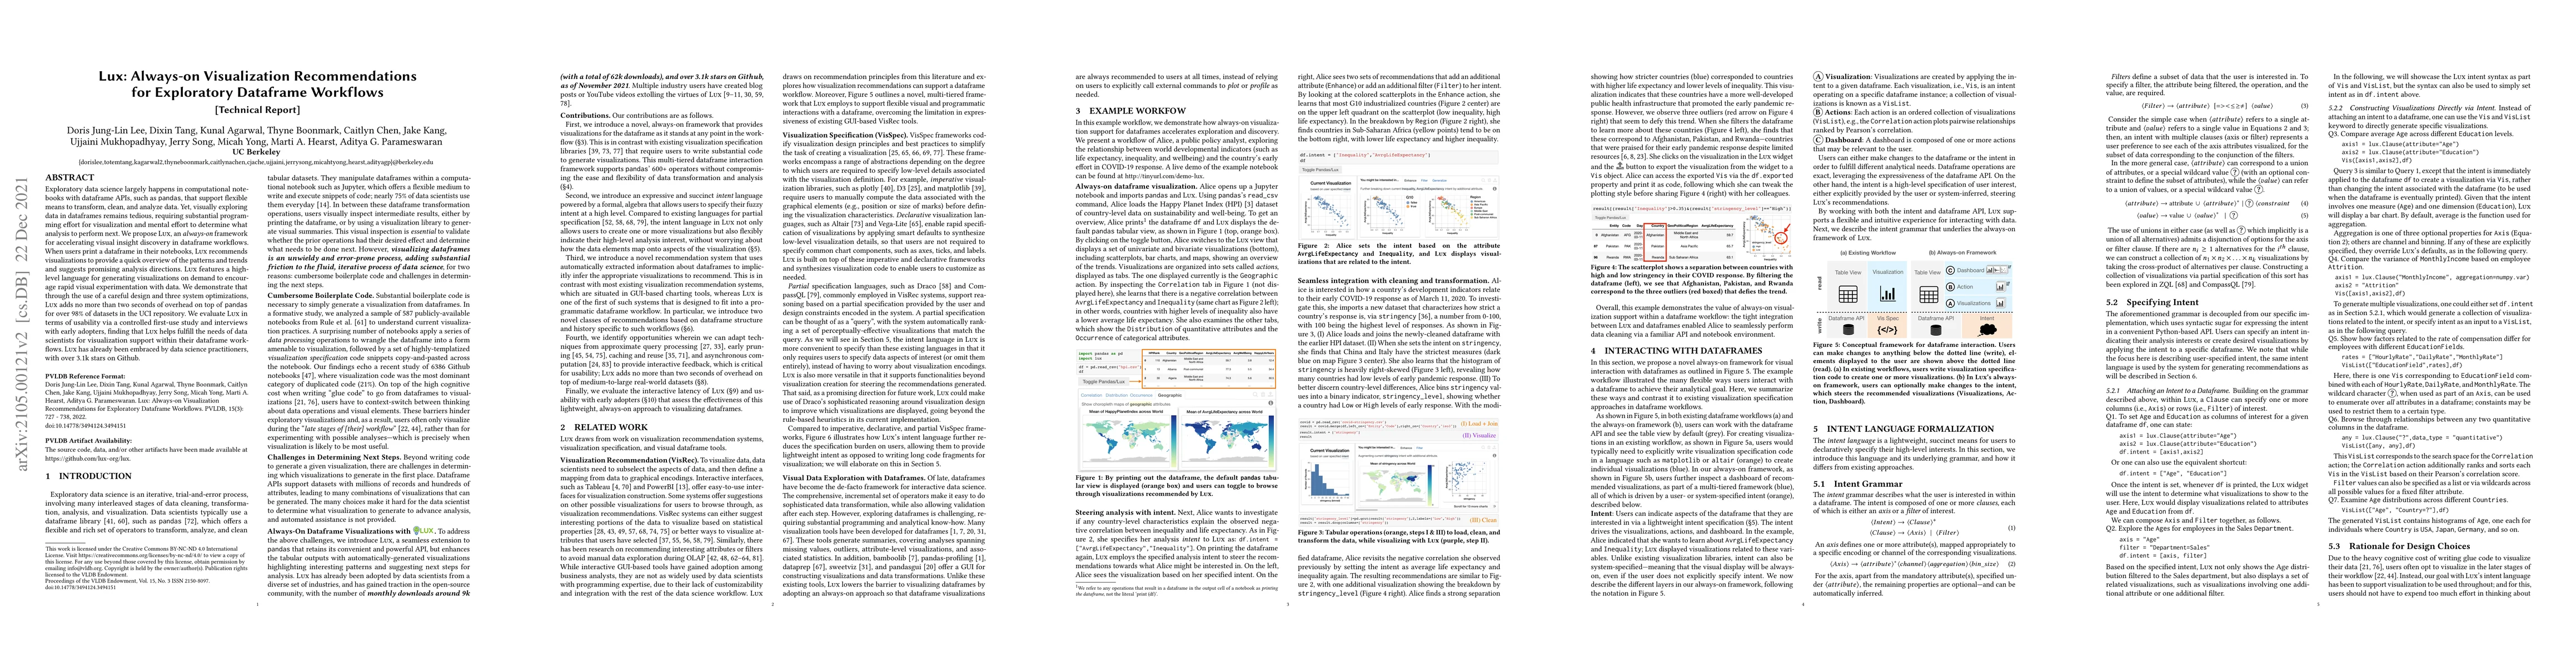
Exploratory data science largely happens in computational notebooks with dataframe APIs, such as pandas, that support flexible means to transform, clean, and analyze data. Yet, visually exploring data in dataframes remains tedious, requiring substantial programming effort for visualization and mental effort to determine what analysis to perform next. We propose Lux, an always-on framework for accelerating visual insight discovery in dataframe workflows. When users print a dataframe in their notebooks, Lux recommends visualizations to provide a quick overview of the patterns and trends and suggests promising analysis directions. Lux features a high level language for generating visualizations on demand to encourage rapid visual experimentation with data. We demonstrate that through the use of a careful design and three system optimizations, Lux adds no more than two seconds of overhead on top of pandas for over 98% of datasets in the UCI repository. We evaluate Lux in terms of usability via a controlled first-use study and interviews with early adopters, finding that Lux helps fulfill the needs of data scientists for visualization support within their dataframe workflows. Lux has already been embraced by data science practitioners, with over 3.1k stars on Github.

AI Key Findings

Get AI-generated insights about this paper's methodology, results, and significance.

Paper Details

PDF Preview

Download PDF

Key Terms

data (0.175)
use (0.125)
early (0.123)
remains (0.112)
analyze (0.104)
propose (0.074)
high (0.069)
study (0.063)

Citation Network

Current paper (gray), citations (green), references (blue)

Current Paper
Citations
References
Click to view
Title Authors Year Actions
VIGMA: An Open-Access Framework for Visual Gait and Motion Analytics
Kazi Shahrukh Omar, Shuaijie Wang, Ridhuparan Kungumaraju, T. Bhatt, Fabio Miranda
2025
View Paper
LakeVisage: Towards Scalable, Flexible and Interactive Visualization Recommendation for Data Discovery over Data Lakes
Yi Hu, Jin Wang, Sajjadur Rahman
2025
View Paper
Malicious Query Recognition Using Chosen Machine Learning Techniques
C. Y. Daramola, S. Akinpelu, Ezekiel Olajuwon Akinyemi, S. A. Ajagbe, G. A. Akinpelu, Mathew Olusegun Adigun
2025
View Paper
Divisi: Interactive Search and Visualization for Scalable Exploratory Subgroup Analysis
Venkatesh Sivaraman, Zexuan Li, Adam Perer
2025
View Paper
InsightCube: Accelerating Interactive Insight Discovery in Exploratory Data Analysis
Hanbing Zhang, Yinan Jing, Wei Zhang, Zhenying He, Kai Zhang, Xiaoyang Sean Wang, Zhenqiang Chen, Changchun Zhang
2025
View Paper
NoteFlow: Recommending Charts as Sight Glasses for Tracing Data Flow in Computational Notebooks
Yuan Tian, Dazhen Deng, Sen Yang, Huawei Zheng, Bowen Shi, Kai Xiong, Xinjing Yi, Yingcai Wu
2025
View Paper
Inferring Visualization Intent from Conversation
Haotian Li, Nithin V. Chalapathi, Huamin Qu, Alvin Cheung, Aditya G. Parameswaran
2024
View Paper
Charting EDA: Characterizing Interactive Visualization Use in Computational Notebooks with a Mixed-Methods Formalism
Dylan Wootton, Amy Rae Fox, Evan Peck, Arvind Satyanarayan
2024
View Paper
Data Formulator 2: Iterative Creation of Data Visualizations, with AI Transforming Data Along the Way
Chenglong Wang, Bongshin Lee, Steven Drucker, Dan Marshall, Jianfeng Gao
2024
View Paper
PD-Explain: A Unified Python-native Framework for Query Explanations Over DataFrames
Itay Elyashiv, Amir Gilad, Edna Isakov, Tal Tikochinsky, Amit Somech
2024
View Paper
Enabling Tabular Data Exploration for Blind and Low-Vision Users
Yanan Wang, Arjun Srinivasan, Yea-Seul Kim
2024
View Paper
A Visual Approach to Understand Parsing Algorithms through Python and Manim
P. Akhilesh, K. Amal Krishna, S. K. Bharadwaj, D. Subham, Meena Belwal
2024
View Paper
PyGWalker: On-the-fly Assistant for Exploratory Visual Data Analysis
Yue Yu, Leixian Shen, Fei Long, Huamin Qu, Hao Chen
2024
View Paper
LINX: A Language Driven Generative System for Goal-Oriented Automated Data Exploration
Tavor Lipman, Tova Milo, Amit Somech, Tomer Wolfson, Oz Zafar
2024
View Paper
GTS: GPU-based Tree Index for Fast Similarity Search
Yifan Zhu, Rui Ma, Baihua Zheng, Xiangyu Ke, Lu Chen, Yunjun Gao
2024
View Paper
Semantically Aligned Question and Code Generation for Automated Insight Generation
Ananya Singha, Austin Z. Henley, Vu Le, Mukul Singh, Microsoft Belgium
2024
View Paper
OutlineSpark: Igniting AI-powered Presentation Slides Creation from Computational Notebooks through Outlines
Fengjie Wang, Yanna Lin, Leni Yang, Haotian Li, Mingyang Gu, Min Zhu, Huamin Qu
2024
View Paper
TabEE: Tabular Embeddings Explanations
Roni Copul, Nave Frost, Tova Milo, Kathy Razmadze
2024
View Paper
Evaluation of Dataframe Libraries for Data Preparation on a Single Machine
Angelo Mozzillo, Luca Zecchini, Luca Gagliardelli, Adeel Aslam, Sonia Bergamaschi, Giovanni Simonini
2023
View Paper
Conversational AI Threads for Visualizing Multidimensional Datasets
Matt-Heun Hong, Anamaria Crisan
2023
View Paper
InstructExcel: A Benchmark for Natural Language Instruction in Excel
Justin Payan, Swaroop Mishra, Mukul Singh, Carina Negreanu, Christian Poelitz, Chitta Baral, Subhro Roy, Rasika Chakravarthy, Benjamin Van Durme, E. Nouri
2023
View Paper
RekomGNN: Visualizing, Contextualizing and Evaluating Graph Neural Networks Recommendations
C. Brumar, G. Appleby, Jen Rogers, Teddy Matinde, Lara Thompson, Remco Chang, Anamaria Crisan
2023
View Paper
Data Formulator: AI-Powered Concept-Driven Visualization Authoring
Chenglong Wang, John R Thompson, Bongshin Lee
2023
View Paper
WhatsNext: Guidance-enriched Exploratory Data Analysis with Interactive, Low-Code Notebooks
Chen Chen, J. Hoffswell, Shunan Guo, R. Rossi, G. Chan, Fan Du, E. Koh, Zhicheng Liu
2023
View Paper
When Provenance Aids and Complicates Reproducibility Judgments
D. Koop
2023
View Paper
Dead or Alive: Continuous Data Profiling for Interactive Data Science
Will Epperson, Vaishnavi Gorantla, Dominik Moritz, Adam Perer
2023
View Paper
Designing Interfaces to Elicit Data Issues for Data Workers
Kevin Bryson
2023
View Paper
InkSight: Leveraging Sketch Interaction for Documenting Chart Findings in Computational Notebooks
Yanna Lin, Haotian Li, Leni Yang, Aoyu Wu, Huamin Qu
2023
View Paper
Auto-Tables: Synthesizing Multi-Step Transformations to Relationalize Tables without Using Examples
Peng Li, Yeye He, Cong Yan, Yue Wang, Surajit Chauduri
2023
View Paper
ATENA-PRO: Generating Personalized Exploration Notebooks with Constrained Reinforcement Learning
Tavor Lipman, Tova Milo, Amit Somech
2023
View Paper
Learned Data-aware Image Representations of Line Charts for Similarity Search
Yuyu Luo, Yihui Zhou, Nan Tang, Guoliang Li, Chengliang Chai, Leixian Shen
2023
View Paper
SuperNOVA: Design Strategies and Opportunities for Interactive Visualization in Computational Notebooks
Zijie J. Wang, David Munechika, Seongmin Lee, Duen Horng Chau
2023
View Paper
How Data Analysts Use a Visualization Grammar in Practice
Xiaoying Pu, M. Kay
2023
View Paper
Designing a Glyph-Based Polar Chart to Interpret the Results of Machine Learning Models
Trung Nguyen, David Gentile, G. Jamieson, R. Gosine, Hakimeh Purmehdi
2023
View Paper
Notable: On-the-fly Assistant for Data Storytelling in Computational Notebooks
Haotian Li, Lu Ying, Haidong Zhang, Yingcai Wu, Huamin Qu, Yun Wang
2023
View Paper
On the Design of AI-powered Code Assistants for Notebooks
A. Mcnutt, Chenglong Wang, R. Deline, S. Drucker
2023
View Paper
Advances in Exploratory Data Analysis, Visualisation and Quality for Data Centric AI Systems
Hima Patel, Shanmukha C. Guttula, Ruhi Sharma Mittal, Naresh Manwani, Laure Berti-Équille, Abhijit Manatkar
2022
View Paper
Animated Vega-Lite: Unifying Animation with a Grammar of Interactive Graphics
Jonathan Zong, Josh Pollock, Dylan Wootton, Arvind Satyanarayan
2022
View Paper
Opportunities and risks for engaging research participants with self-logged menstrual health data
Samantha Robertson, K. Harley, Niloufar Salehi
2022
View Paper
FuzzyData: A Scalable Workload Generator for Testing Dataframe Workflow Systems
M. S. Rehman, Aaron J. Elmore
2022
View Paper
ShaderNet: graph-based shader code analysis to accelerate GPU's performance improvement
Lin Zhao, Arijit Khan, Robby Luo
2022
View Paper
Selecting Sub-tables for Data Exploration
Kathy Razmadze, Yael Amsterdamer, Amit Somech, S. Davidson, Tova Milo
2022
View Paper
Towards Observability for Production Machine Learning Pipelines [Vision]
Shreya Shankar, Aditya G. Parameswaran
2021
View Paper
Navi: Data Analysis System Powered by Natural Language Interaction
Yupeng Xie, Yuyu Luo, Jianhua Feng
2024
View Paper
Data Formulator 2: Iteratively Creating Rich Visualizations with AI
Chenglong Wang, Bongshin Lee, Steven Drucker, Dan Marshall, Jianfeng Gao
2024
View Paper
A Systematic Review of Visualization Recommendation Systems: Goals, Strategies, Interfaces, and Evaluations
Zehua Zeng, Leilani Battle
2024
View Paper
VALS: Supporting Visual Data Analysis in Longitudinal Clinical Studies
Duván A. Gómez, N. Charpak, A. Montealegre, J. T. Hernández
2023
View Paper
User Interfaces for Exploratory Data Analysis: A Survey of Open-Source and Commercial Tools
Jinglin Peng, Weiyuan Wu, Jing Nathan Yan, Danrui Qi, Jeffrey M. Rzeszotarski, Jiannan Wang
2022
View Paper
Towards Observability for Machine Learning Pipelines
Shreya Shankar, Aditya G. Parameswaran
2022
View Paper
Intelligent Data Visualization Analysis Techniques: A Survey
Yu-Yu Luo, Xue-Di Qin, Yu-Peng Xie, Guo-Liang Li
View Paper

Comments (0)

This website uses cookies to ensure you get the best experience. Learn more