Lymph Node Gross Tumor Volume Detection in Oncology Imaging via Relationship Learning Using Graph Neural Network
Publication
Metrics
AI Quick Summary
This paper proposes a graph neural network framework to detect Gross Tumor Volume in lymph nodes (GTV$_{LN}$) by learning both appearance and inter-LN relationships. The method significantly improves the detection accuracy over the state-of-the-art, achieving a $5.5\%$ boost in F1 score and higher sensitivity.
Paper Preview
Abstract
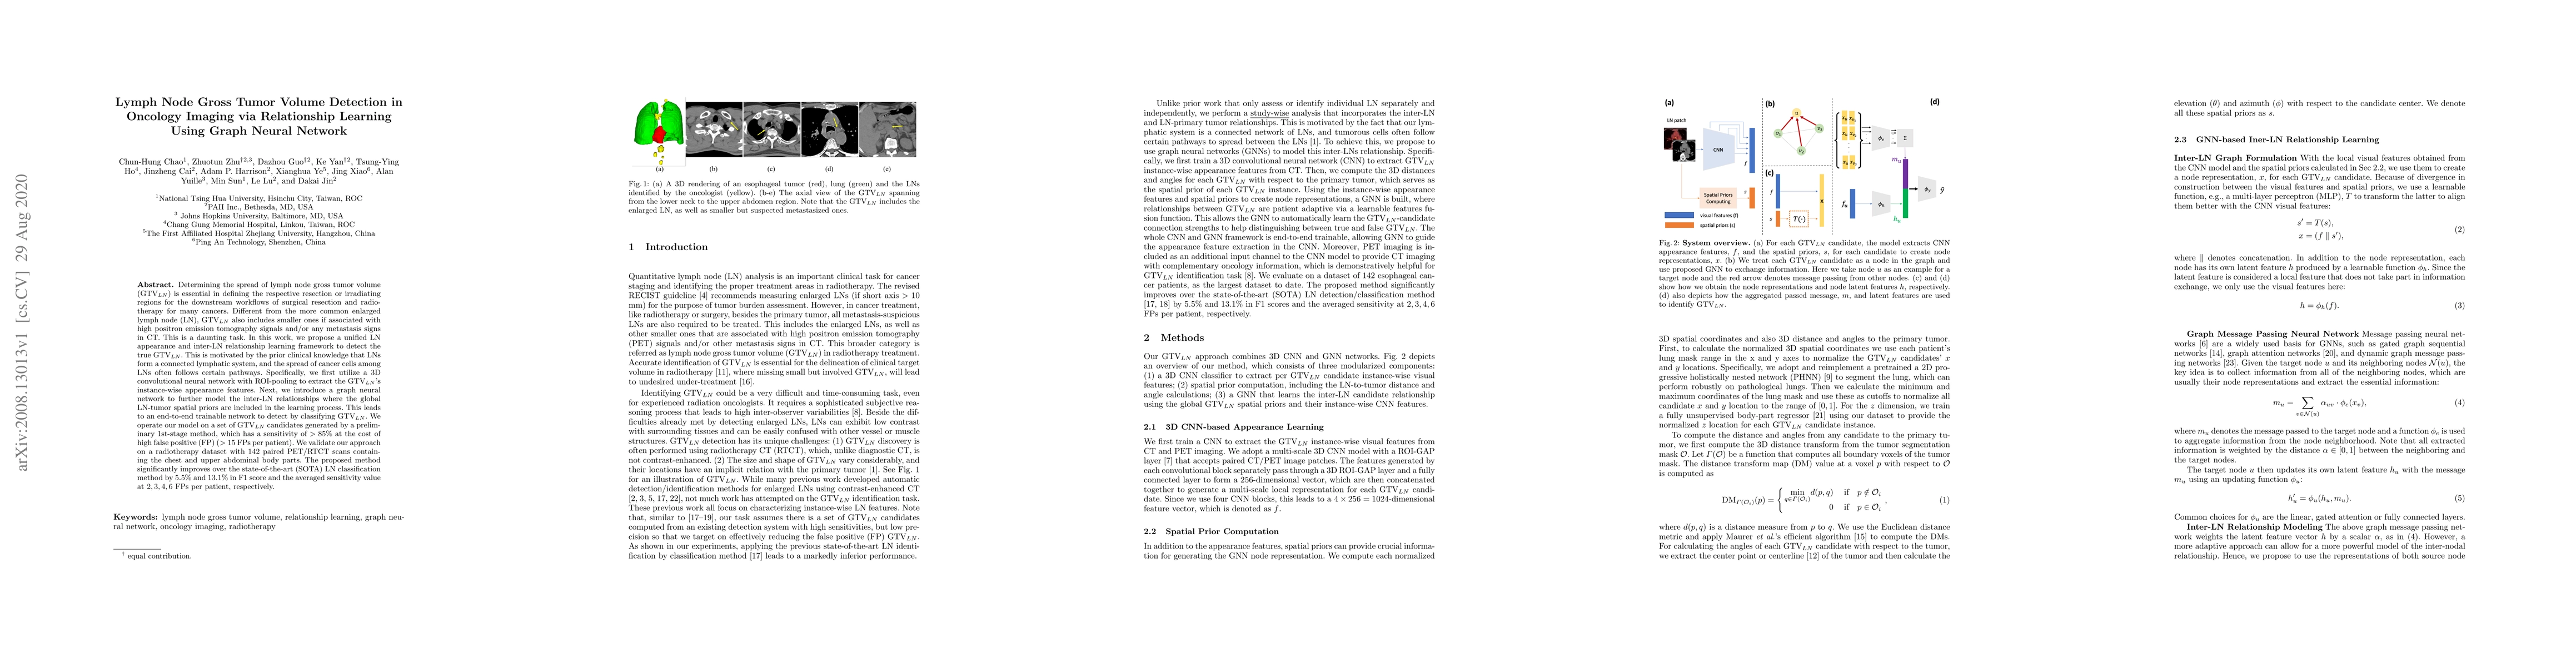
Determining the spread of GTV$_{LN}$ is essential in defining the respective resection or irradiating regions for the downstream workflows of surgical resection and radiotherapy for many cancers. Different from the more common enlarged lymph node (LN), GTV$_{LN}$ also includes smaller ones if associated with high positron emission tomography signals and/or any metastasis signs in CT. This is a daunting task. In this work, we propose a unified LN appearance and inter-LN relationship learning framework to detect the true GTV$_{LN}$. This is motivated by the prior clinical knowledge that LNs form a connected lymphatic system, and the spread of cancer cells among LNs often follows certain pathways. Specifically, we first utilize a 3D convolutional neural network with ROI-pooling to extract the GTV$_{LN}$'s instance-wise appearance features. Next, we introduce a graph neural network to further model the inter-LN relationships where the global LN-tumor spatial priors are included in the learning process. This leads to an end-to-end trainable network to detect by classifying GTV$_{LN}$. We operate our model on a set of GTV$_{LN}$ candidates generated by a preliminary 1st-stage method, which has a sensitivity of $>85\%$ at the cost of high false positive (FP) ($>15$ FPs per patient). We validate our approach on a radiotherapy dataset with 142 paired PET/RTCT scans containing the chest and upper abdominal body parts. The proposed method significantly improves over the state-of-the-art (SOTA) LN classification method by $5.5\%$ and $13.1\%$ in F1 score and the averaged sensitivity value at $2, 3, 4, 6$ FPs per patient, respectively.
AI Key Findings
Get AI-generated insights about this paper's methodology, results, significance, and more — seven facets brought into focus.
Impact
Paper Details
Authors
PDF Preview
Key Terms
Citation Network
Current paper (gray), citations (green), references (blue)
Display is limited for performance on very large graphs.
Discussion 0