MapIQ: Benchmarking Multimodal Large Language Models for Map Question Answering
Publication
Metrics
Paper Preview
Abstract
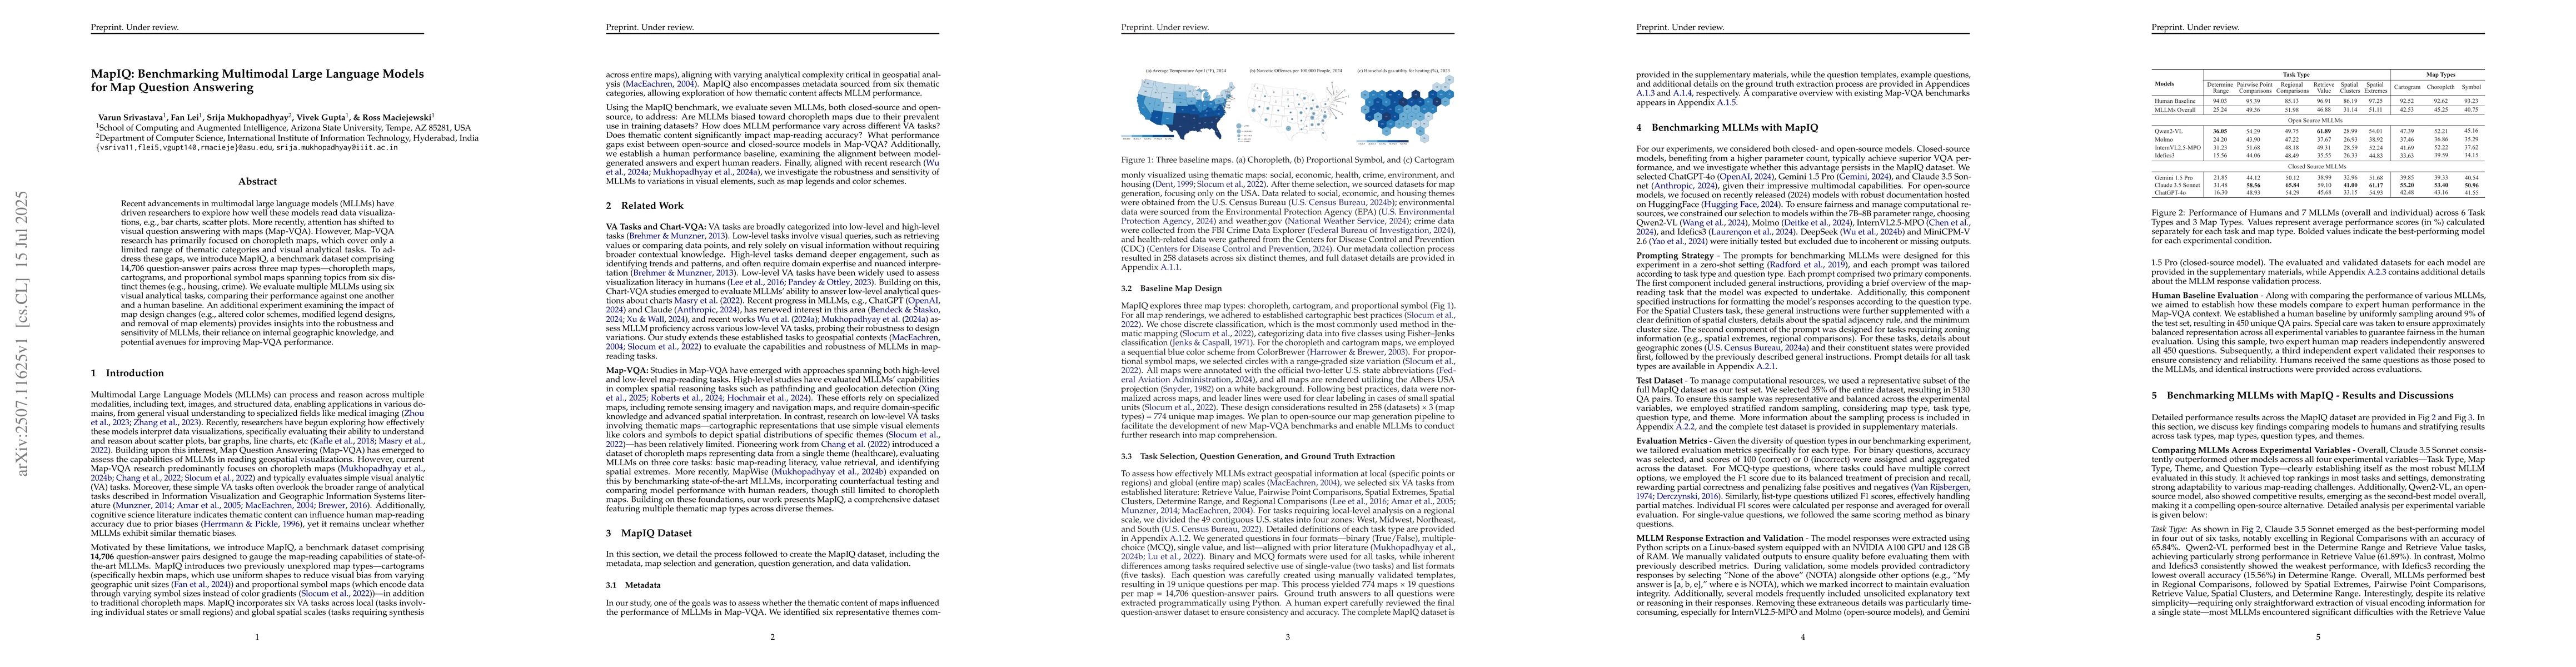
Recent advancements in multimodal large language models (MLLMs) have driven researchers to explore how well these models read data visualizations, e.g., bar charts, scatter plots. More recently, attention has shifted to visual question answering with maps (Map-VQA). However, Map-VQA research has primarily focused on choropleth maps, which cover only a limited range of thematic categories and visual analytical tasks. To address these gaps, we introduce MapIQ, a benchmark dataset comprising 14,706 question-answer pairs across three map types: choropleth maps, cartograms, and proportional symbol maps spanning topics from six distinct themes (e.g., housing, crime). We evaluate multiple MLLMs using six visual analytical tasks, comparing their performance against one another and a human baseline. An additional experiment examining the impact of map design changes (e.g., altered color schemes, modified legend designs, and removal of map elements) provides insights into the robustness and sensitivity of MLLMs, their reliance on internal geographic knowledge, and potential avenues for improving Map-VQA performance.
AI Key Findings
Get AI-generated insights about this paper's methodology, results, significance, and more — seven facets brought into focus.
Impact
Paper Details
Authors
PDF Preview
Citation Network
Current paper (gray), citations (green), references (blue)
Display is limited for performance on very large graphs.
Discussion 0