Publication
Metrics
AI Quick Summary
This paper develops a statistical modelling framework to map malaria seasonality directly from case data in Madagascar, using a spatiotemporal regression model to estimate monthly case proportions and an algorithm to identify transmission start and peak months. The approach also presents uncertainty estimates, enhancing the reliability of the seasonality index for policymaking.
Paper Preview
Abstract
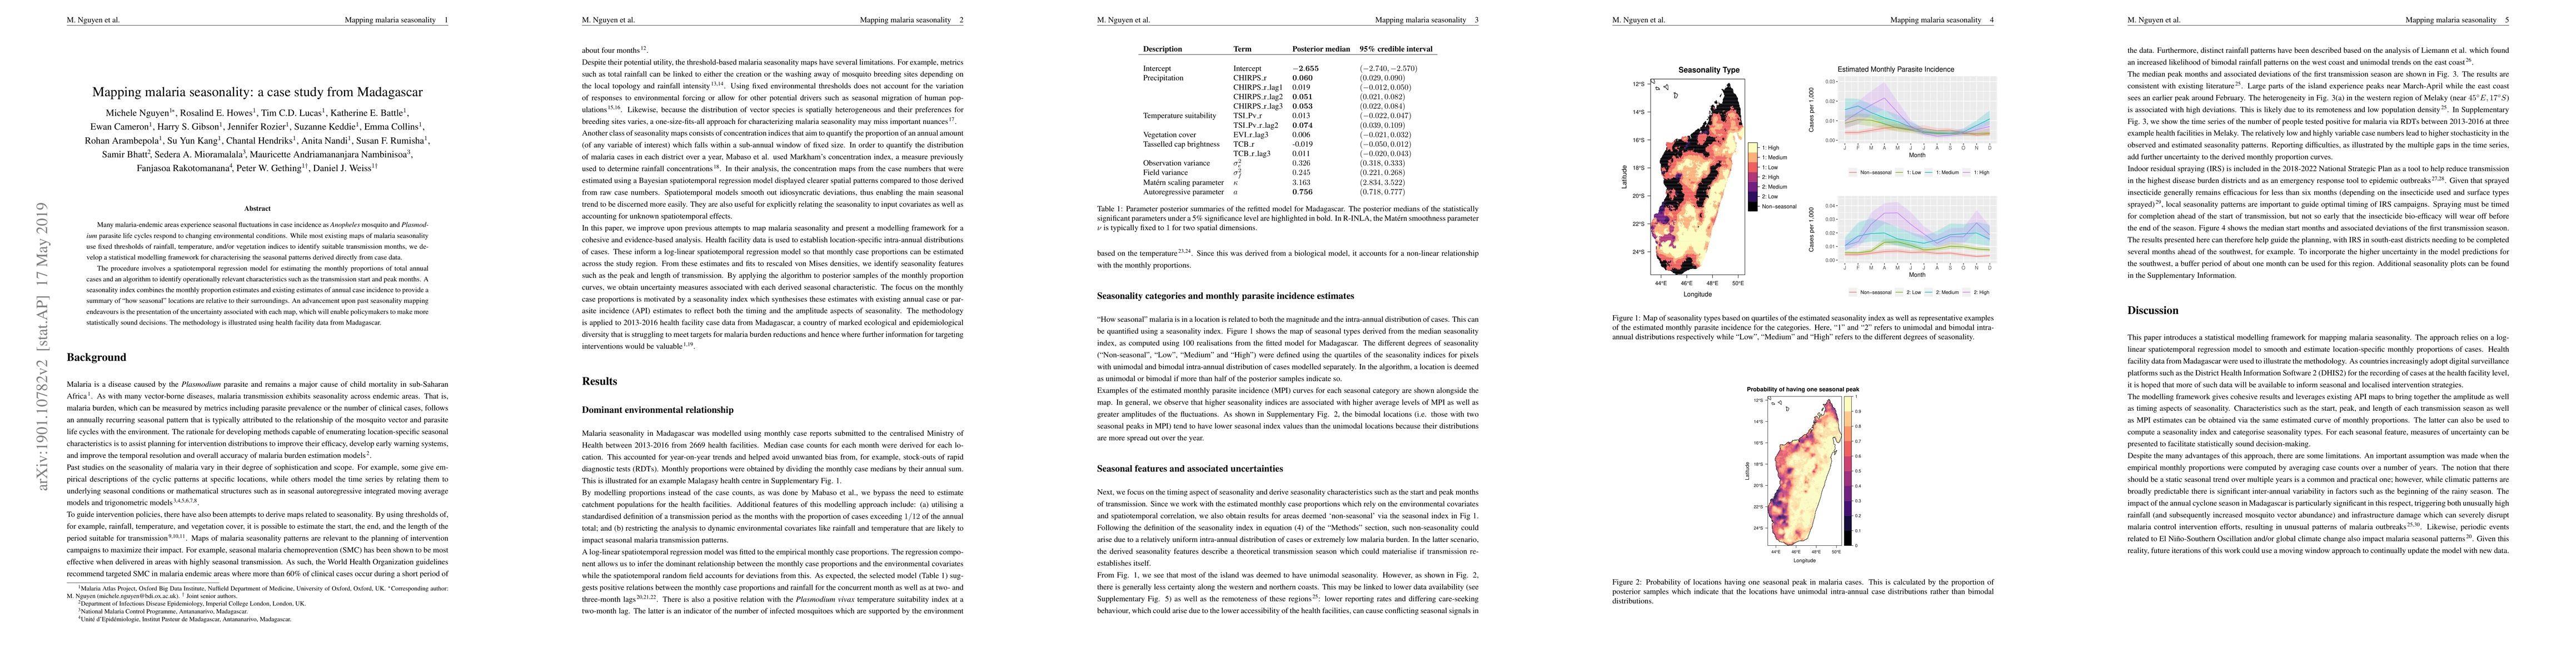
Many malaria-endemic areas experience seasonal fluctuations in case incidence as Anopheles mosquito and Plasmodium parasite life cycles respond to changing environmental conditions. While most existing maps of malaria seasonality use fixed thresholds of rainfall, temperature, and/or vegetation indices to identify suitable transmission months, we develop a statistical modelling framework for characterising the seasonal patterns derived directly from case data. The procedure involves a spatiotemporal regression model for estimating the monthly proportions of total annual cases and an algorithm to identify operationally relevant characteristics such as the transmission start and peak months. A seasonality index combines the monthly proportion estimates and existing estimates of annual case incidence to provide a summary of "how seasonal" locations are relative to their surroundings. An advancement upon past seasonality mapping endeavours is the presentation of the uncertainty associated with each map, which will enable policymakers to make more statistically sound decisions. The methodology is illustrated using health facility data from Madagascar.
AI Key Findings
Get AI-generated insights about this paper's methodology, results, significance, and more — seven facets brought into focus.
Impact
Paper Details
Authors
PDF Preview
Key Terms
Citation Network
Current paper (gray), citations (green), references (blue)
Display is limited for performance on very large graphs.
Discussion 0