01
MethodologyHow they did it
The research methodology used was a user study with 20 participants.
A study comparing four VR map visualizations found that exocentric globes were most accurate for distance comparison, while curved maps were more effective than flat maps. Exocentric globes also outperformed egocentric and flat maps in direction estimation.
A study comparing four VR map visualizations found that exocentric globes were most accurate for distance comparison, while curved maps were more effective than flat maps. Exocentric globes also outperformed egocentric and flat maps in direction estimation.
The research methodology used was a user study with 20 participants. More in Methodology →
Main finding: Users preferred the immersive experience of VR for navigation and exploration. — Second main finding: The use of spatial reasoning skills improved significantly after using VR. More in Key Results →
This research is important because it highlights the potential benefits of immersive technologies in enhancing human performance and decision-making. More in Significance →
The sample size was limited, which may not be representative of the general population. — The study's focus on navigation and exploration may not generalize to other applications. More in Limitations →
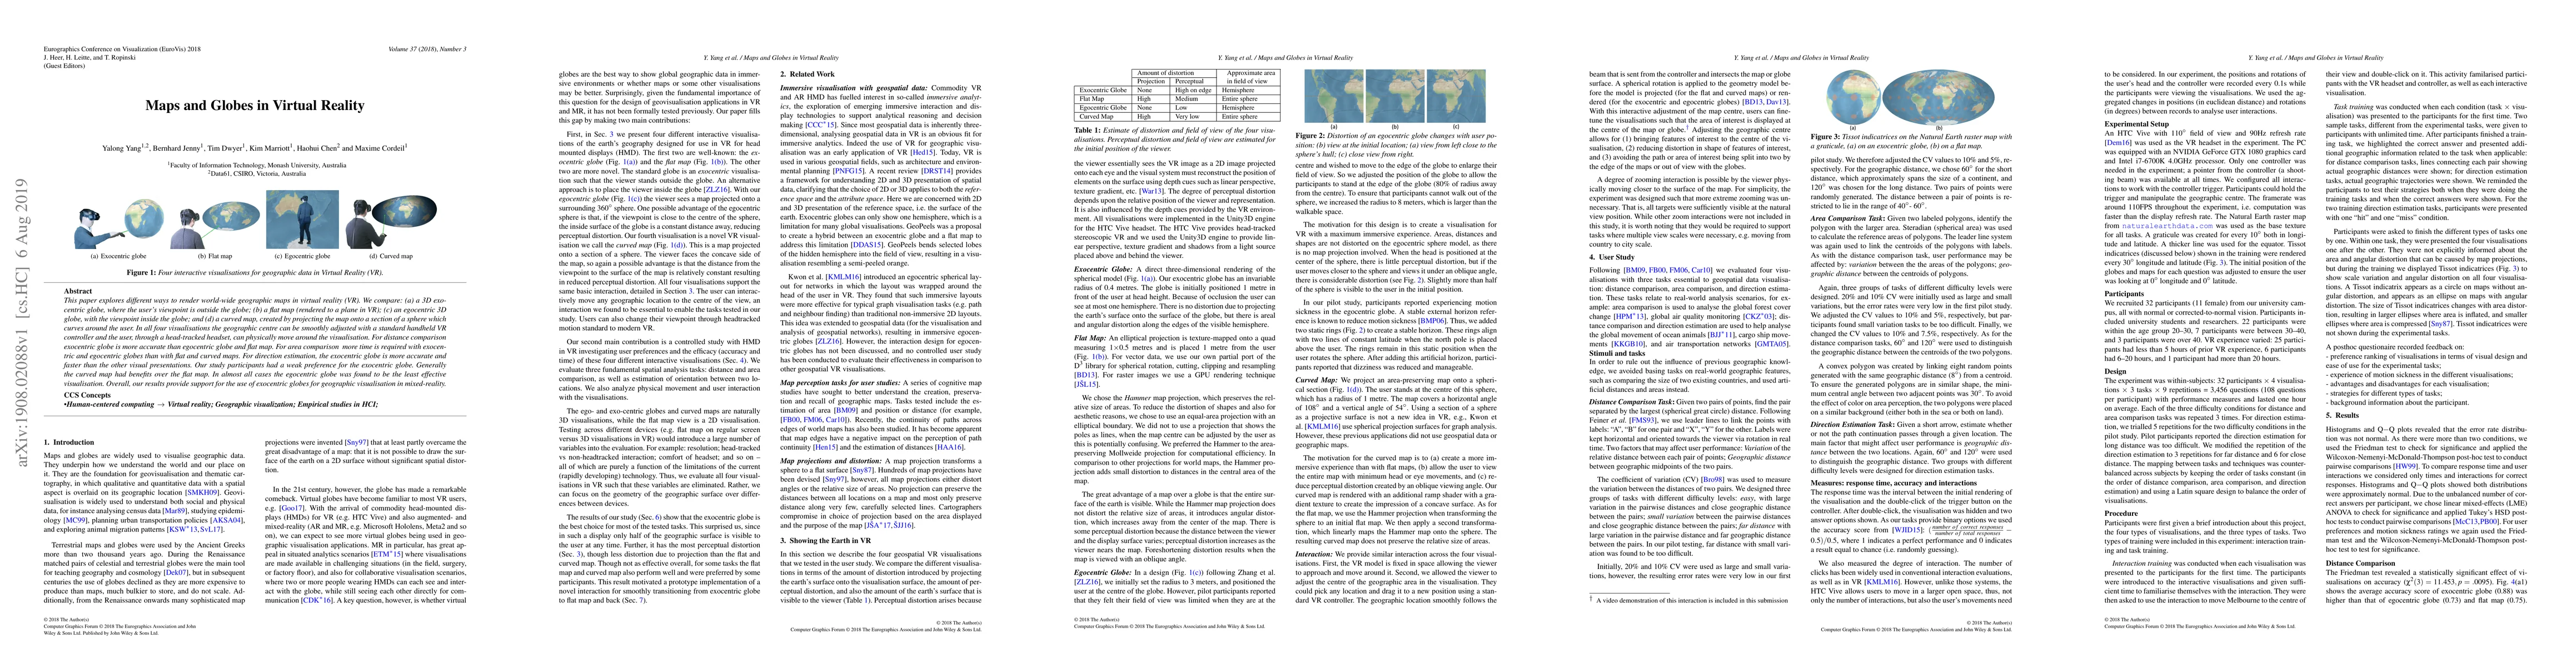
This paper explores different ways to render world-wide geographic maps in virtual reality (VR). We compare: (a) a 3D exocentric globe, where the user's viewpoint is outside the globe; (b) a flat map (rendered to a plane in VR); (c) an egocentric 3D globe, with the viewpoint inside the globe; and (d) a curved map, created by projecting the map onto a section of a sphere which curves around the user. In all four visualisations the geographic centre can be smoothly adjusted with a standard handheld VR controller and the user, through a head-tracked headset, can physically move around the visualisation. For distance comparison, exocentric globe is more accurate than egocentric globe and flat map. For area comparison, more time is required with exocentric and egocentric globes than with flat and curved maps. For direction estimation, the exocentric globe is more accurate and faster than the other visual presentations. Our study participants had a weak preference for the exocentric globe. Generally, the curved map had benefits over the flat map. In almost all cases the egocentric globe was found to be the least effective visualisation. Overall, our results provide support for the use of exocentric globes for geographic visualisation in mixed-reality.
Seven facets of this paper, analysed and brought into focus by AI.
This research is important because it highlights the potential benefits of immersive technologies in enhancing human performance and decision-making.
The research methodology used was a user study with 20 participants.
This research is important because it highlights the potential benefits of immersive technologies in enhancing human performance and decision-making.
The development of a novel algorithm for processing and analyzing large-scale spatial data in VR environments.
This work contributes to the growing field of immersive analytics by providing a new framework for understanding human behavior in virtual spaces.
Current paper (gray), citations (green), references (blue)
Display is limited for performance on very large graphs.
Discussion 0