Summary

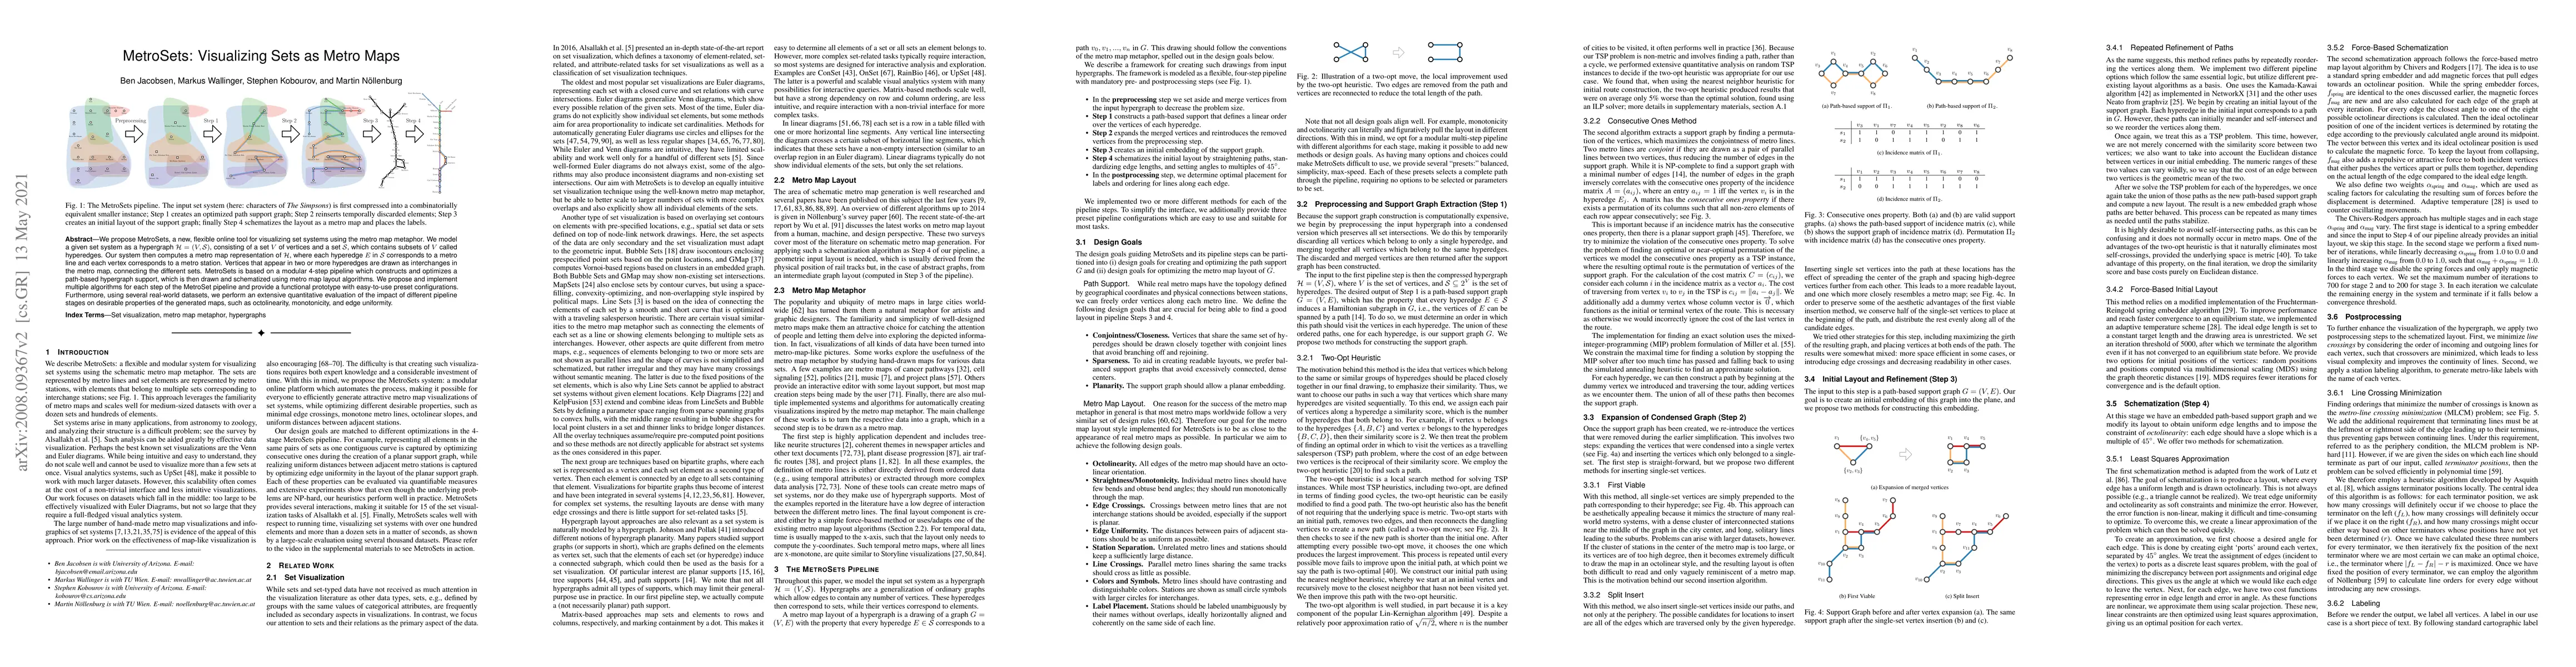
We propose MetroSets, a new, flexible online tool for visualizing set systems using the metro map metaphor. We model a given set system as a hypergraph $\mathcal{H} = (V, \mathcal{S})$, consisting of a set $V$ of vertices and a set $\mathcal{S}$, which contains subsets of $V$ called hyperedges. Our system then computes a metro map representation of $\mathcal{H}$, where each hyperedge $E$ in $\mathcal{S}$ corresponds to a metro line and each vertex corresponds to a metro station. Vertices that appear in two or more hyperedges are drawn as interchanges in the metro map, connecting the different sets. MetroSets is based on a modular 4-step pipeline which constructs and optimizes a path-based hypergraph support, which is then drawn and schematized using metro map layout algorithms. We propose and implement multiple algorithms for each step of the MetroSet pipeline and provide a functional prototype with easy-to-use preset configurations. Furthermore, using several real-world datasets, we perform an extensive quantitative evaluation of the impact of different pipeline stages on desirable properties of the generated maps, such as octolinearity, monotonicity, and edge uniformity.

AI Key Findings

Generated Sep 02, 2025

Methodology

The research introduces MetroSets, a flexible online tool for visualizing set systems using metro map metaphor. It models a given set system as a hypergraph and computes a metro map representation, optimizing a path-based hypergraph support with metro map layout algorithms.

Key Results

  • MetroSets' running time is most strongly influenced by the number of vertices.
  • For most metrics, the number of hyperedges is the most important factor.
  • The choice of support or insertion does not have a large effect on the final score, and the impact of the schematization algorithm is limited to octolinearity and edge uniformity.

Significance

MetroSets provides a novel, efficient way to visualize complex set systems, aiding in the analysis of large datasets with numerous intersecting sets.

Technical Contribution

MetroSets presents a modular 4-step pipeline for visualizing set systems, along with multiple algorithms for each step, optimizing various design goals such as octolinearity, monotonicity, and edge uniformity.

Novelty

MetroSets distinguishes itself by applying the metro map metaphor to set visualization, providing an intuitive and flexible method for representing complex set systems.

Limitations

  • The system's quadratic runtime limits its practical use in the online setting to inputs with no more than 200 vertices and 20 hyperedges.
  • MetroSets cannot handle multiple disconnected components or single-vertex sets.

Future Work

  • Further investigation into reducing the quadratic runtime for larger datasets.
  • Exploration of handling multiple disconnected components and single-vertex sets.

Paper Details

PDF Preview

Download PDF

Key Terms

mathcal (0.276)
pipeline (0.269)
map (0.245)
drawn (0.231)
corresponds (0.202)
vertices (0.198)
set (0.175)
step (0.164)

Citation Network

Current paper (gray), citations (green), references (blue)

Display is limited for performance on very large graphs.

Current Paper
Citations
References
Click to view
Title Authors Year Actions

Comments (0)

This website uses cookies to ensure you get the best experience. Learn more