Traditionally, most schematic metro maps in practice as well as metro map
layout algorithms adhere to an octolinear layout style with all paths composed
of horizontal, vertical, and 45{\deg}-diagonal edges. Despite growing interest
in more general multilinear metro maps, generic algorithms to draw metro maps
based on a system of $k \ge 2$ not necessarily equidistant slopes have not been
investigated thoroughly. In this paper we present and implement an adaptation
of the octolinear mixed-integer linear programming approach of N\"ollenburg and
Wolff (2011) that can draw metro maps schematized to any set C of arbitrary
orientations. We further present a data-driven approach to determine a suitable
set C by either detecting the best rotation of an equidistant orientation
system or by clustering the input edge orientations using a k-means algorithm.
We demonstrate the new possibilities of our method using several real-world
examples.
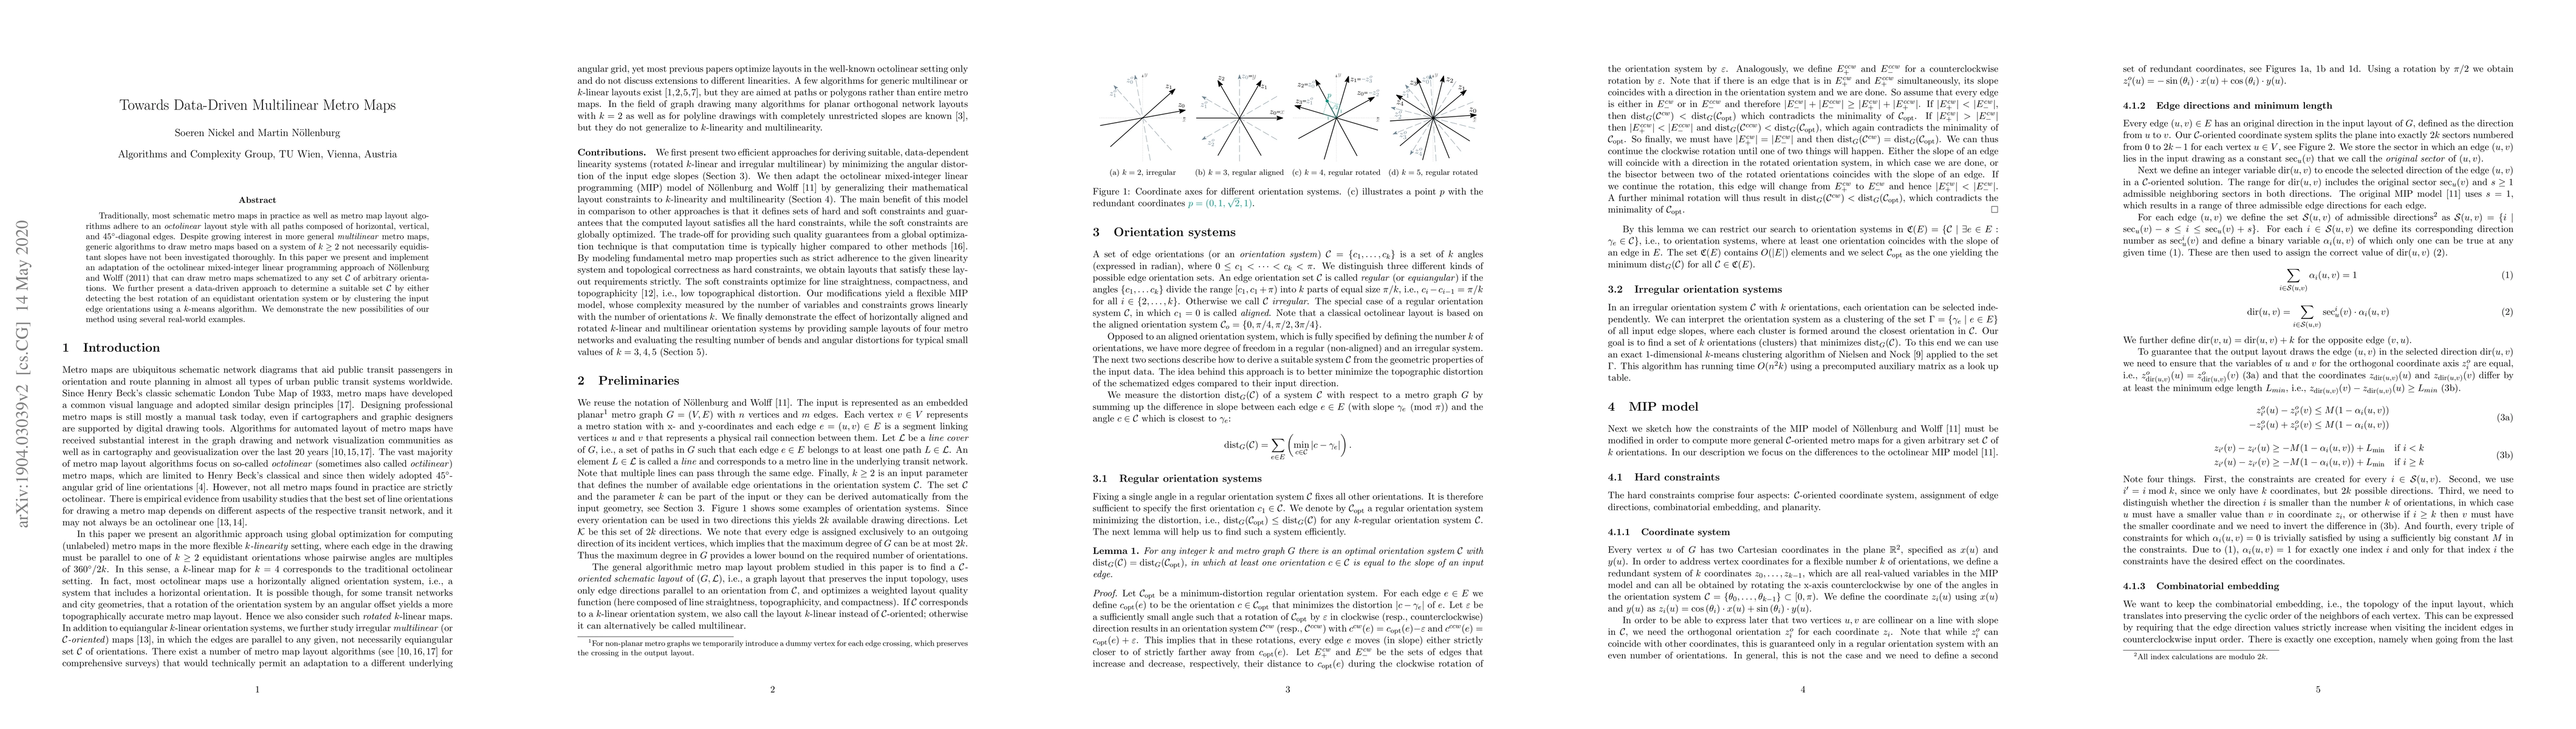
Discussion 0