Publication
Metrics
AI Quick Summary
This paper explores portfolio optimization under convex constraints within Heston's stochastic volatility model, deriving a closed-form solution using duality methods. It finds that constraints affect portfolio allocation differently compared to the Black-Scholes model, often resulting in a different optimal constrained portfolio than a naive capped version of the unconstrained portfolio, though the latter usually incurs minimal losses except during financial crises.
Paper Preview
Abstract
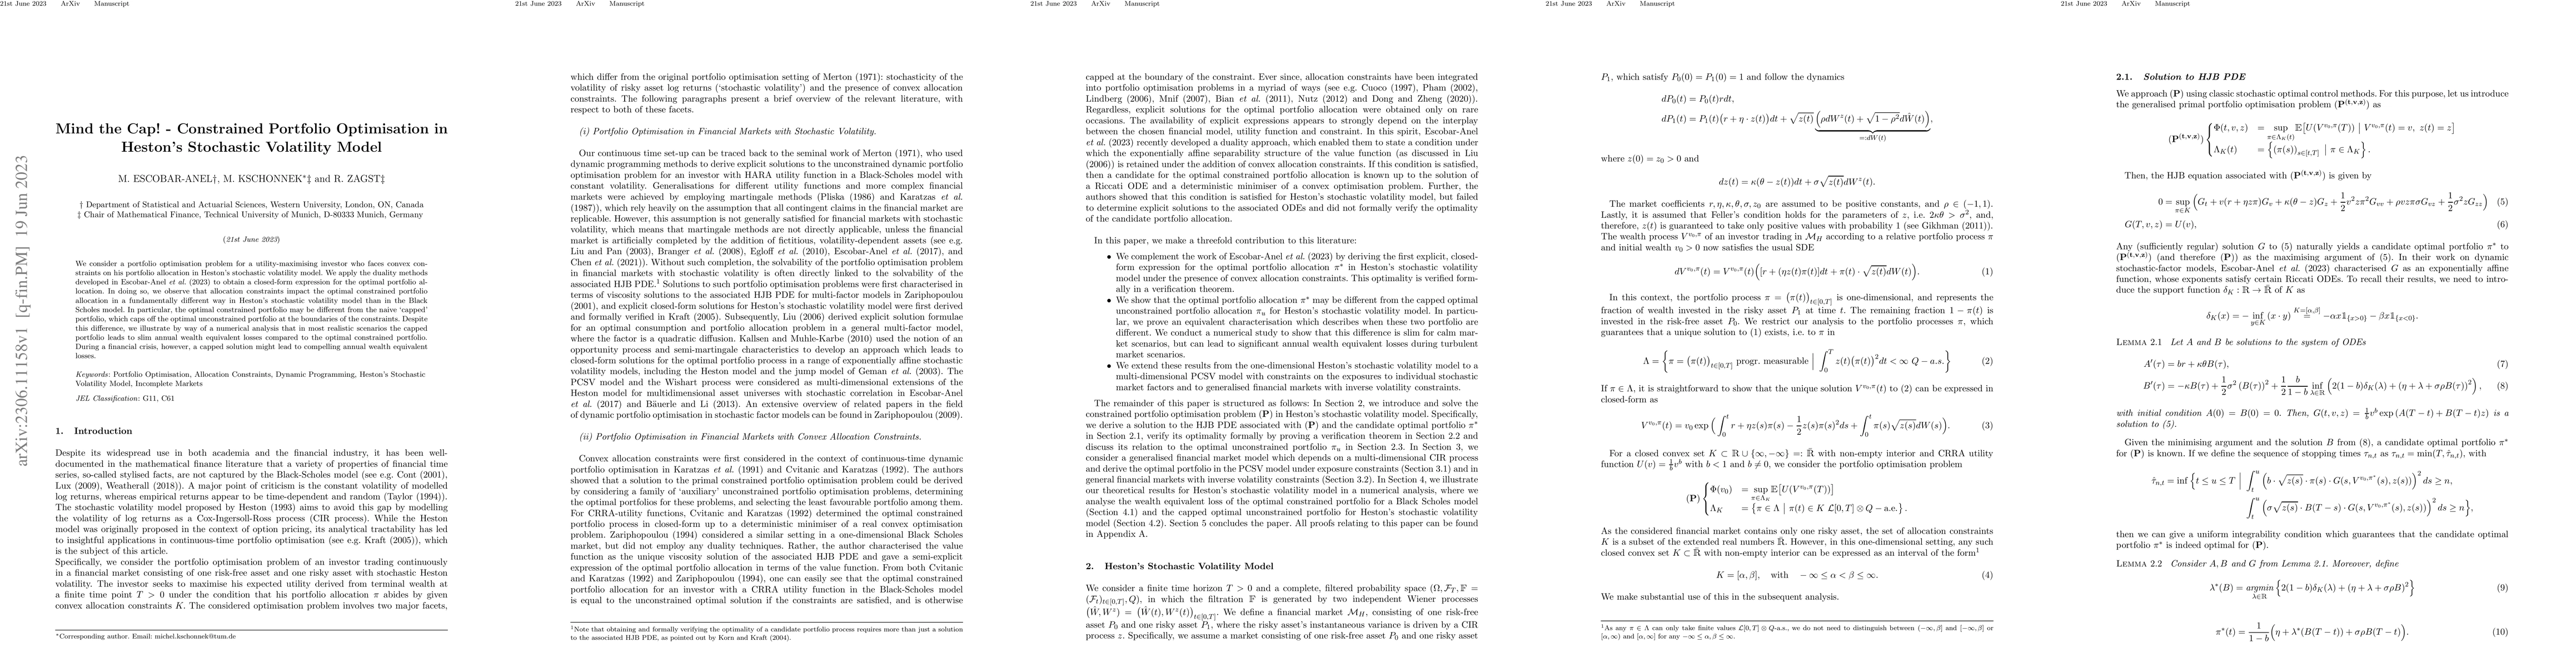
We consider a portfolio optimisation problem for a utility-maximising investor who faces convex constraints on his portfolio allocation in Heston's stochastic volatility model. We apply the duality methods developed in previous work to obtain a closed-form expression for the optimal portfolio allocation. In doing so, we observe that allocation constraints impact the optimal constrained portfolio allocation in a fundamentally different way in Heston's stochastic volatility model than in the Black Scholes model. In particular, the optimal constrained portfolio may be different from the naive capped portfolio, which caps off the optimal unconstrained portfolio at the boundaries of the constraints. Despite this difference, we illustrate by way of a numerical analysis that in most realistic scenarios the capped portfolio leads to slim annual wealth equivalent losses compared to the optimal constrained portfolio. During a financial crisis, however, a capped solution might lead to compelling annual wealth equivalent losses.
AI Key Findings
Get AI-generated insights about this paper's methodology, results, significance, and more — seven facets brought into focus.
Impact
Paper Details
Authors
PDF Preview
Key Terms
Citation Network
Current paper (gray), citations (green), references (blue)
Display is limited for performance on very large graphs.
Discussion 0