Publication
Metrics
AI Quick Summary
The paper introduces the model-based ROC (mROC) curve to assess model calibration in risk prediction models, showing that it can visually evaluate the effect of case-mix and model miscalibration. A novel statistical test for calibration is proposed, supported by simulations, and a case study demonstrates its practical application.
Paper Preview
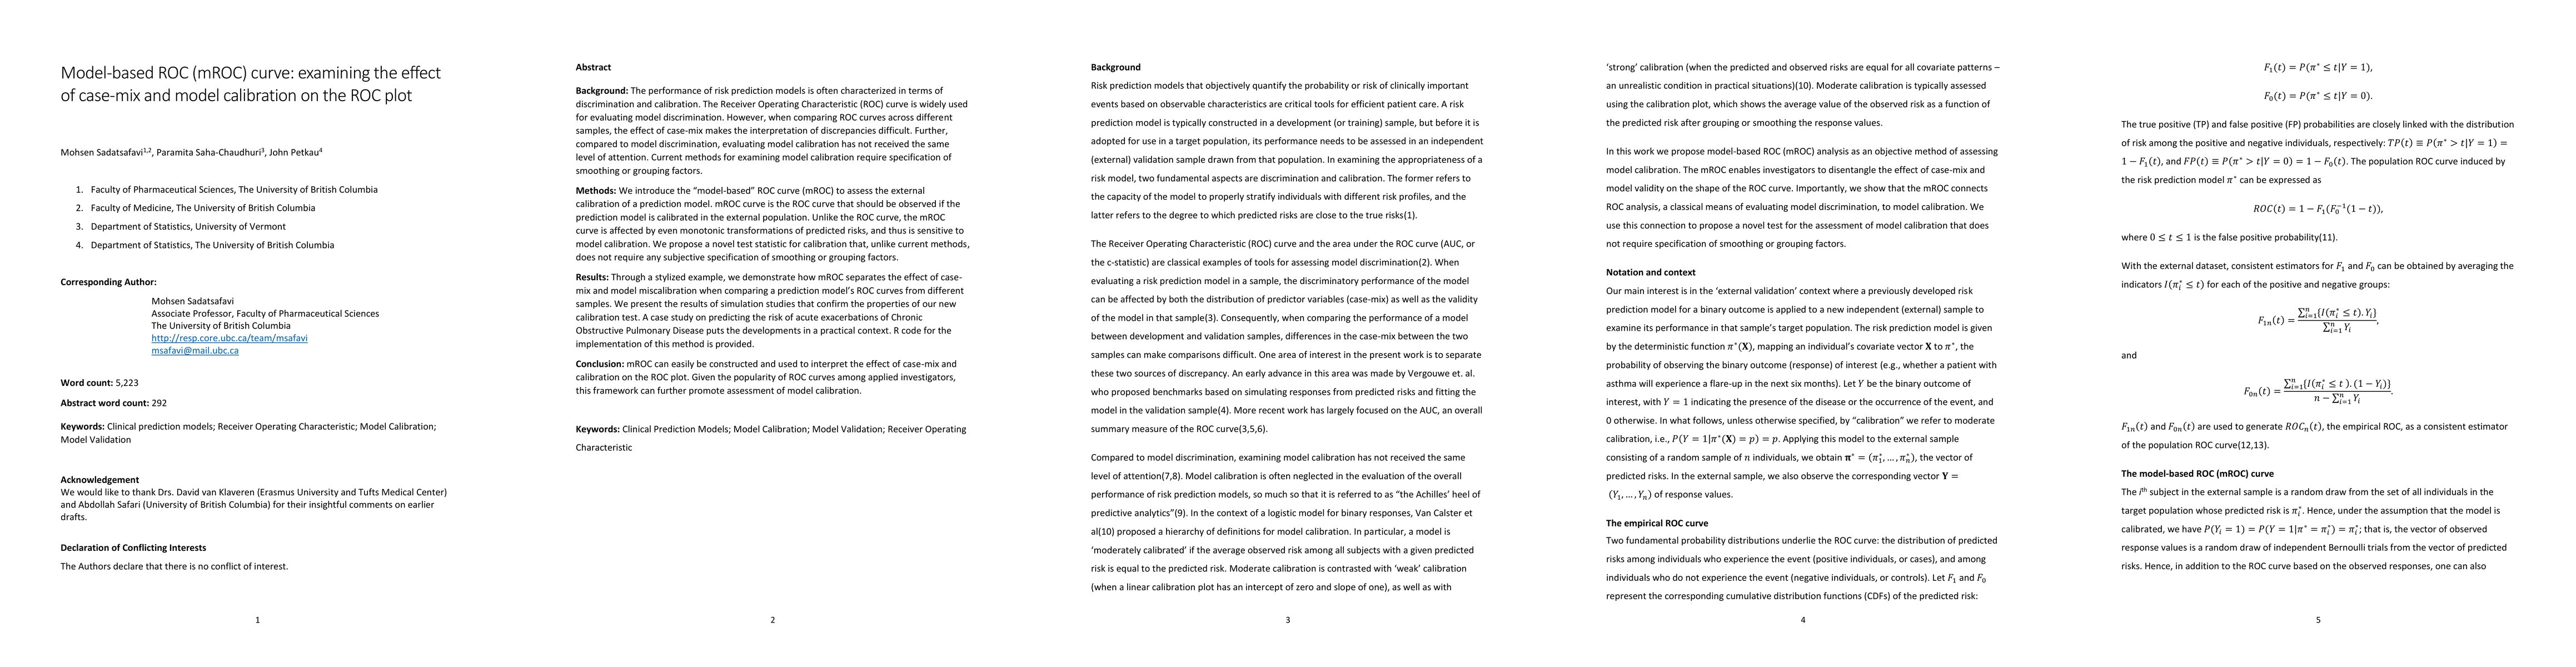
Abstract
The performance of risk prediction models is often characterized in terms of discrimination and calibration. The Receiver Operating Characteristic (ROC) curve is widely used for evaluating model discrimination. When evaluating the performance of a risk prediction model in a new sample, the shape of the ROC curve is affected by both case-mix and the postulated model. Further, compared to discrimination, evaluating calibration has not received the same level of attention. Commonly used methods for model calibration involve subjective specification of smoothing or grouping. Leveraging the familiar ROC framework, we introduce the model-based ROC (mROC) curve to assess the calibration of a pre-specified model in a new sample. mROC curve is the ROC curve that should be observed if a pre-specified model is calibrated in the sample. We show the empirical ROC and mROC curves for a sample converge asymptotically if the model is calibrated in that sample. As a consequence, the mROC curve can be used to assess visually the effect of case-mix and model mis-calibration. Further, we propose a novel statistical test for calibration that does not require any smoothing or grouping. Simulations support the adequacy of the test. A case study puts these developments in a practical context. We conclude that mROC can easily be constructed and used to evaluate the effect of case-mix and model calibration on the ROC plot, thus adding to the utility of ROC curve analysis in the evaluation of risk prediction models. R code for the proposed methodology is provided (https://github.com/msadatsafavi/mROC/).
AI Key Findings
Get AI-generated insights about this paper's methodology, results, significance, and more — seven facets brought into focus.
Impact
Paper Details
PDF Preview
Key Terms
Citation Network
Current paper (gray), citations (green), references (blue)
Display is limited for performance on very large graphs.
Discussion 0