Publication
Metrics
AI Quick Summary
The STONE curve is a new model validation tool based on the ROC curve technique, designed to assess the performance of numerical models by sliding thresholds simultaneously for both observational and model data. Unlike traditional ROC curves, the STONE curve can reveal asymmetries in data-model value pairs through its nonmonotonic, rippled pattern.
Paper Preview
Abstract
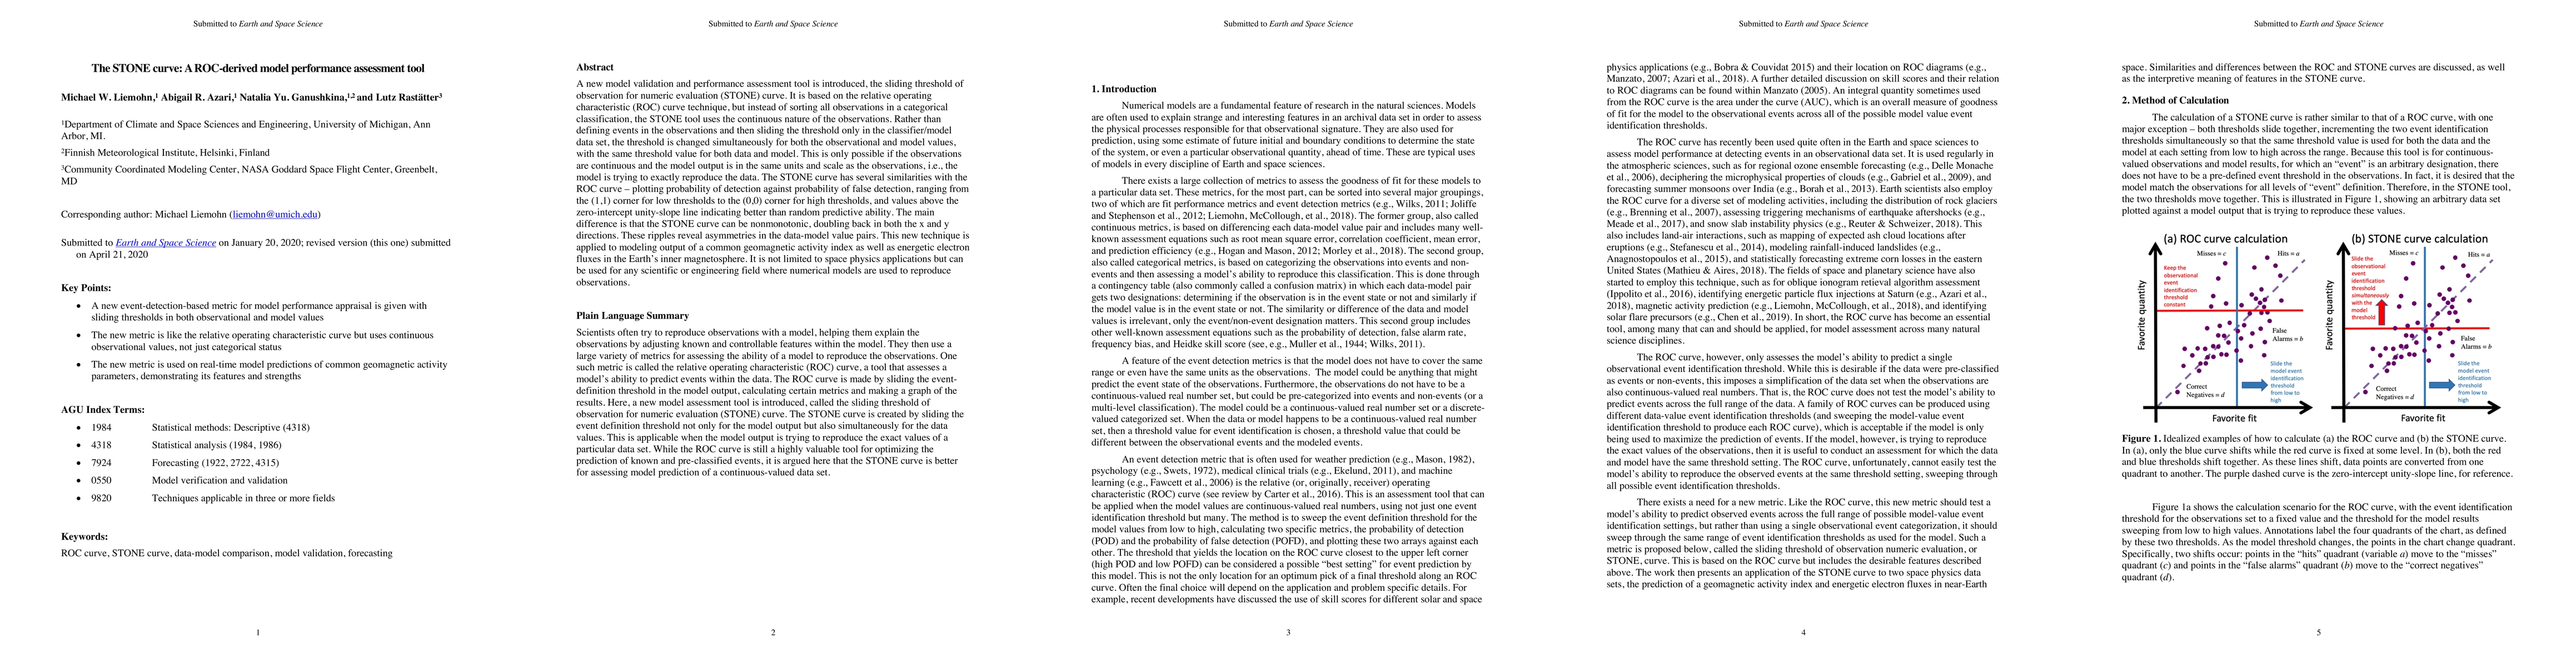
A new model validation and performance assessment tool is introduced, the sliding threshold of observation for numeric evaluation (STONE) curve. It is based on the relative operating characteristic (ROC) curve technique, but instead of sorting all observations in a categorical classification, the STONE tool uses the continuous nature of the observations. Rather than defining events in the observations and then sliding the threshold only in the classifier (model) data set, the threshold is changed simultaneously for both the observational and model values, with the same threshold value for both data and model. This is only possible if the observations are continuous and the model output is in the same units and scale as the observations, that is, the model is trying to exactly reproduce the data. The STONE curve has several similarities with the ROC curve, plotting probability of detection against probability of false detection, ranging from the (1,1) corner for low thresholds to the (0,0) corner for high thresholds, and values above the zero-intercept unity-slope line indicating better than random predictive ability. The main difference is that the STONE curve can be nonmonotonic, doubling back in both the x and y directions. These ripples reveal asymmetries in the data-model value pairs. This new technique is applied to modeling output of a common geomagnetic activity index as well as energetic electron fluxes in the Earth's inner magnetosphere. It is not limited to space physics applications but can be used for any scientific or engineering field where numerical models are used to reproduce observations.
AI Key Findings
Get AI-generated insights about this paper's methodology, results, significance, and more — seven facets brought into focus.
Impact
Paper Details
Authors
PDF Preview
Key Terms
Citation Network
Current paper (gray), citations (green), references (blue)
Display is limited for performance on very large graphs.
Discussion 0