Publication
Metrics
AI Quick Summary
This paper develops an index for discriminating between populations using functional data and constructs ROC curves to evaluate it. It proposes a quadratic discrimination rule for cases with different covariance operators, showing its advantages through numerical experiments and real data analysis.
Paper Preview
Abstract
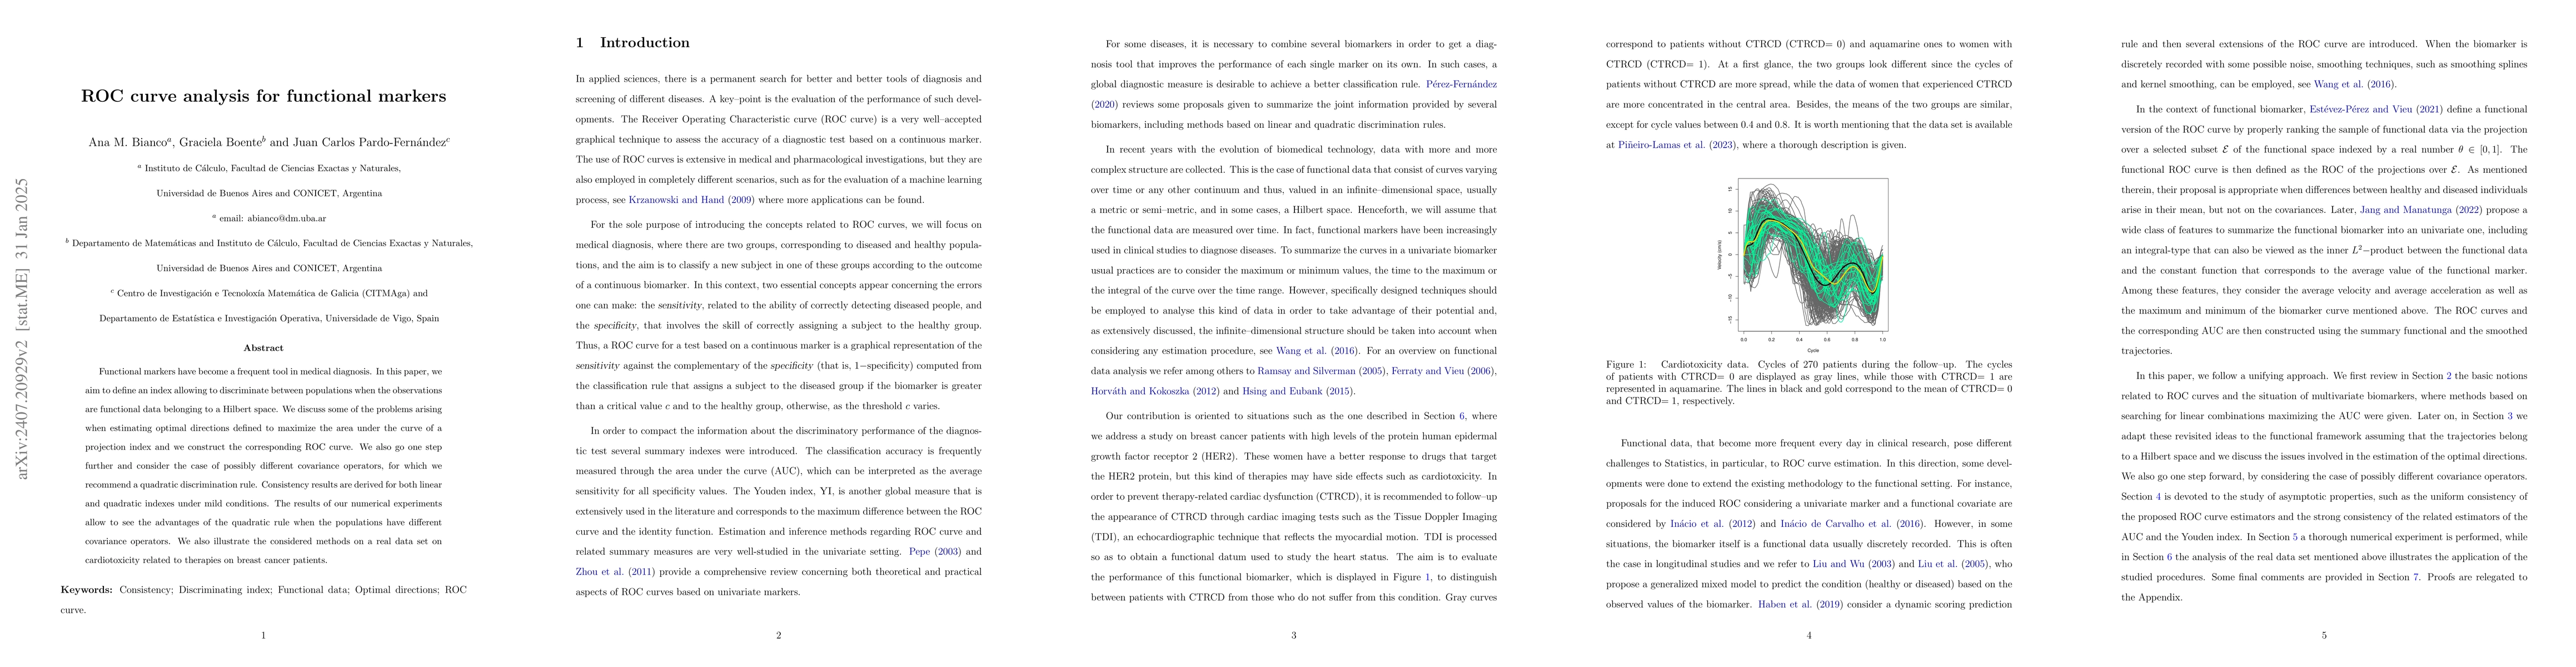
Functional markers become a more frequent tool in medical diagnosis. In this paper, we aim to define an index allowing to discriminate between populations when the observations are functional data belonging to a Hilbert space. We discuss some of the problems arising when estimating optimal directions defined to maximize the area under the curve of a projection index and we construct the corresponding ROC curve. We also go one step forward and consider the case of possibly different covariance operators, for which we recommend a quadratic discrimination rule. Consistency results are derived for both linear and quadratic indexes, under mild conditions. The results of our numerical experiments allow to see the advantages of the quadratic rule when the populations have different covariance operators. We also illustrate the considered methods on a real data set.
AI Key Findings
Get AI-generated insights about this paper's methodology, results, significance, and more — seven facets brought into focus.
Authors
PDF Preview
Related Papers
No references found for this paper.
Discussion 0