Modelling the Spoon IRS diagnostic diagram
Publication
Metrics
Paper Preview
Abstract
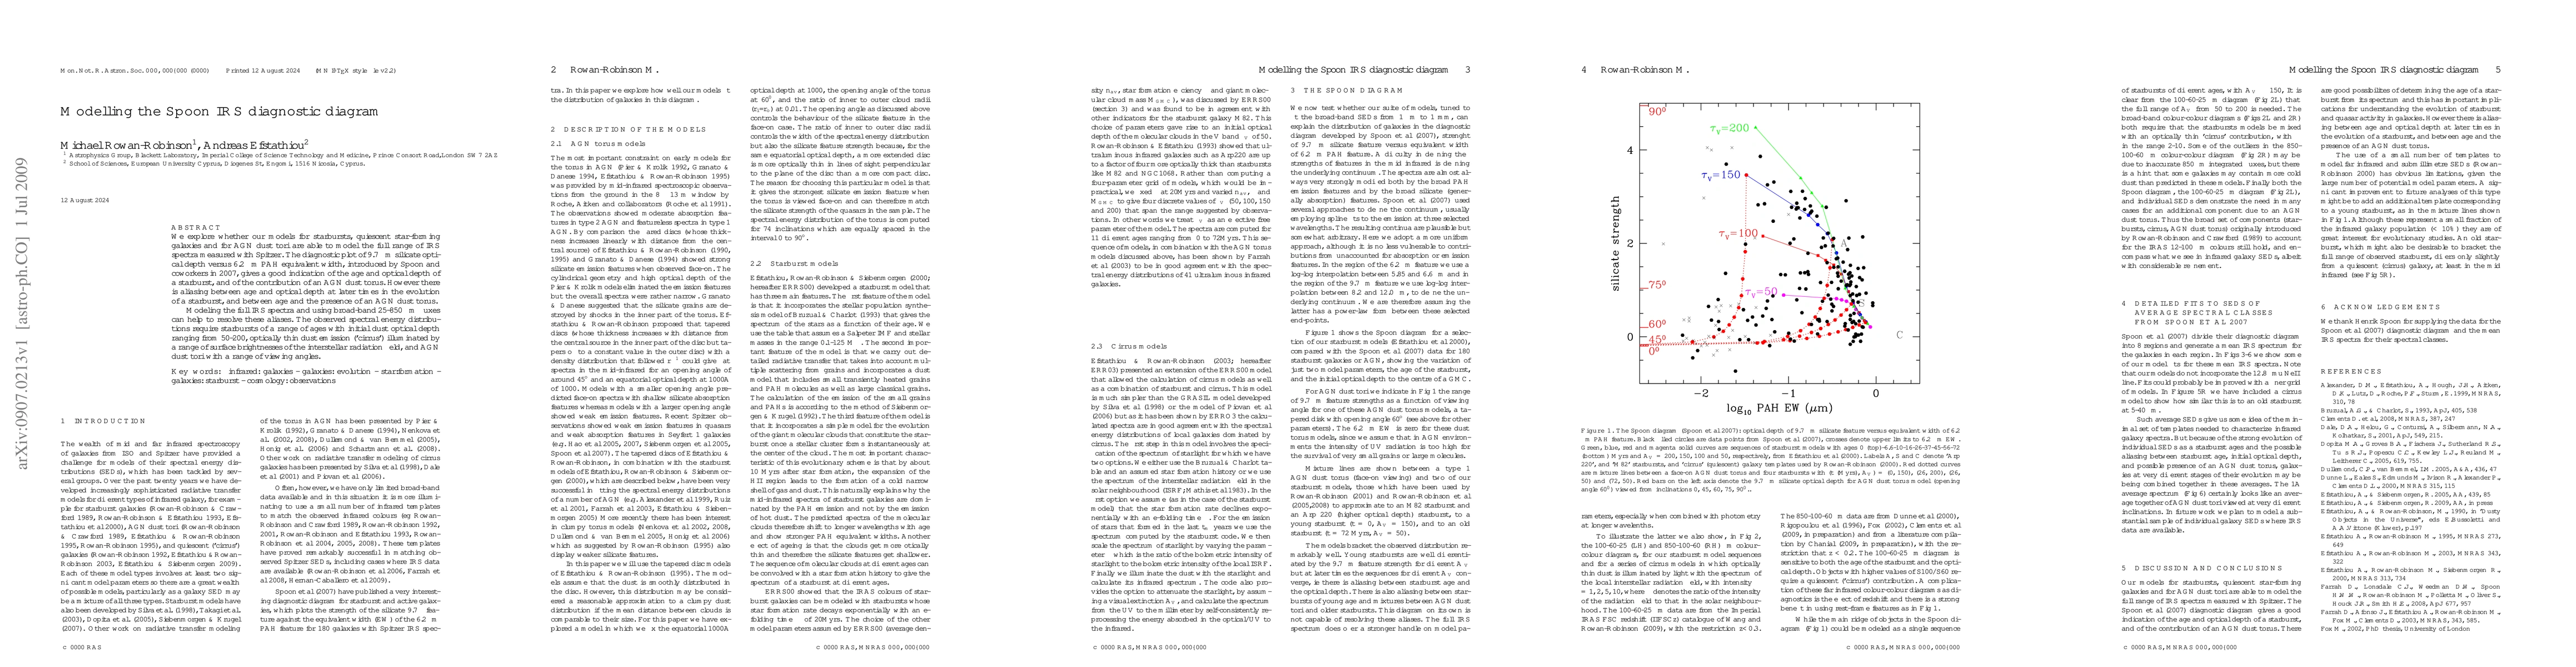
We explore whether our models for starbursts, quiescent star-forming galaxies and for AGN dust tori are able to model the full range of IRS spectra measured with Spitzer. The diagnostic plot of 9.7 mu silicate optical depth versus 6.2 mu PAH equivalent width, introduced by Spoon and coworkers in 2007, gives a good indication of the age and optical depth of a starburst, and of the contribution of an AGN dust torus. However there is aliasing between age and optical depth at later times in the evolution of a starburst, and between age and the presence of an AGN dust torus. Modeling the full IRS spectra and using broad-band 25-850 mu fluxes can help to resolve these aliases. The observed spectral energy distributions require starbursts of a range of ages with initial dust optical depth ranging from 50-200, optically thin dust emission ('cirrus') illuminated by a range of surface brightnesses of the interstellar radiation field, and AGN dust tori with a range of viewing angles.
AI Key Findings
Get AI-generated insights about this paper's methodology, results, significance, and more — seven facets brought into focus.
Impact
Paper Details
PDF Preview
Key Terms
Citation Network
Current paper (gray), citations (green), references (blue)
Display is limited for performance on very large graphs.
Discussion 0