This research investigates how motion-based visual encoding enhances performance on perceptual tasks involving dynamic time series. The study finds that techniques such as staging animations and tracing object movements improve task performance and reduce cognitive load, especially when encoding animation speed with mean and variance.
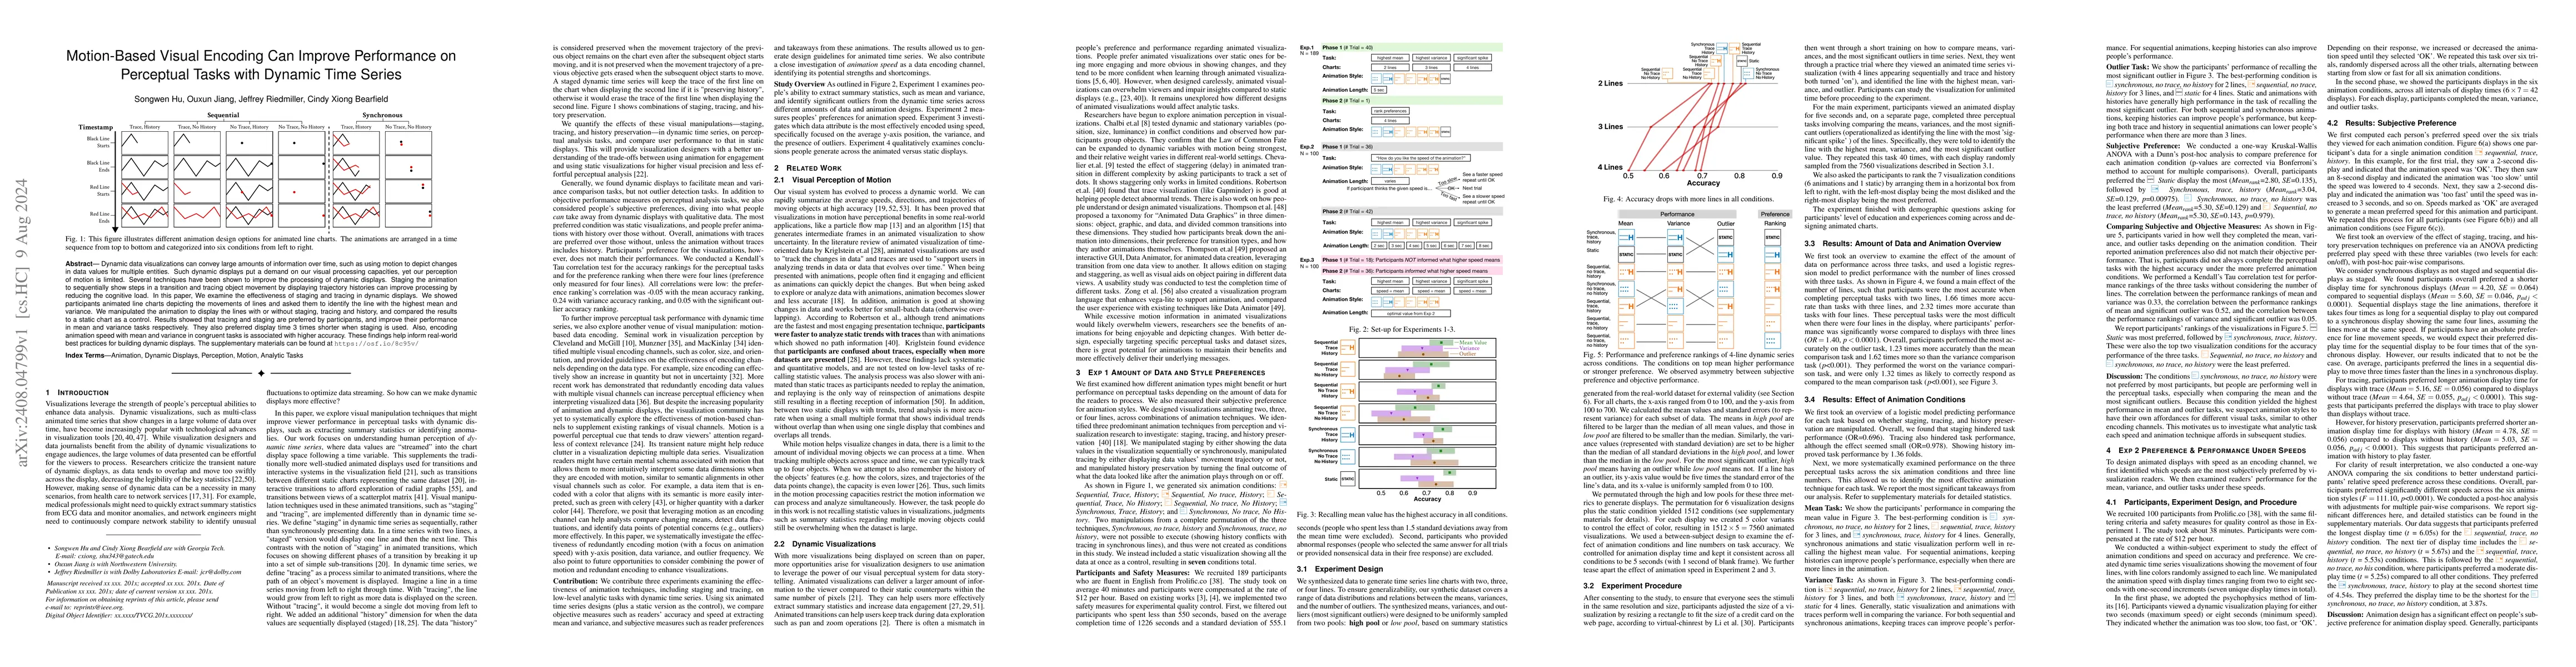
Dynamic data visualizations can convey large amounts of information over time, such as using motion to depict changes in data values for multiple entities. Such dynamic displays put a demand on our visual processing capacities, yet our perception of motion is limited. Several techniques have been shown to improve the processing of dynamic displays. Staging the animation to sequentially show steps in a transition and tracing object movement by displaying trajectory histories can improve processing by reducing the cognitive load. In this paper, We examine the effectiveness of staging and tracing in dynamic displays. We showed participants animated line charts depicting the movements of lines and asked them to identify the line with the highest mean and variance. We manipulated the animation to display the lines with or without staging, tracing and history, and compared the results to a static chart as a control. Results showed that tracing and staging are preferred by participants, and improve their performance in mean and variance tasks respectively. They also preferred display time 3 times shorter when staging is used. Also, encoding animation speed with mean and variance in congruent tasks is associated with higher accuracy. These findings help inform real-world best practices for building dynamic displays. The supplementary materials can be found at https://osf.io/8c95v/
Get AI-generated insights about this paper's methodology, results, and significance.
Current paper (gray), citations (green), references (blue)
No similar papers found for this research.
No citations found for this paper.
Title | Authors | Year | Actions |
---|---|---|---|
Comparative Evaluation of Animated Scatter Plot Transitions
|
Nils Rodrigues, Frederik L. Dennig, Vincent Brandt, D. Keim, D. Weiskopf
|
2024
|
View Paper |
Color Semantics in Human Cognition
|
Karen B. Schloss
|
2023
|
View Paper |
Data in the Wind: Evaluating Multiple-Encoding Design for Particle Motion Visualizations
|
Yiren Ding, L. Harrison
|
2023
|
View Paper |
Mini‐VLAT: A Short and Effective Measure of Visualization Literacy
|
Saugat Pandey, Alvitta Ottley
|
2023
|
View Paper |
The Risks of Ranking: Revisiting Graphical Perception to Model Individual Differences in Visualization Performance
|
Russell Davis, Xiaoying Pu, Yiren Ding, Brian D. Hall, Karen Bonilla, Mi Feng, M. Kay, Lane Harrison
|
2022
|
View Paper |
Animated Vega-Lite: Unifying Animation with a Grammar of Interactive Graphics
|
Jonathan Zong, Josh Pollock, Dylan Wootton, Arvind Satyanarayan
|
2022
|
View Paper |
Data Animator: Authoring Expressive Animated Data Graphics
|
John Thompson, Zhicheng Liu, J. Stasko
|
2021
|
View Paper |
A Design Space of Vision Science Methods for Visualization Research
|
Madison Elliott, Christine Nothelfer, Cindy Xiong, D. Szafir
|
2020
|
View Paper |
How to evaluate data visualizations across different levels of understanding
|
Alyxander Burns, Cindy Xiong, S. Franconeri, A. Cairo, Narges Mahyar
|
2020
|
View Paper |
Understanding the Design Space and Authoring Paradigms for Animated Data Graphics
|
John Thompson, Zhicheng Liu, Wilmot Li, J. Stasko
|
2020
|
View Paper |
CNN Explainer: Learning Convolutional Neural Networks with Interactive Visualization
|
Zijie J. Wang, Robert Turko, Omar Shaikh, Haekyu Park, Nilaksh Das, Fred Hohman, Minsuk Kahng, Duen Horng Chau
|
2020
|
View Paper |
Visualize Different: Towards Researching the Fit Between Taxonomy Visualizations and Taxonomy Tasks
|
Daniel Szopinski, Dennis Kundisch, Thorsten Schoormann
|
2020
|
View Paper |
Survey on Individual Differences in Visualization
|
Zhengliang Liu, R. Crouser, Alvitta Ottley
|
2020
|
View Paper |
Controlling for Participants’ Viewing Distance in Large-Scale, Psychophysical Online Experiments Using a Virtual Chinrest
|
Qisheng Li, Sung Jun Joo, J. Yeatman, Katharina Reinecke
|
2020
|
View Paper |
The Curse of Knowledge in Visual Data Communication
|
Cindy Xiong, Lisanne Van Weelden, S. Franconeri
|
2019
|
View Paper |
Common Fate for Animated Transitions in Visualization
|
Amira Chalbi, Jacob Ritchie, Deokgun Park, Jungu Choi, Nicolas Roussel, N. Elmqvist, Fanny Chevalier
|
2019
|
View Paper |
A Comparative Evaluation of Animation and Small Multiples for Trend Visualization on Mobile Phones
|
M. Brehmer, Bongshin Lee, Petra Isenberg, E. Choe
|
2019
|
View Paper |
Hypothetical Outcome Plots Help Untrained Observers Judge Trends in Ambiguous Data
|
Alex Kale, F. Nguyen, Matthew Kay, J. Hullman
|
2019
|
View Paper |
Mapping Color to Meaning in Colormap Data Visualizations
|
Karen B. Schloss, Connor Gramazio, Allison T. Silverman, Madeline L. Parker, Audrey S. Wang
|
2019
|
View Paper |
Visualizing Uncertain Tropical Cyclone Predictions using Representative Samples from Ensembles of Forecast Tracks
|
Le Liu, Lace M. K. Padilla, Sarah H. Creem-Regehr, D. House
|
2019
|
View Paper |
Information Visualization Evaluation Using Crowdsourcing
|
R. Borgo, L. Micallef, Benjamin Bach, F. McGee, Bongshin Lee
|
2018
|
View Paper |
Hooked on data videos: assessing the effect of animation and pictographs on viewer engagement
|
Fereshteh Amini, N. Riche, Bongshin Lee, Jason Leboe-McGowan, Pourang Irani
|
2018
|
View Paper |
Prolific.ac—A subject pool for online experiments
|
Stefan Palan, Christian Schitter
|
2017
|
View Paper |
Task-Based Effectiveness of Basic Visualizations
|
B. Saket, A. Endert, Çağatay Demiralp
|
2017
|
View Paper |
Redundant Encoding Strengthens Segmentation and Grouping in Visual Displays of Data
|
Christine Nothelfer, Michael Gleicher, S. Franconeri
|
2017
|
View Paper |
Manipulating and controlling for personality effects on visualization tasks
|
Alvitta Ottley, Jordan Crouser, Caroline Ziemkiewicz, Remco Chang, R. Jordan Crouser
|
2015
|
View Paper |
Visualization Analysis and Design
|
T. Munzner
|
2014
|
View Paper |
The Not-so-Staggering Effect of Staggered Animated Transitions on Visual Tracking
|
Fanny Chevalier, Pierre Dragicevic, S. Franconeri
|
2014
|
View Paper |
SketchStory: Telling More Engaging Stories with Data through Freeform Sketching
|
Bongshin Lee, Rubaiat Habib Kazi, Greg Smith
|
2013
|
View Paper |
Watch this: A taxonomy for dynamic data visualization
|
Joseph A. Cottam, A. Lumsdaine, C. Weaver
|
2012
|
View Paper |
Animation for Time-oriented Data: An Overview of Empirical Research
|
S. Kriglstein, M. Pohl, Claus Stachl
|
2012
|
View Paper |
A Qualitative Study on the Exploration of Temporal Changes in Flow Maps with Animation and Small‐Multiples
|
I. Boyandin, E. Bertini, D. Lalanne
|
2012
|
View Paper |
Animation for Visualization: Opportunities and Drawbacks
|
Danyel Fisher
|
2010
|
View Paper |
Effectiveness of Animation in Trend Visualization
|
G. Robertson, R. Fernandez, Danyel Fisher, Bongshin Lee, J. Stasko
|
2008
|
View Paper |
Animated Transitions in Statistical Data Graphics
|
Jeffrey Heer, G. Robertson
|
2007
|
View Paper |
Applying Animation to the Visual Analysis of Financial Time-Dependent Data
|
Tatiana Tekusová, J. Kohlhammer
|
2007
|
View Paper |
Tracking unique objects
|
T. Horowitz, S. Klieger, David Fencsik, Kevin K Yang, G. Alvarez, J. Wolfe
|
2007
|
View Paper |
Dynamic visualizations and learning: getting to the difficult questions
|
M. Hegarty
|
2004
|
View Paper |
The Roles of Mental Animations and External Animations in Understanding Mechanical Systems
|
M. Hegarty, Sarah Kriz, Christina L. Cate
|
2003
|
View Paper |
Animation: can it facilitate?
|
B. Tversky, J. Morrison, Mireille Bétrancourt
|
2002
|
View Paper |
Does animation help users build mental maps of spatial information?
|
B. Bederson, Angela Boltman
|
1999
|
View Paper |
Visualizing spatial data uncertainty using animation
|
C. Ehlschlaeger, Ashton M. Shortridge, M. Goodchild
|
1997
|
View Paper |
The eyes have it: a task by data type taxonomy for information visualizations
|
B. Shneiderman
|
1996
|
View Paper |
Visual motion and attentional capture
|
A. Hillstrom, S. Yantis
|
1994
|
View Paper |
The human visual system averages speed information
|
S. Watamaniuk, Andrew P. Duchon
|
1992
|
View Paper |
Automating the design of graphical presentations of relational information
|
J. Mackinlay
|
1986
|
View Paper |
Coherent global motion percepts from stochastic local motions
|
Douglas W. Williams, R. Sekuler
|
1984
|
View Paper |
Graphical Perception: Theory, Experimentation, and Application to the Development of Graphical Methods
|
W. Cleveland, R. McGill
|
1984
|
View Paper |
Crowd-sourcing for information visualization: Promises and pitfalls
|
2017
|
||
Ensemble perception: Summarizing the scene and broadening the limits of visual processing.
|
Jason M. Haberman, D. Whitney
|
2012
|
View Paper |
Interactive dynamics for visual analysis: A taxonomy of tools that support the fluent and flexible use of visualizations
|
2012
|
||
Animated Exploration of Graphs with Radial Layout
|
K. Yee, D. Fisher, Rachna Dhamija, Marti A. Hearst
|
2001
|
View Paper |
Interactive and dynamic ECG analysis. Is it just an IDEA or a clinically relevant approach?
|
J. Fayn, L. Conti, S. Fareh, P. Maison-Blanche, P. Nony, P. Rubel
|
1996
|
View Paper |
MOTION-BASED VISuAL ENCODING CAN IMPROVE PERFORMANCE ON PERCEPTuAL TASKS
|
Showing first page preview. Click "Open Full PDF" to view the complete paper.
Your comment contains inappropriate language and has been rejected.
Are you sure you want to remove this tag? This action cannot be undone.
Someone just favorited a paper!
Comments (0)