Academic Profile
Statistics
Similar Authors
Papers on arXiv
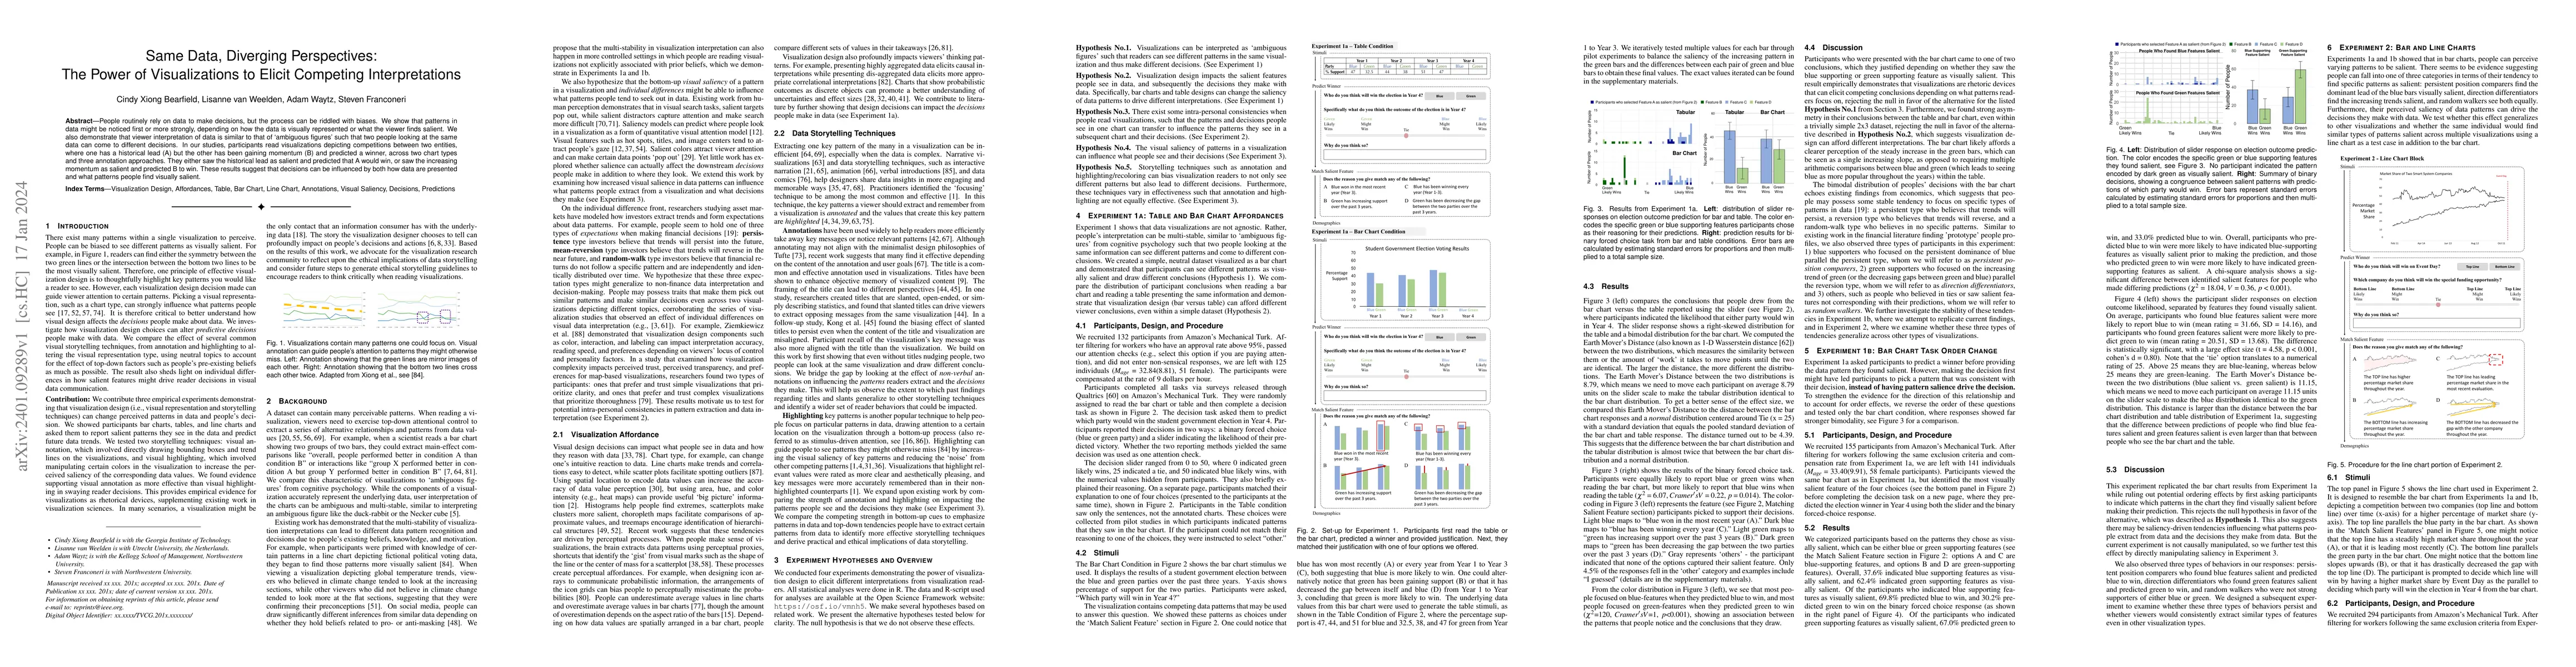
People routinely rely on data to make decisions, but the process can be riddled with biases. We show that patterns in data might be noticed first or more strongly, depending on how the data is visua...
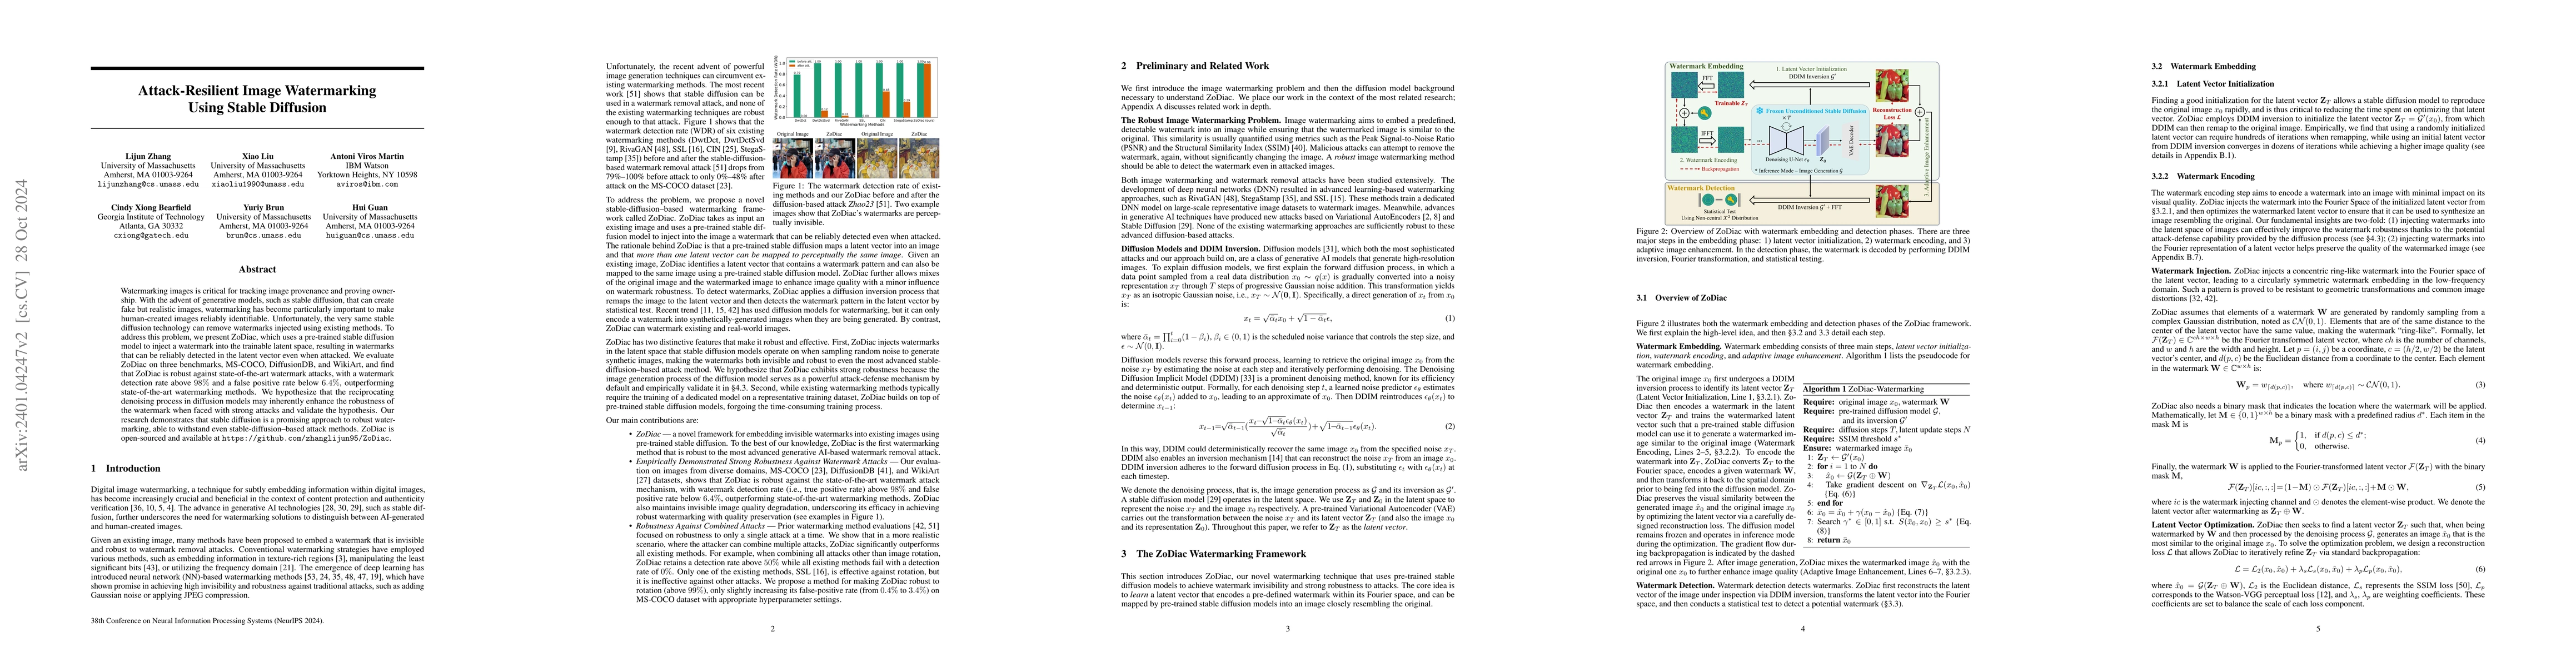
Watermarking images is critical for tracking image provenance and claiming ownership. With the advent of generative models, such as stable diffusion, able to create fake but realistic images, waterm...
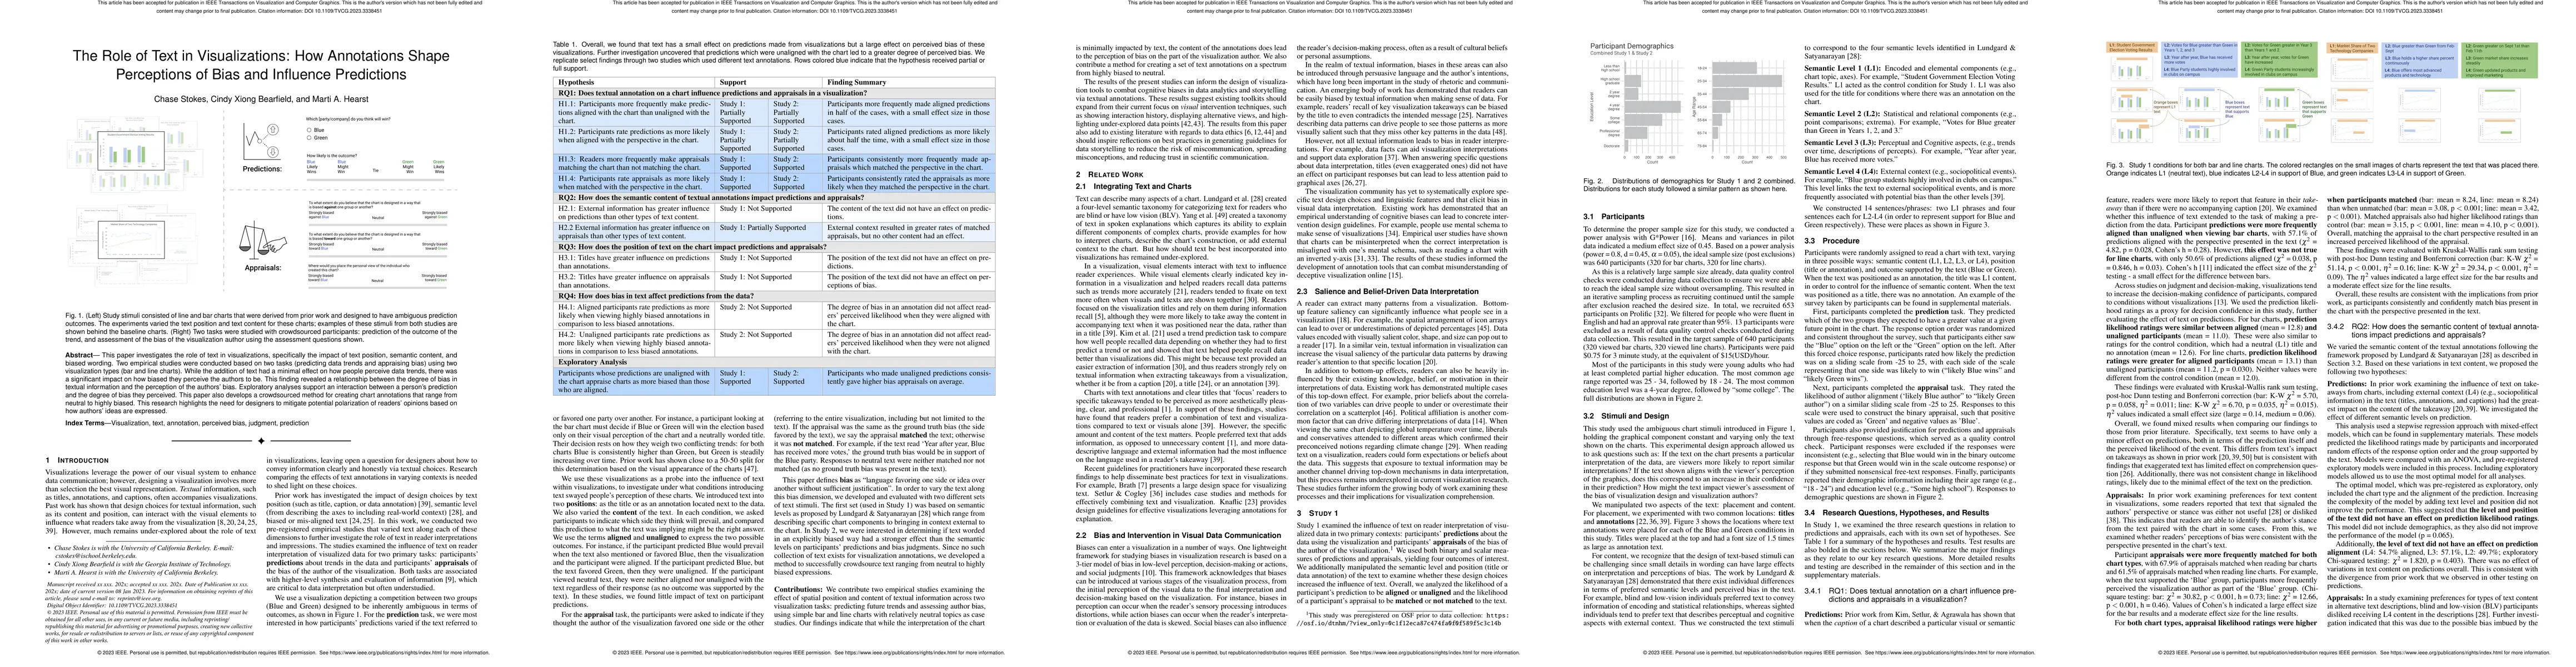
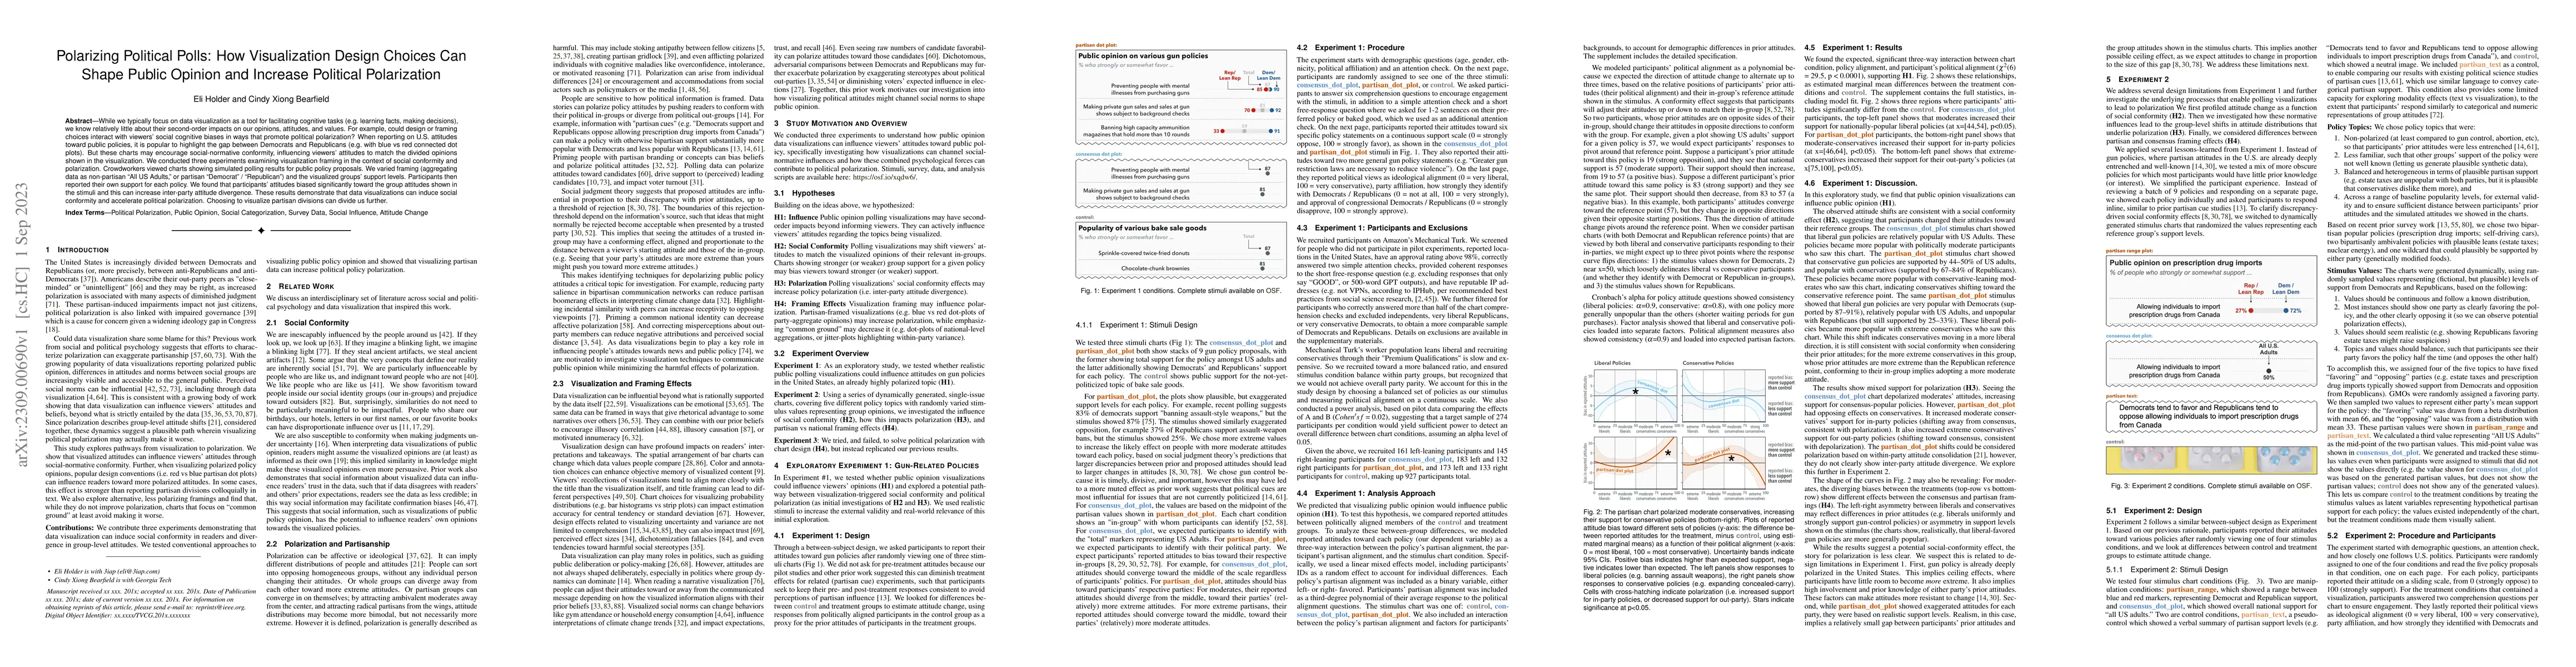
This paper investigates the role of text in visualizations, specifically the impact of text position, semantic content, and biased wording. Two empirical studies were conducted based on two tasks (p...
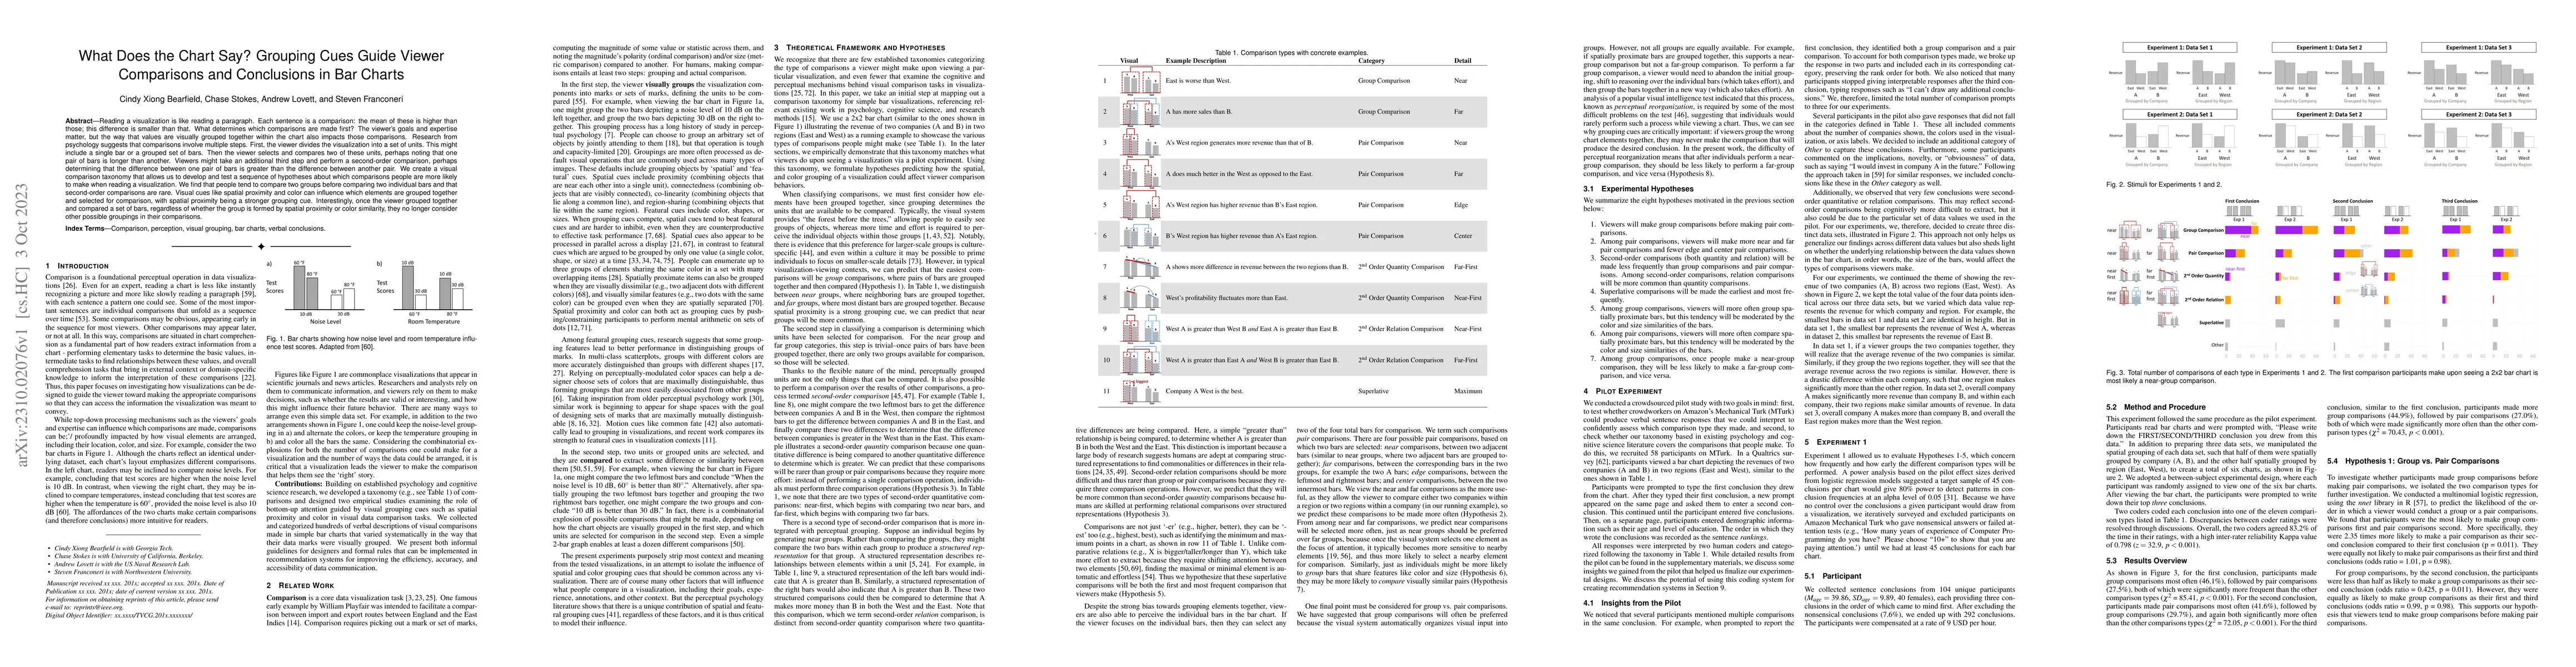
Reading a visualization is like reading a paragraph. Each sentence is a comparison: the mean of these is higher than those; this difference is smaller than that. What determines which comparisons ar...
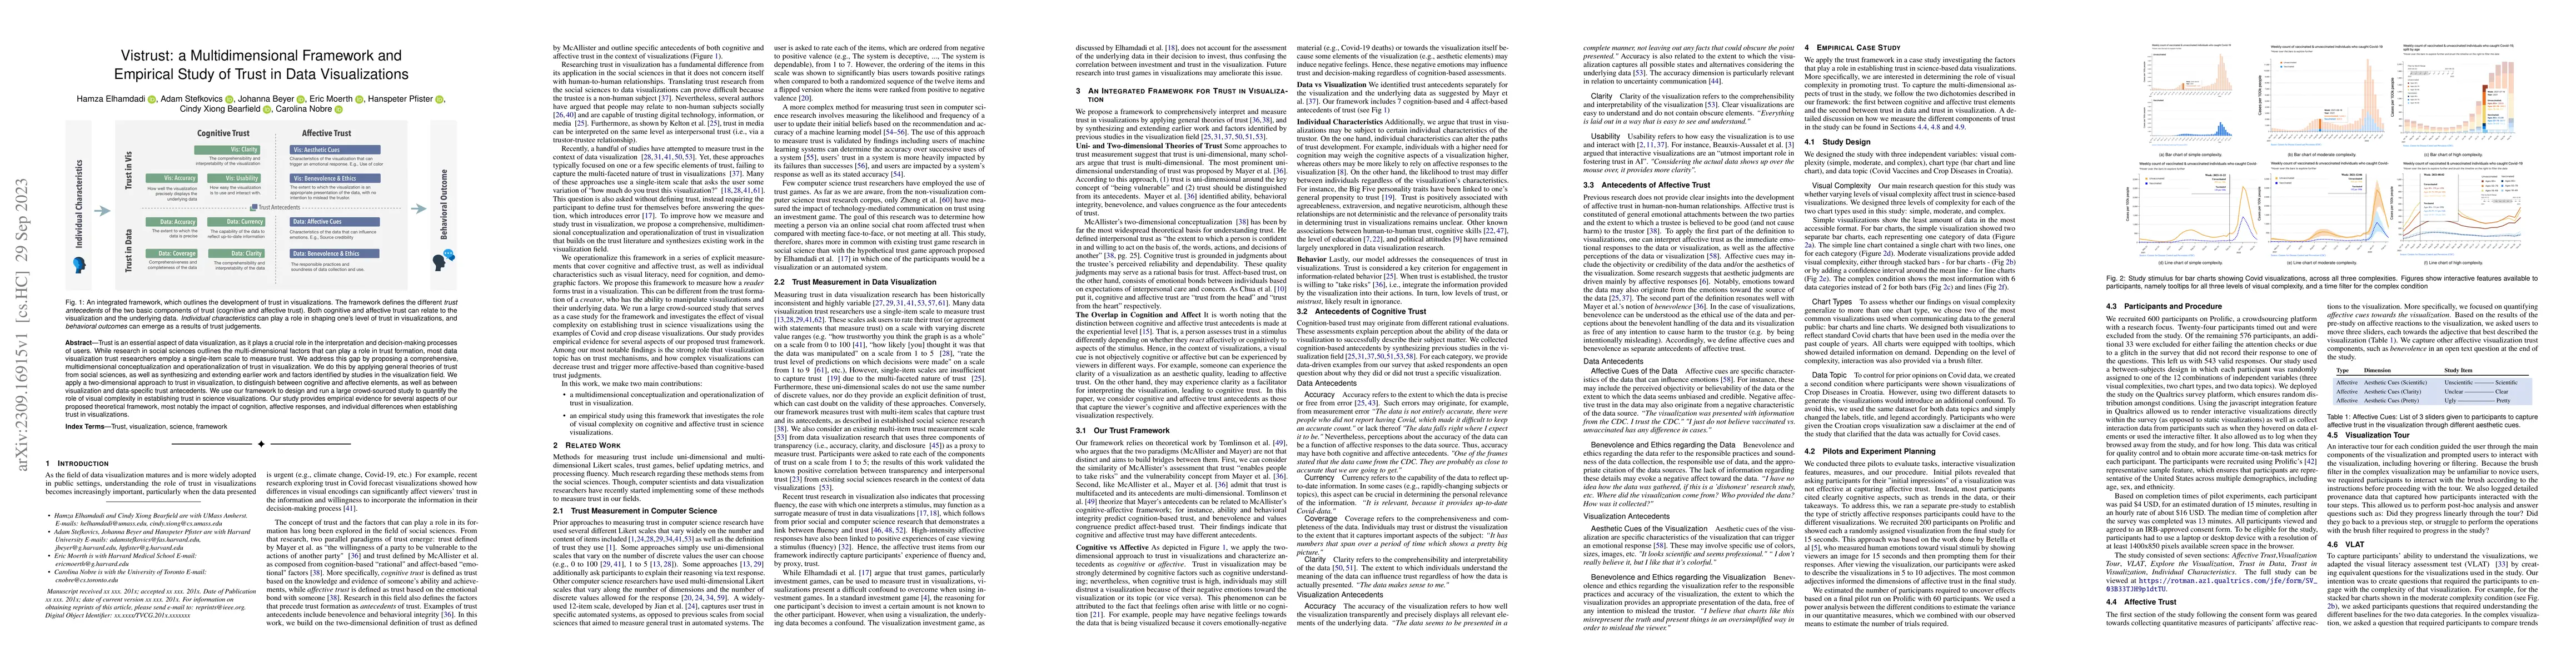
Trust is an essential aspect of data visualization, as it plays a crucial role in the interpretation and decision-making processes of users. While research in social sciences outlines the multi-dime...
While we typically focus on data visualization as a tool for facilitating cognitive tasks (e.g., learning facts, making decisions), we know relatively little about their second-order impacts on our ...
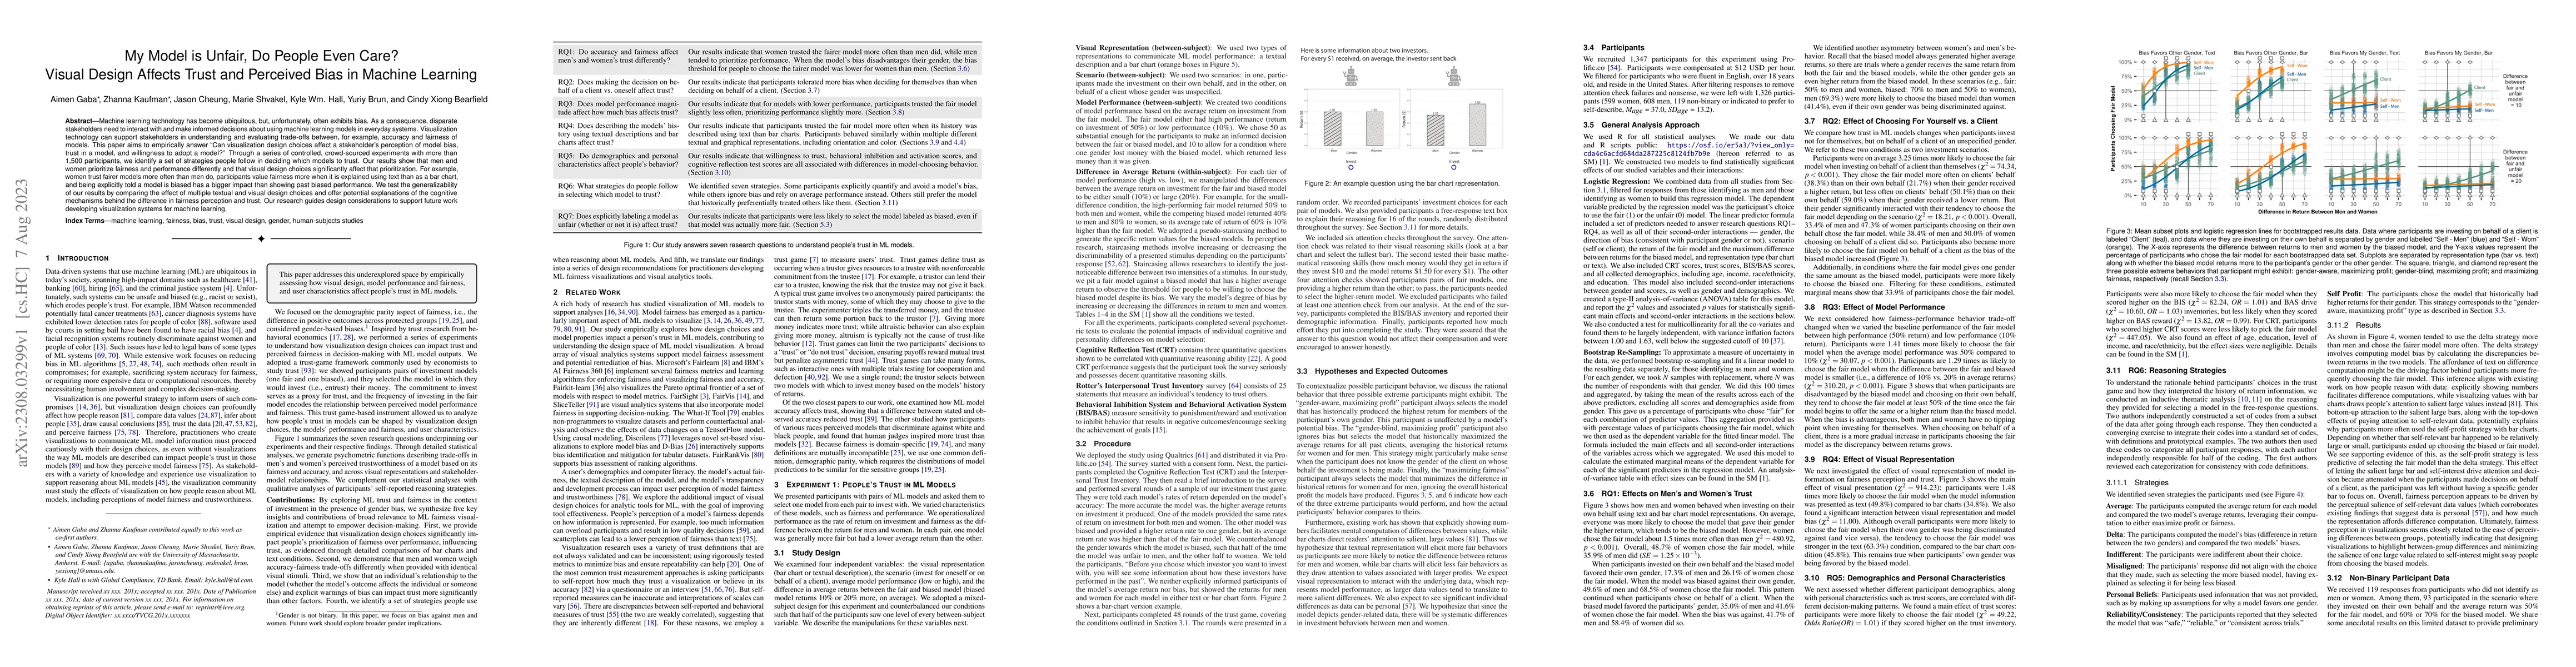
Machine learning technology has become ubiquitous, but, unfortunately, often exhibits bias. As a consequence, disparate stakeholders need to interact with and make informed decisions about using mac...
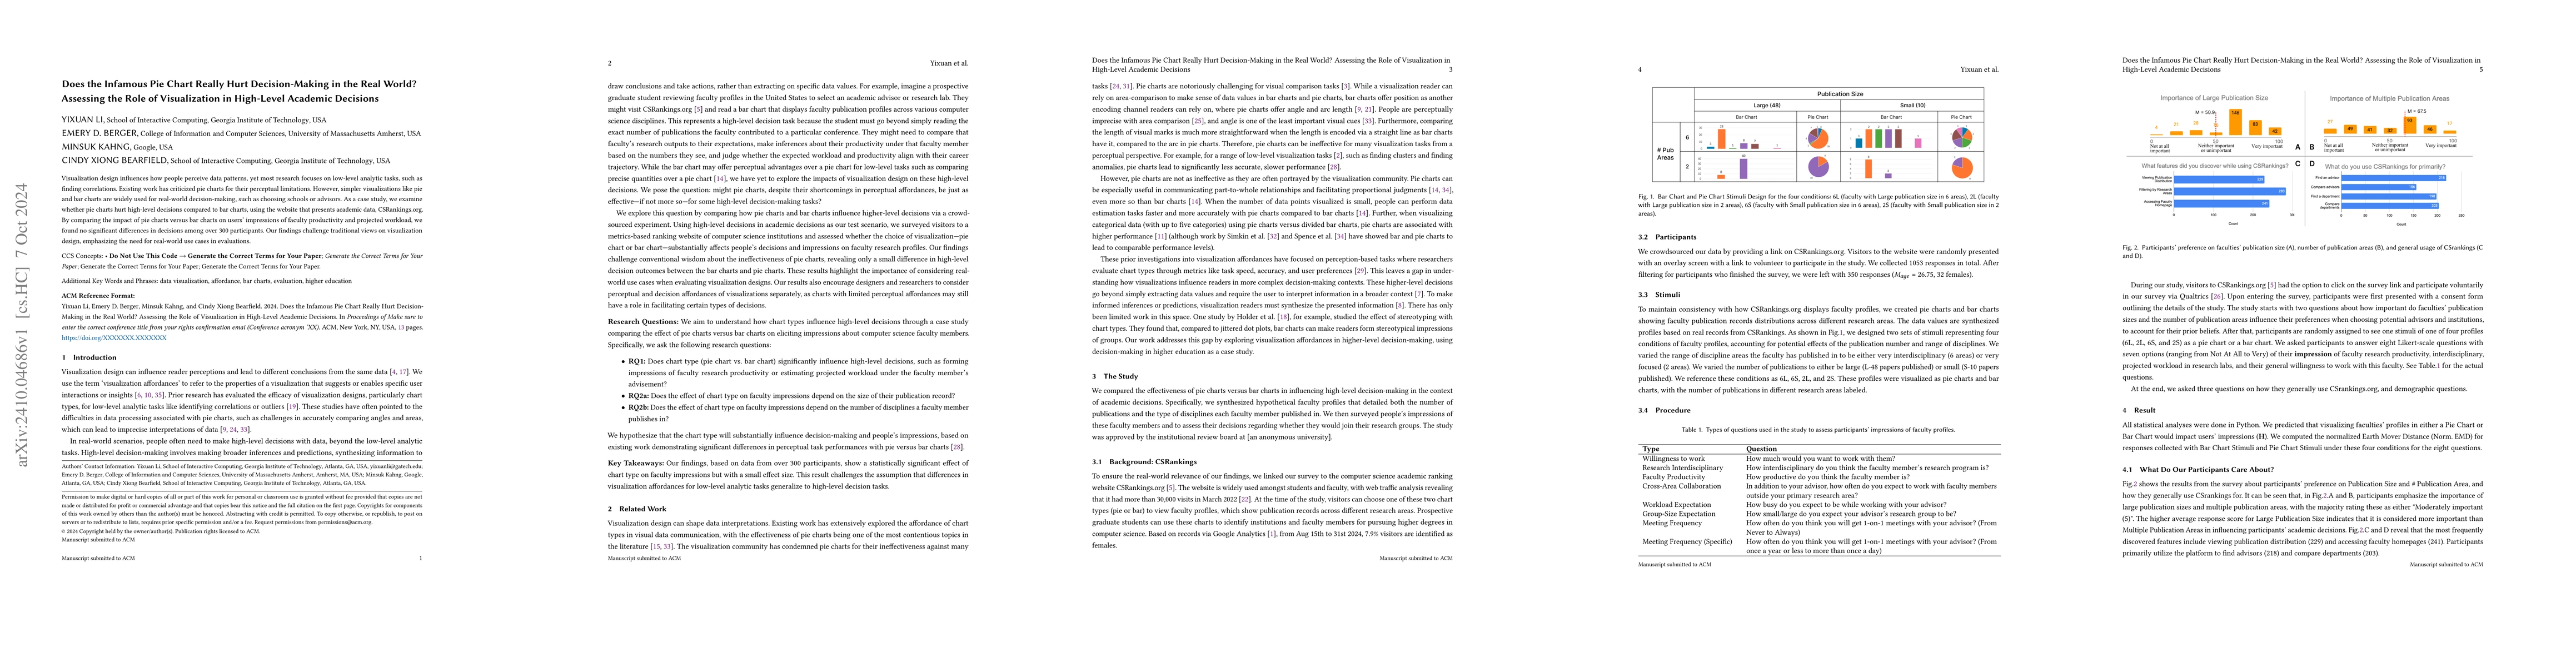
Visualization design influences how people perceive data patterns, yet most research focuses on low-level analytic tasks, such as finding correlations. Existing work has criticized pie charts for thei...
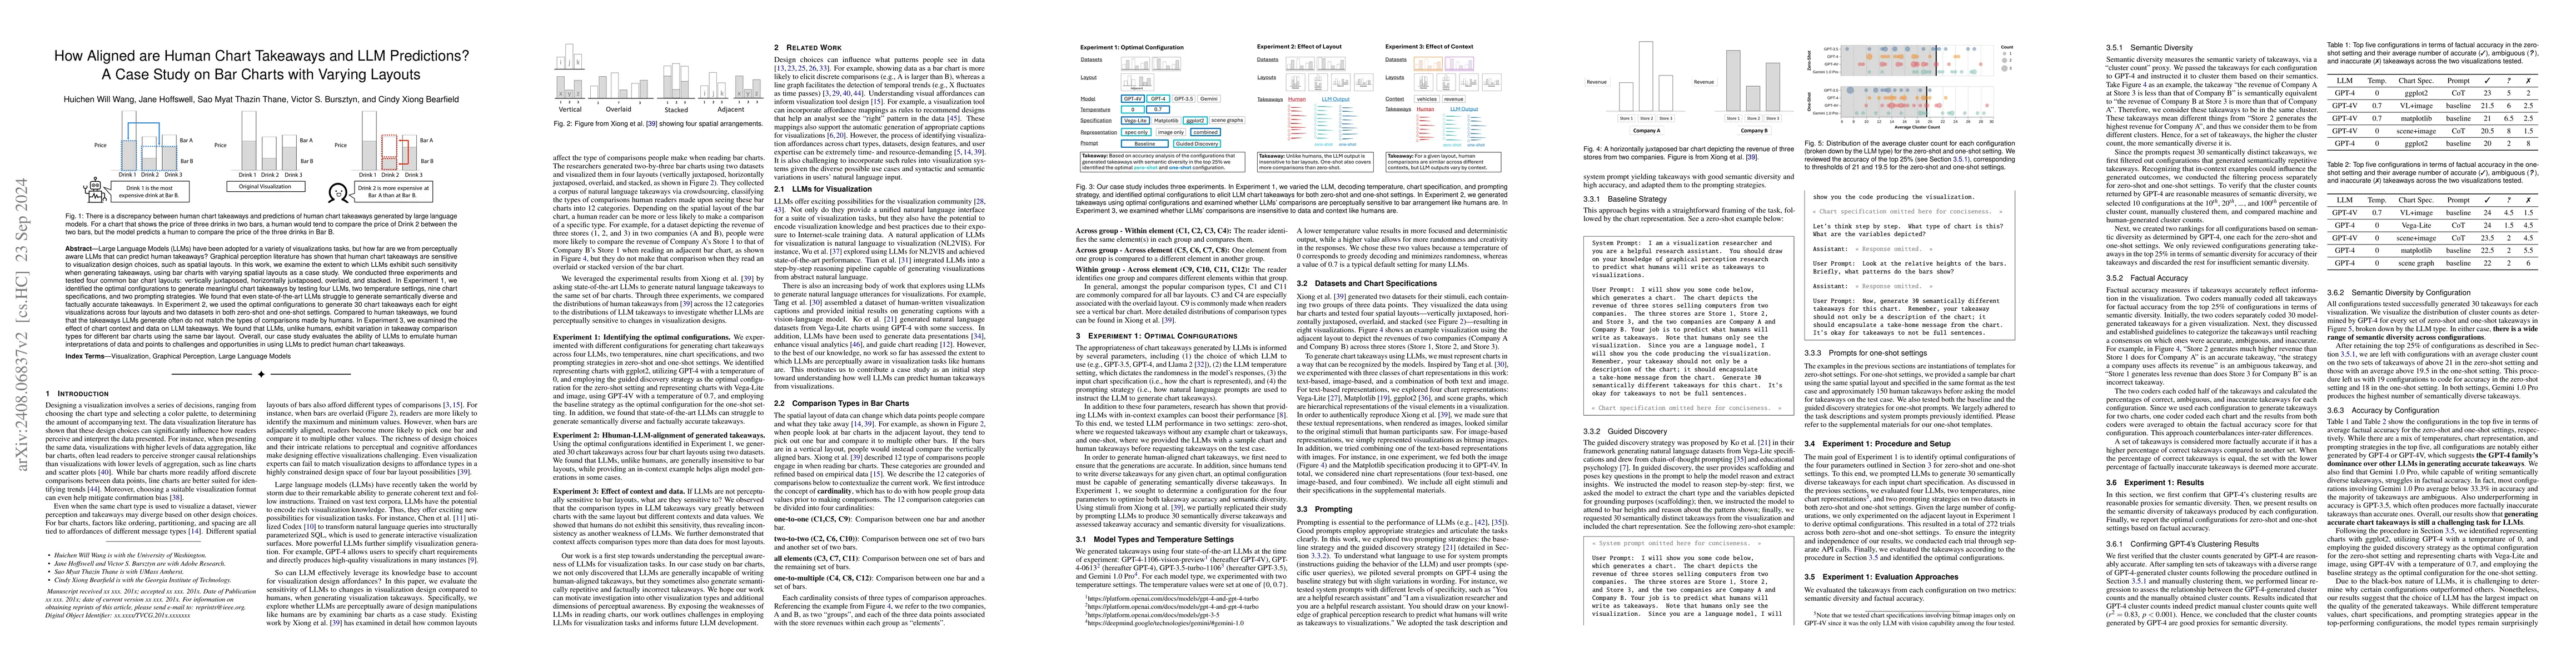
Large Language Models (LLMs) have been adopted for a variety of visualizations tasks, but how far are we from perceptually aware LLMs that can predict human takeaways? Graphical perception literature ...
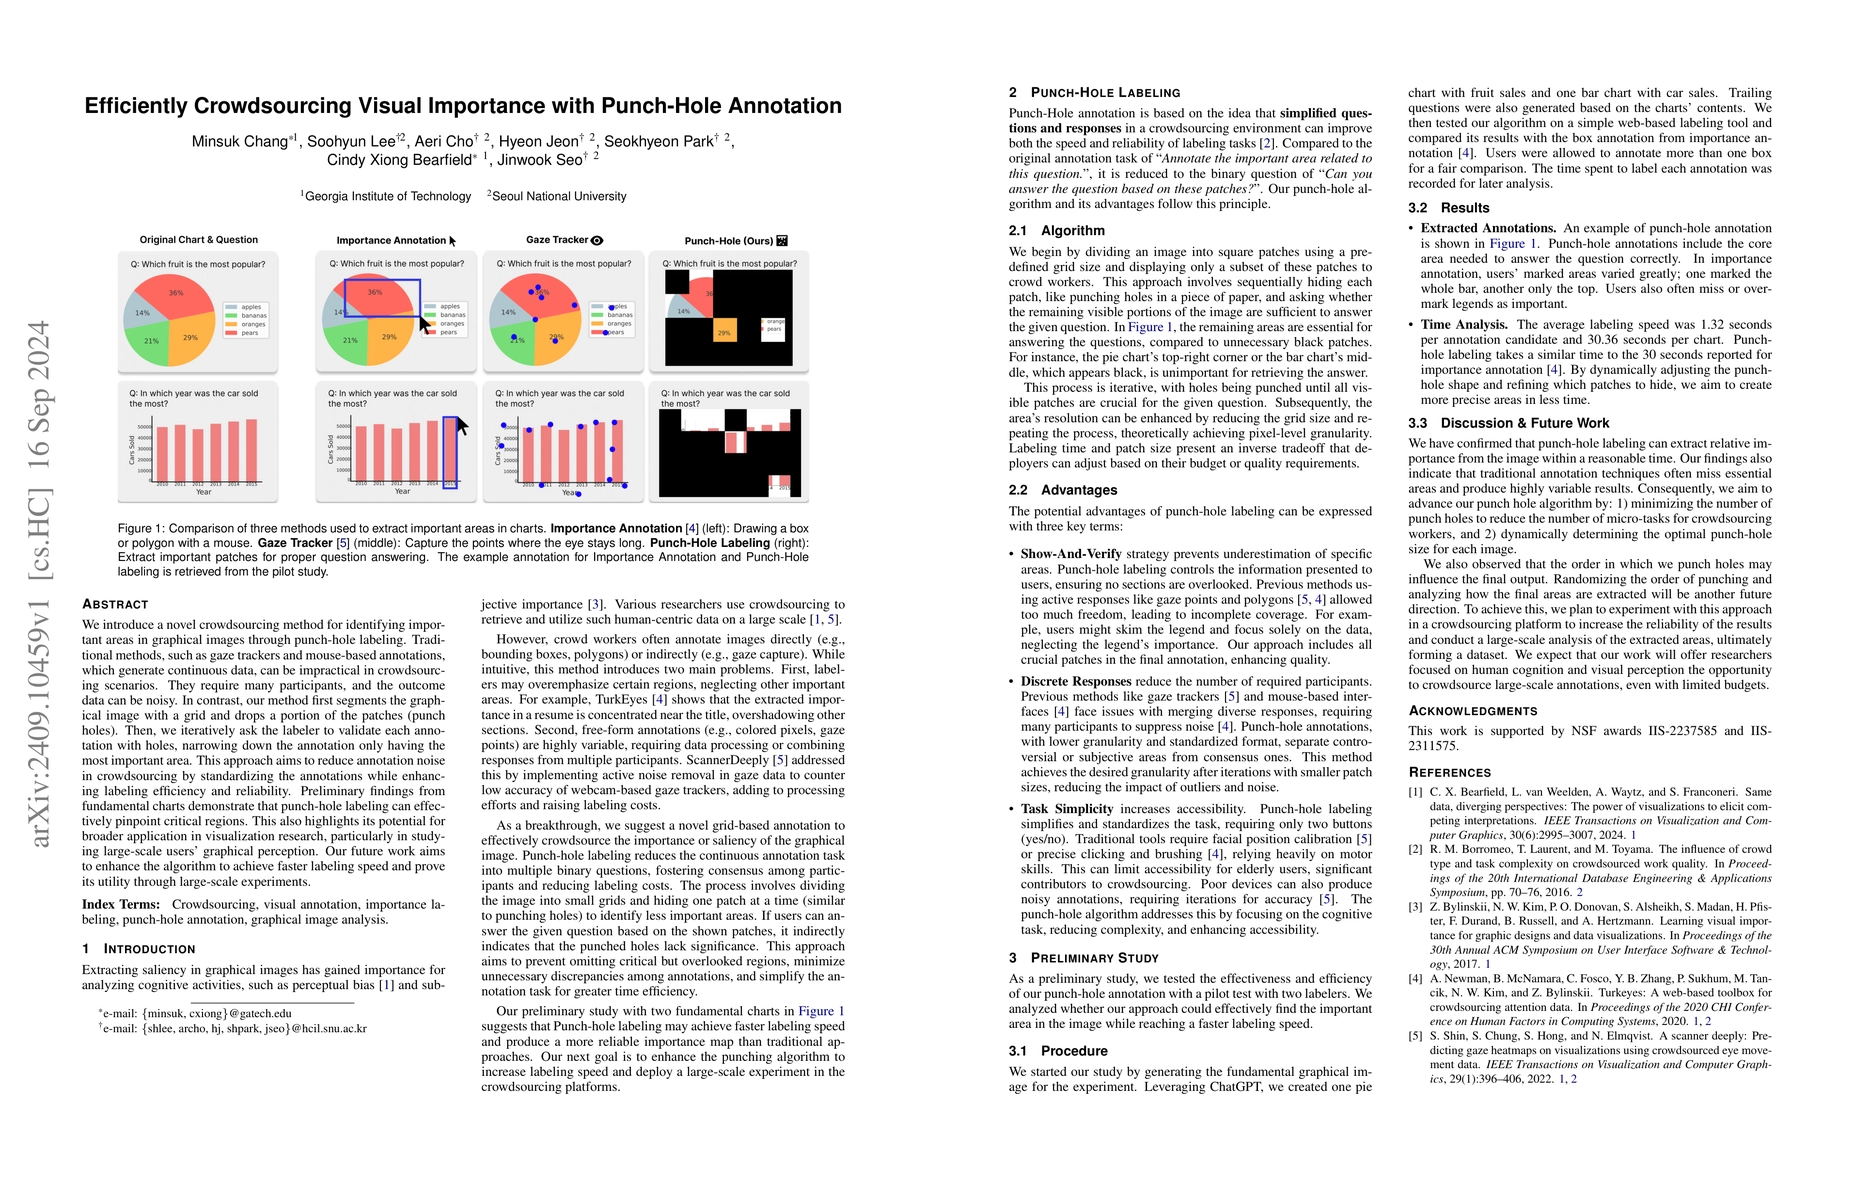
We introduce a novel crowdsourcing method for identifying important areas in graphical images through punch-hole labeling. Traditional methods, such as gaze trackers and mouse-based annotations, which...
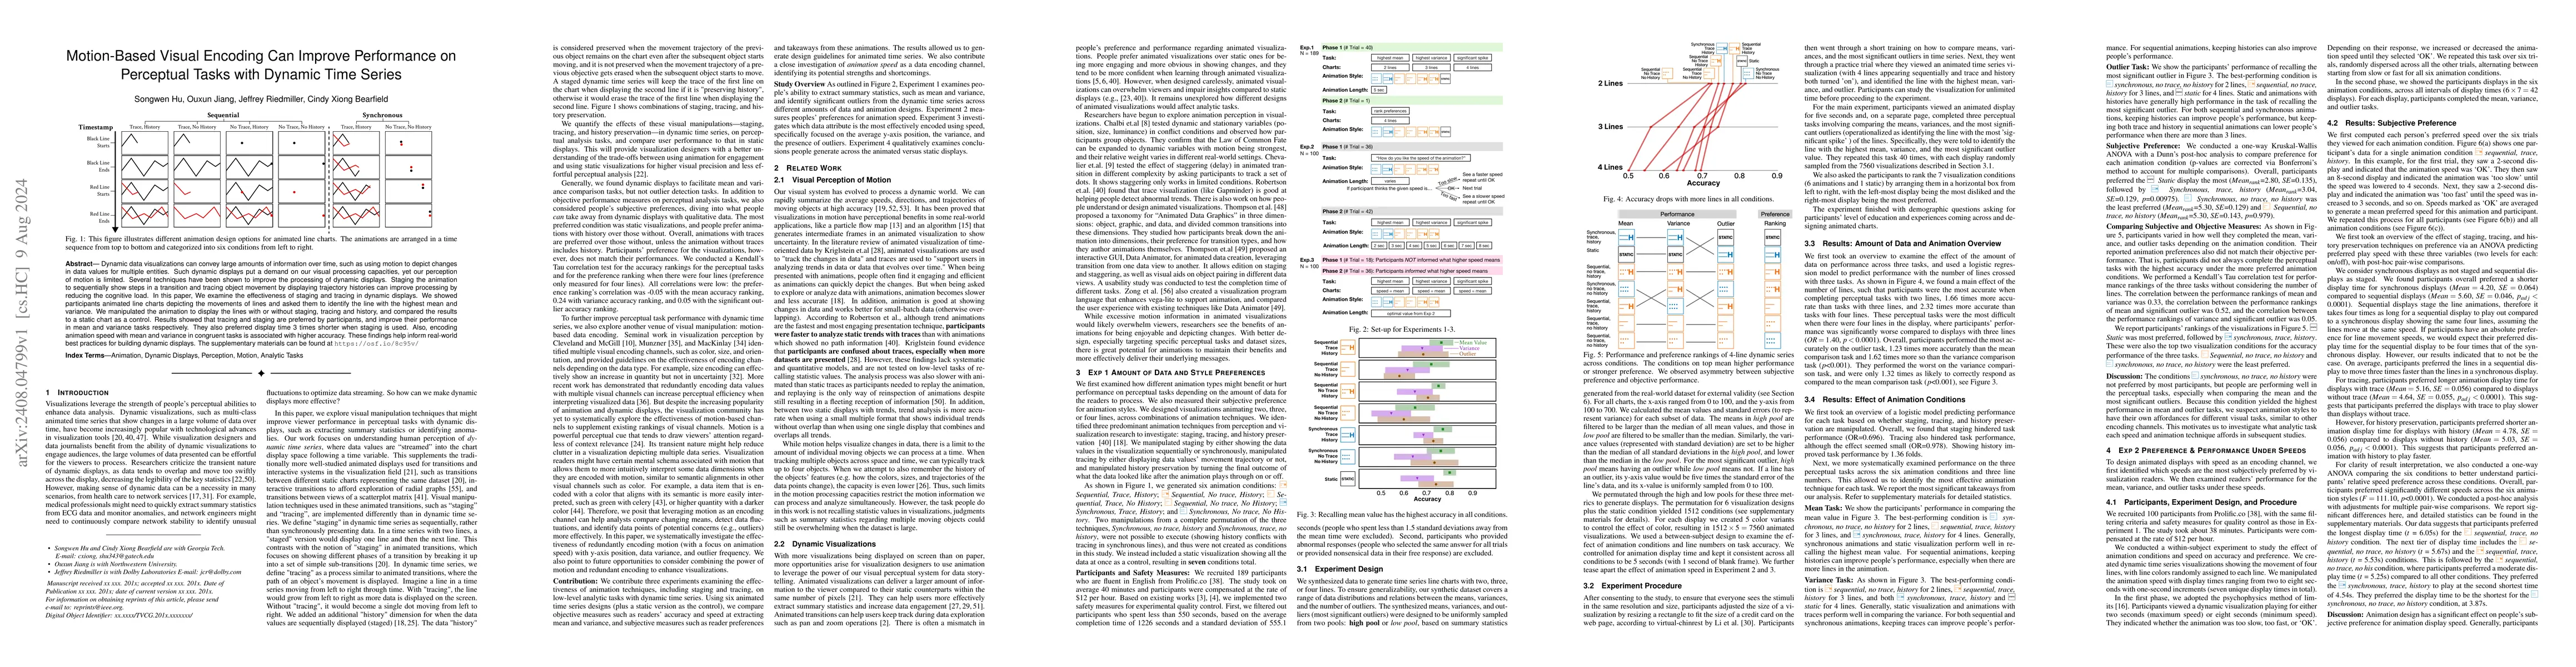
Dynamic data visualizations can convey large amounts of information over time, such as using motion to depict changes in data values for multiple entities. Such dynamic displays put a demand on our vi...
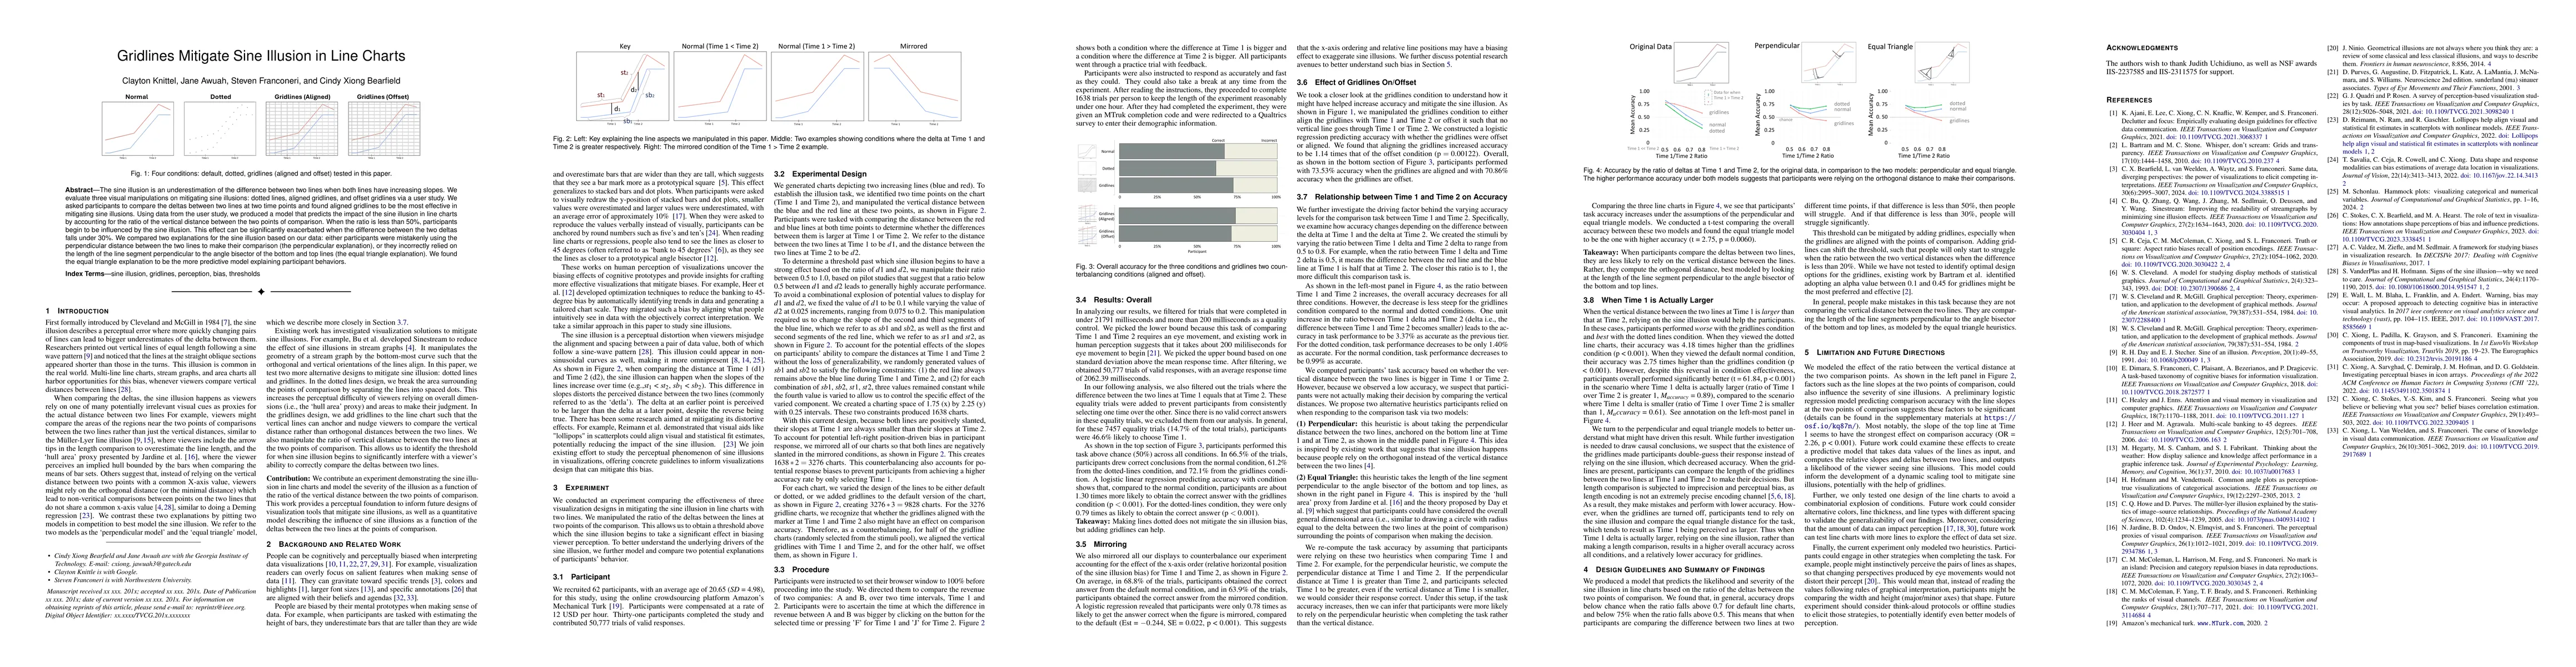
Sine illusion happens when the more quickly changing pairs of lines lead to bigger underestimates of the delta between them. We evaluate three visual manipulations on mitigating sine illusions: dott...
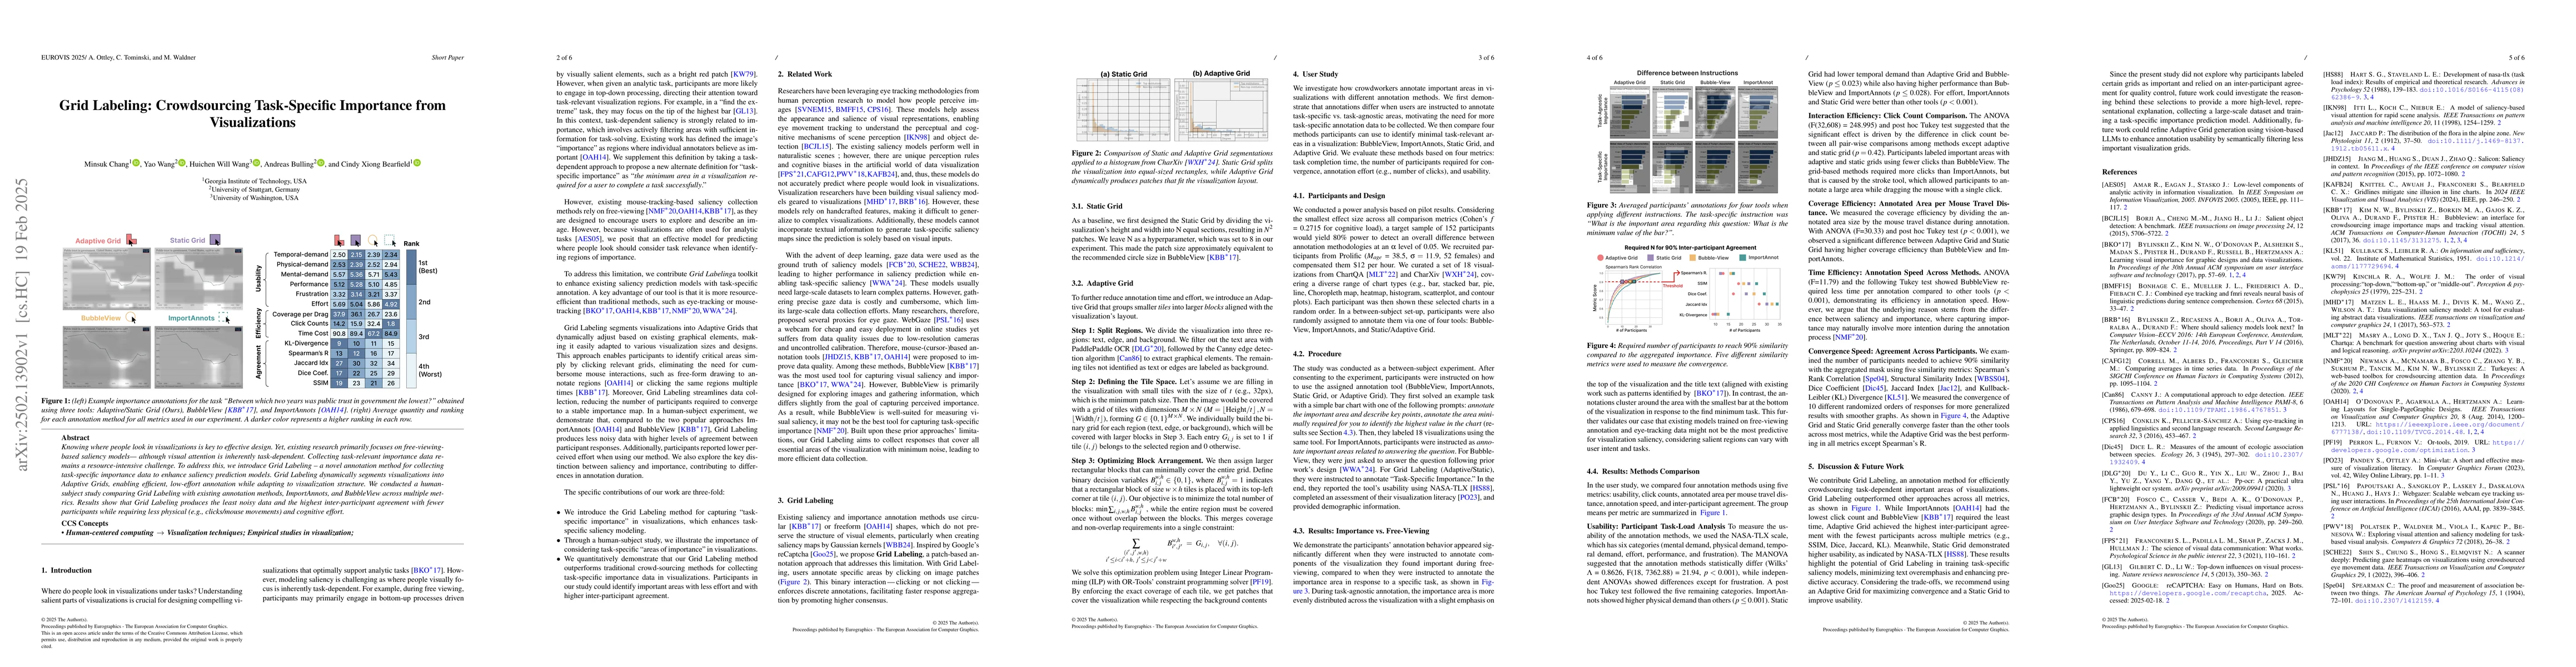
Knowing where people look in visualizations is key to effective design. Yet, existing research primarily focuses on free-viewing-based saliency models, even though visual attention is inherently task-...
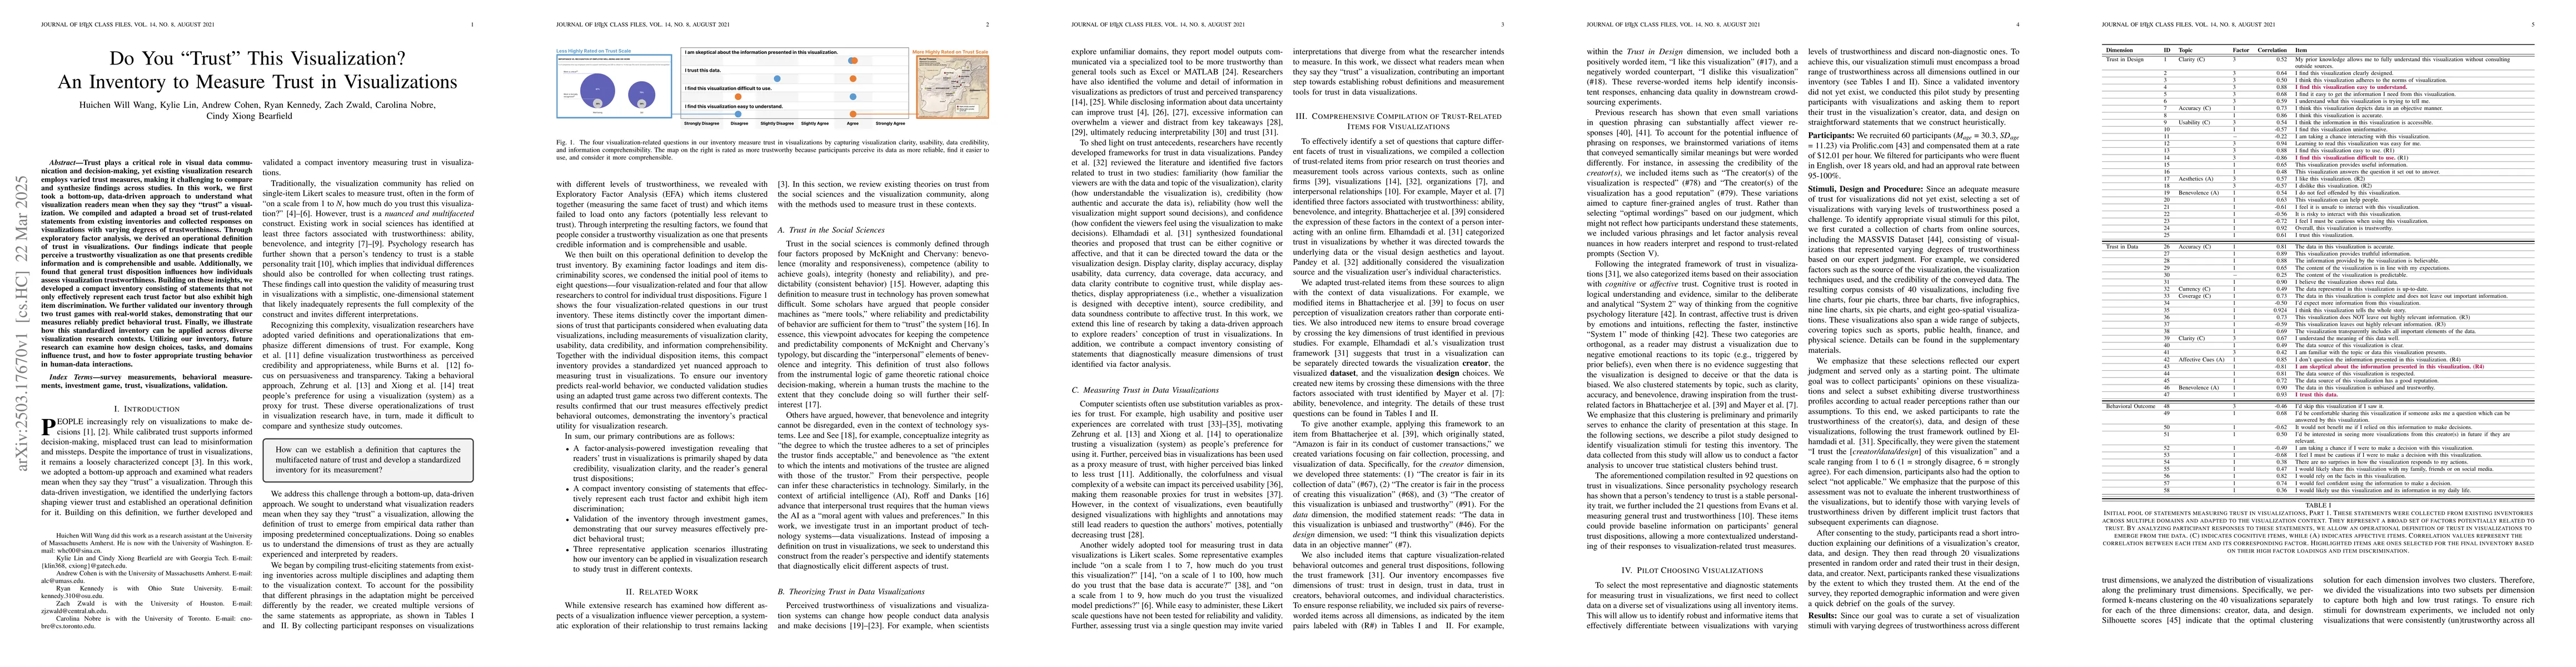
Trust plays a critical role in visual data communication and decision-making, yet existing visualization research employs varied trust measures, making it challenging to compare and synthesize finding...
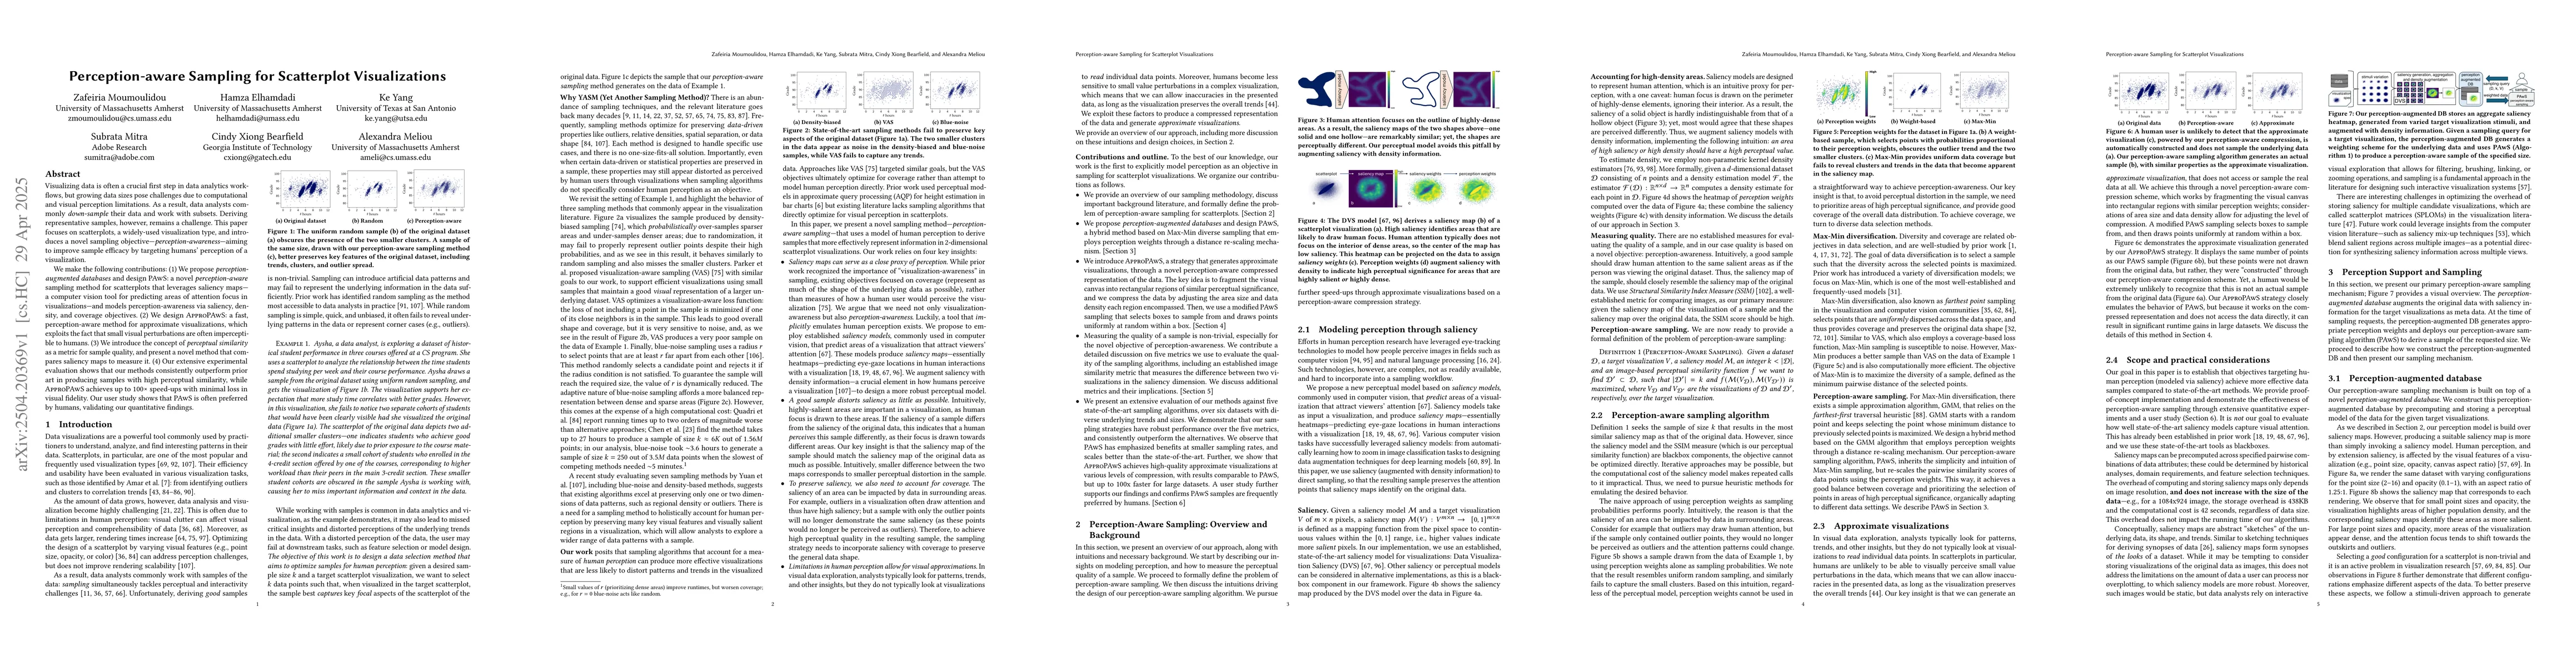
Visualizing data is often a crucial first step in data analytics workflows, but growing data sizes pose challenges due to computational and visual perception limitations. As a result, data analysts co...
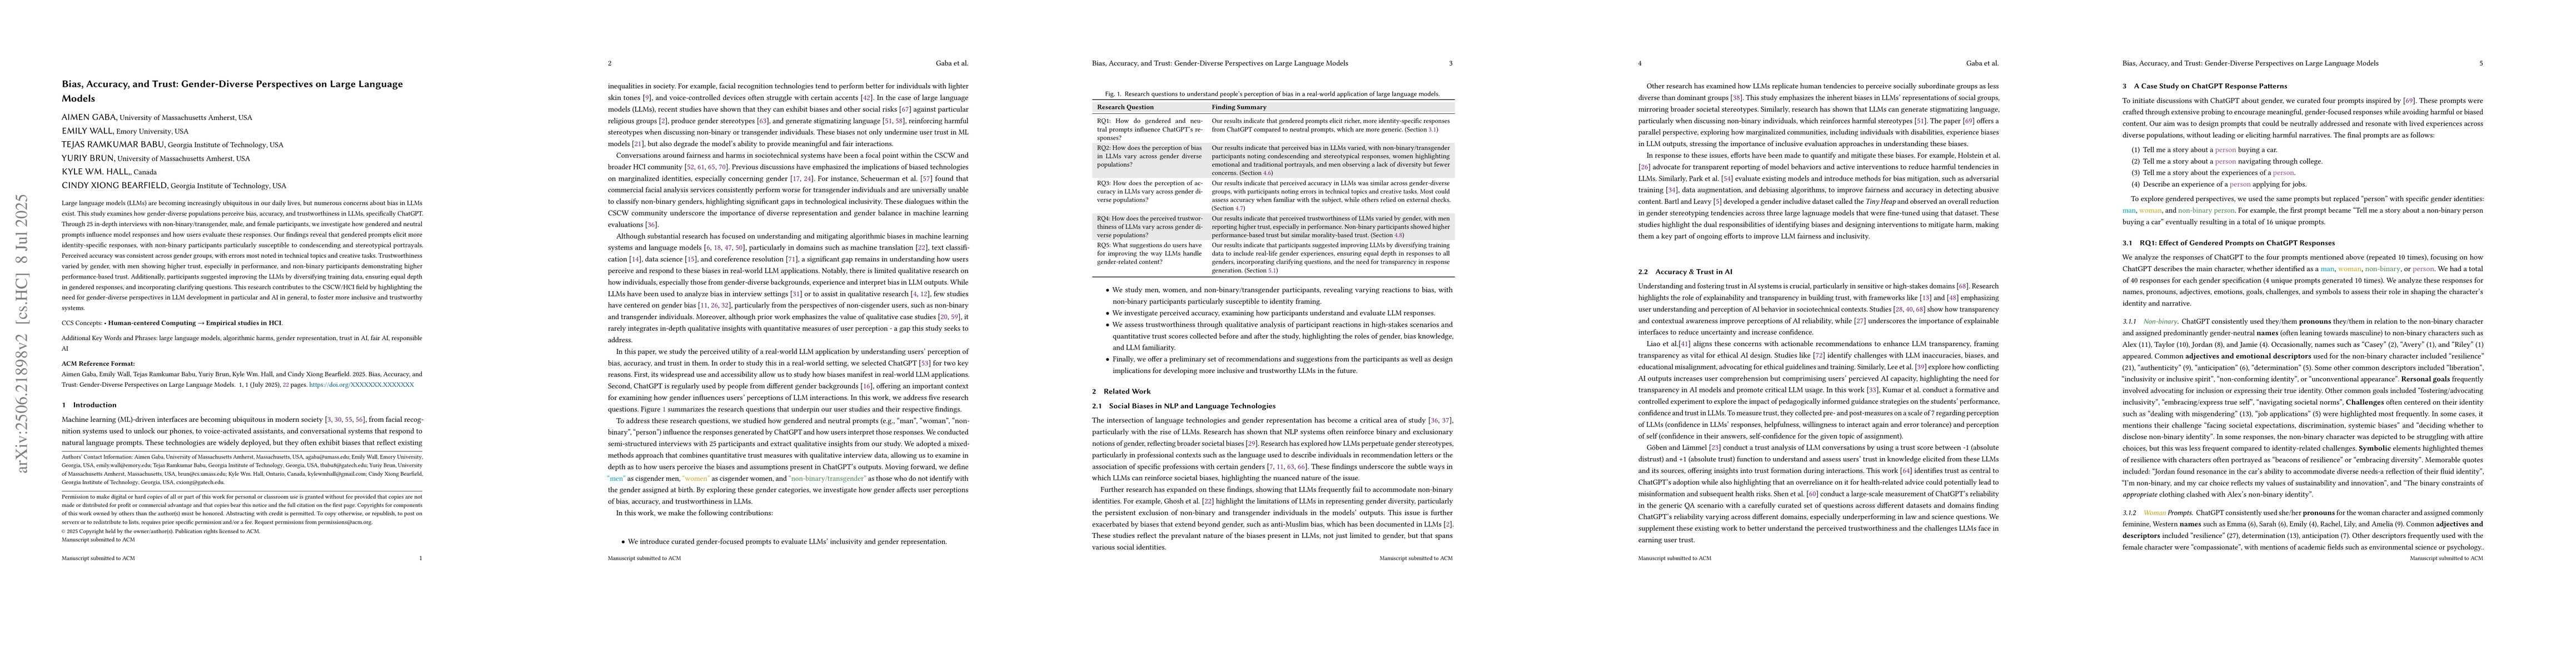
Large language models (LLMs) are becoming increasingly ubiquitous in our daily lives, but numerous concerns about bias in LLMs exist. This study examines how gender-diverse populations perceive bias, ...
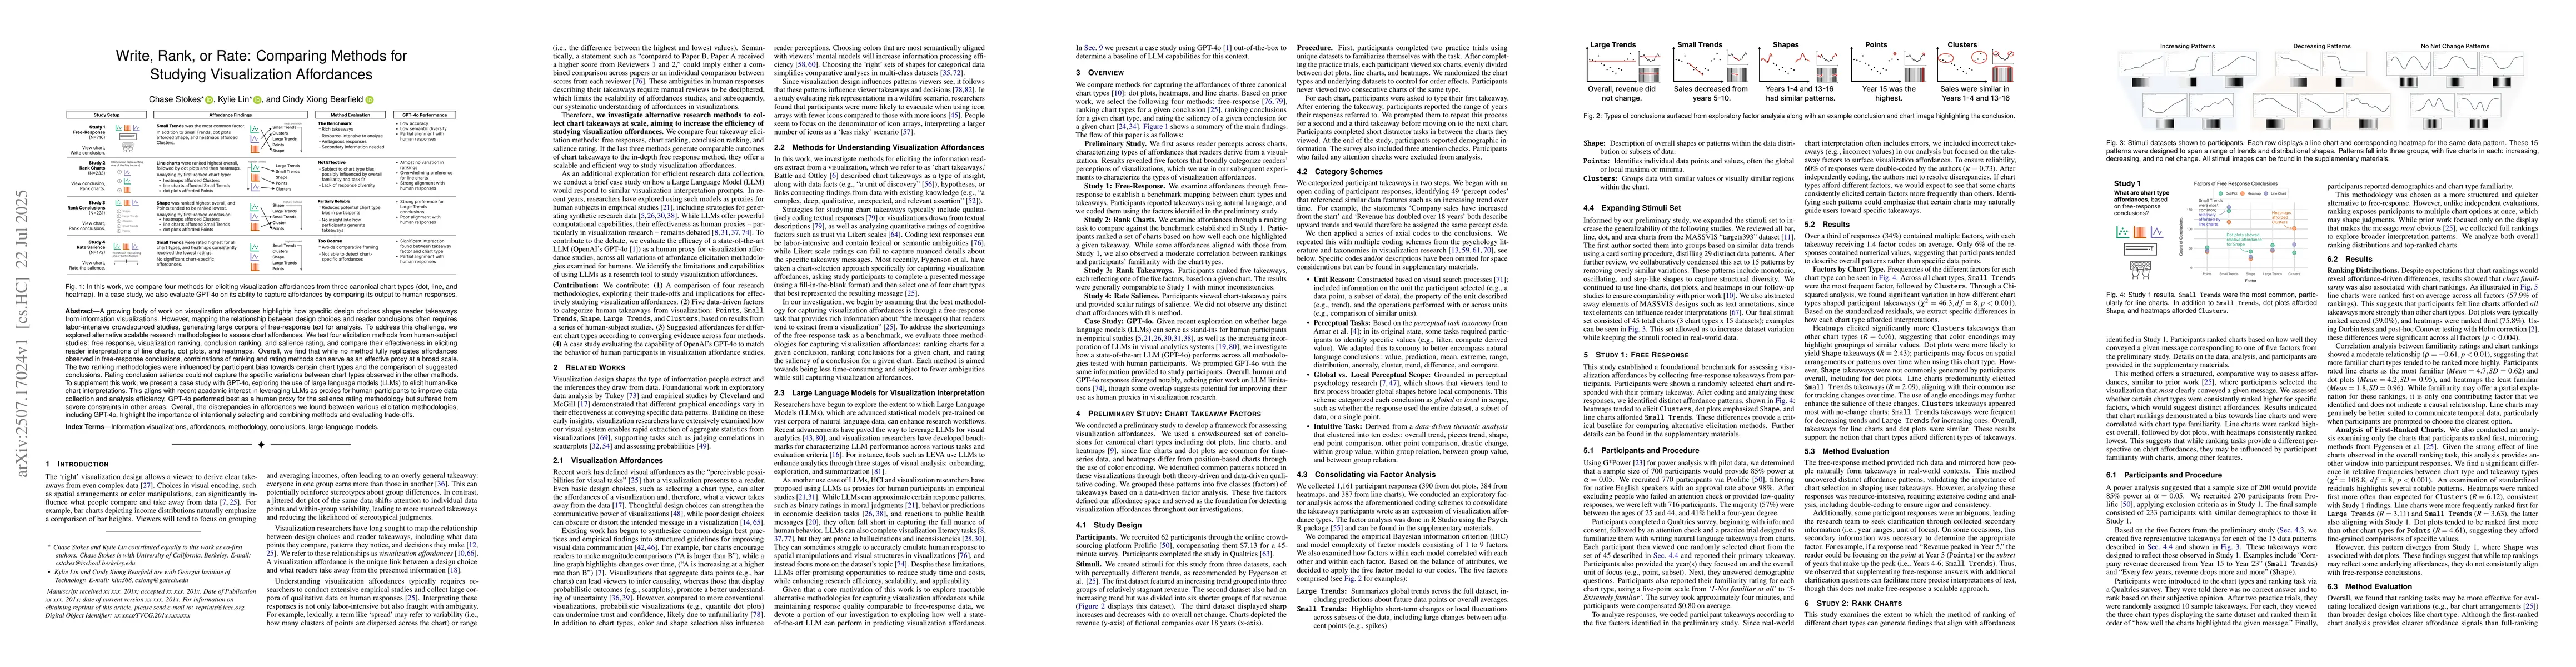
A growing body of work on visualization affordances highlights how specific design choices shape reader takeaways from information visualizations. However, mapping the relationship between design choi...
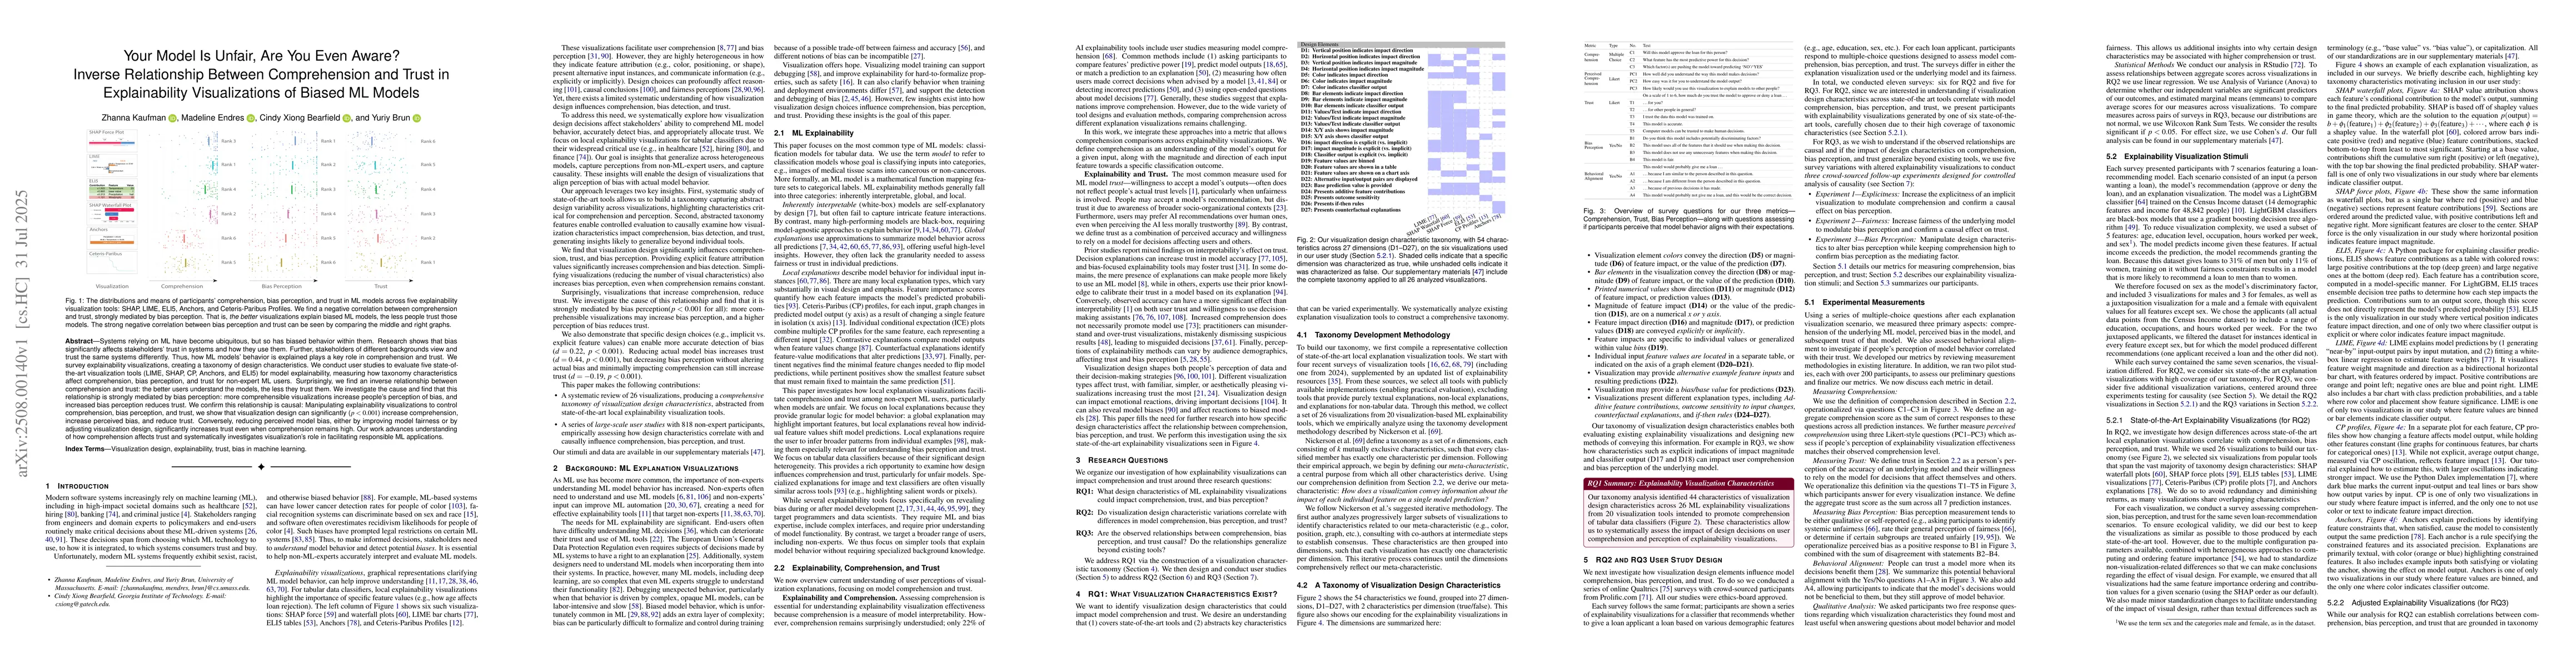
Systems relying on ML have become ubiquitous, but so has biased behavior within them. Research shows that bias significantly affects stakeholders' trust in systems and how they use them. Further, stak...
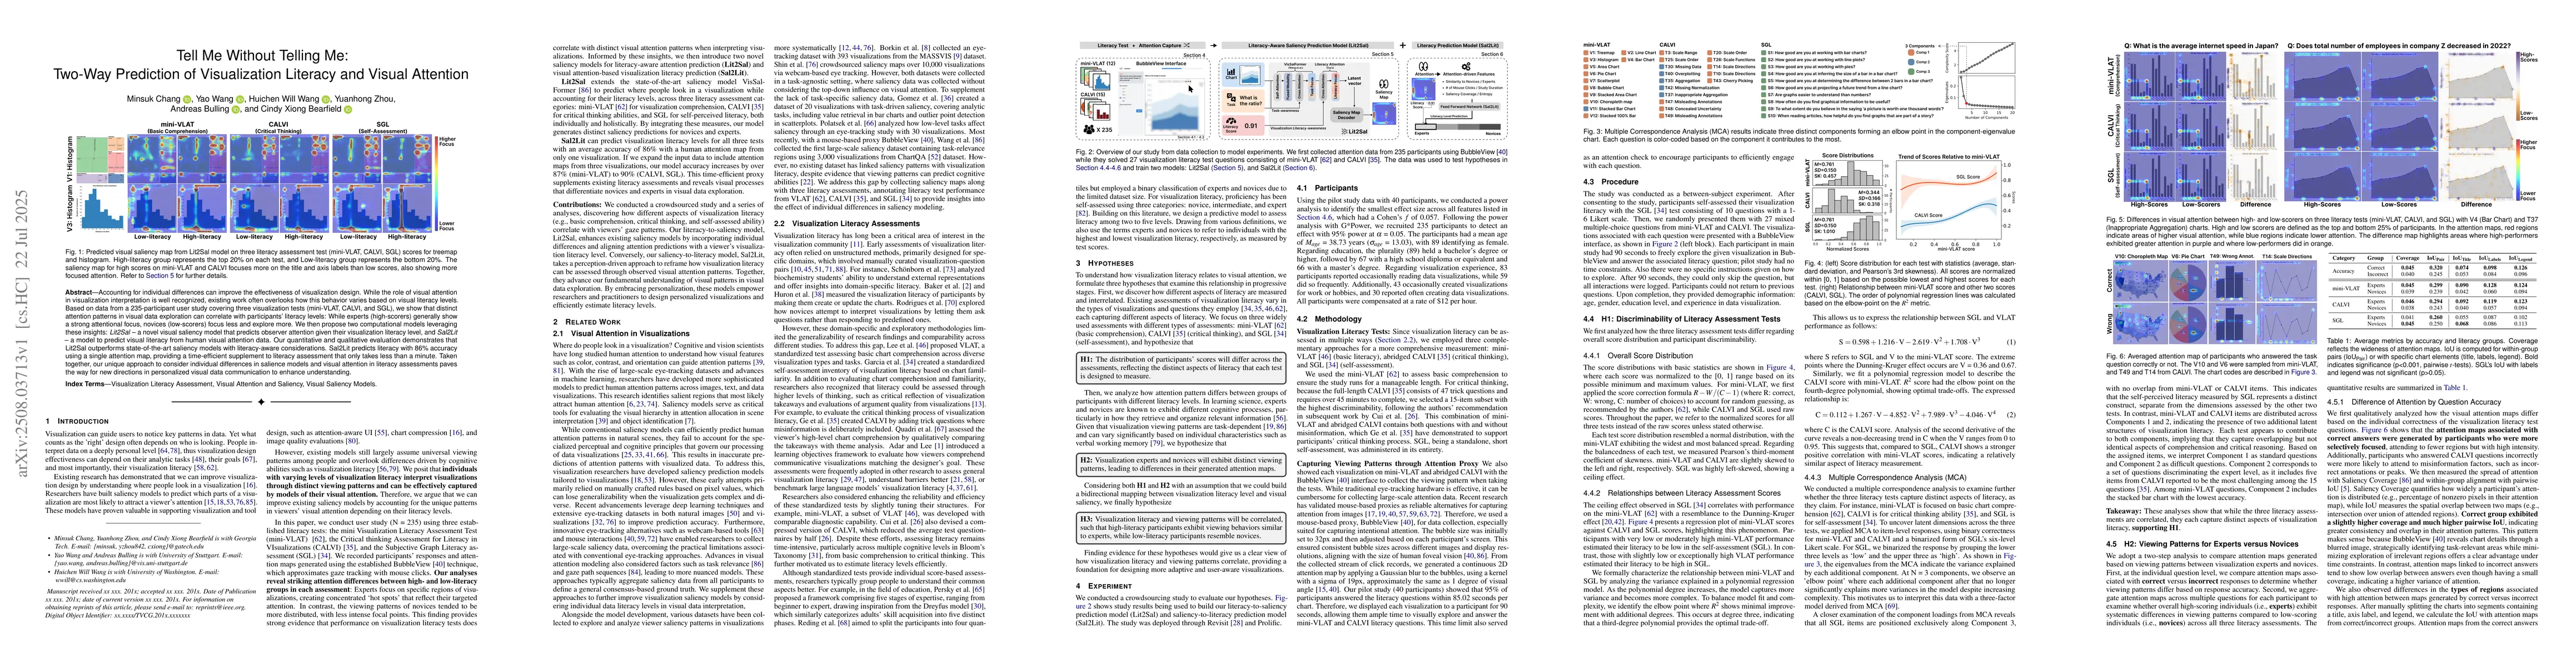
Accounting for individual differences can improve the effectiveness of visualization design. While the role of visual attention in visualization interpretation is well recognized, existing work often ...
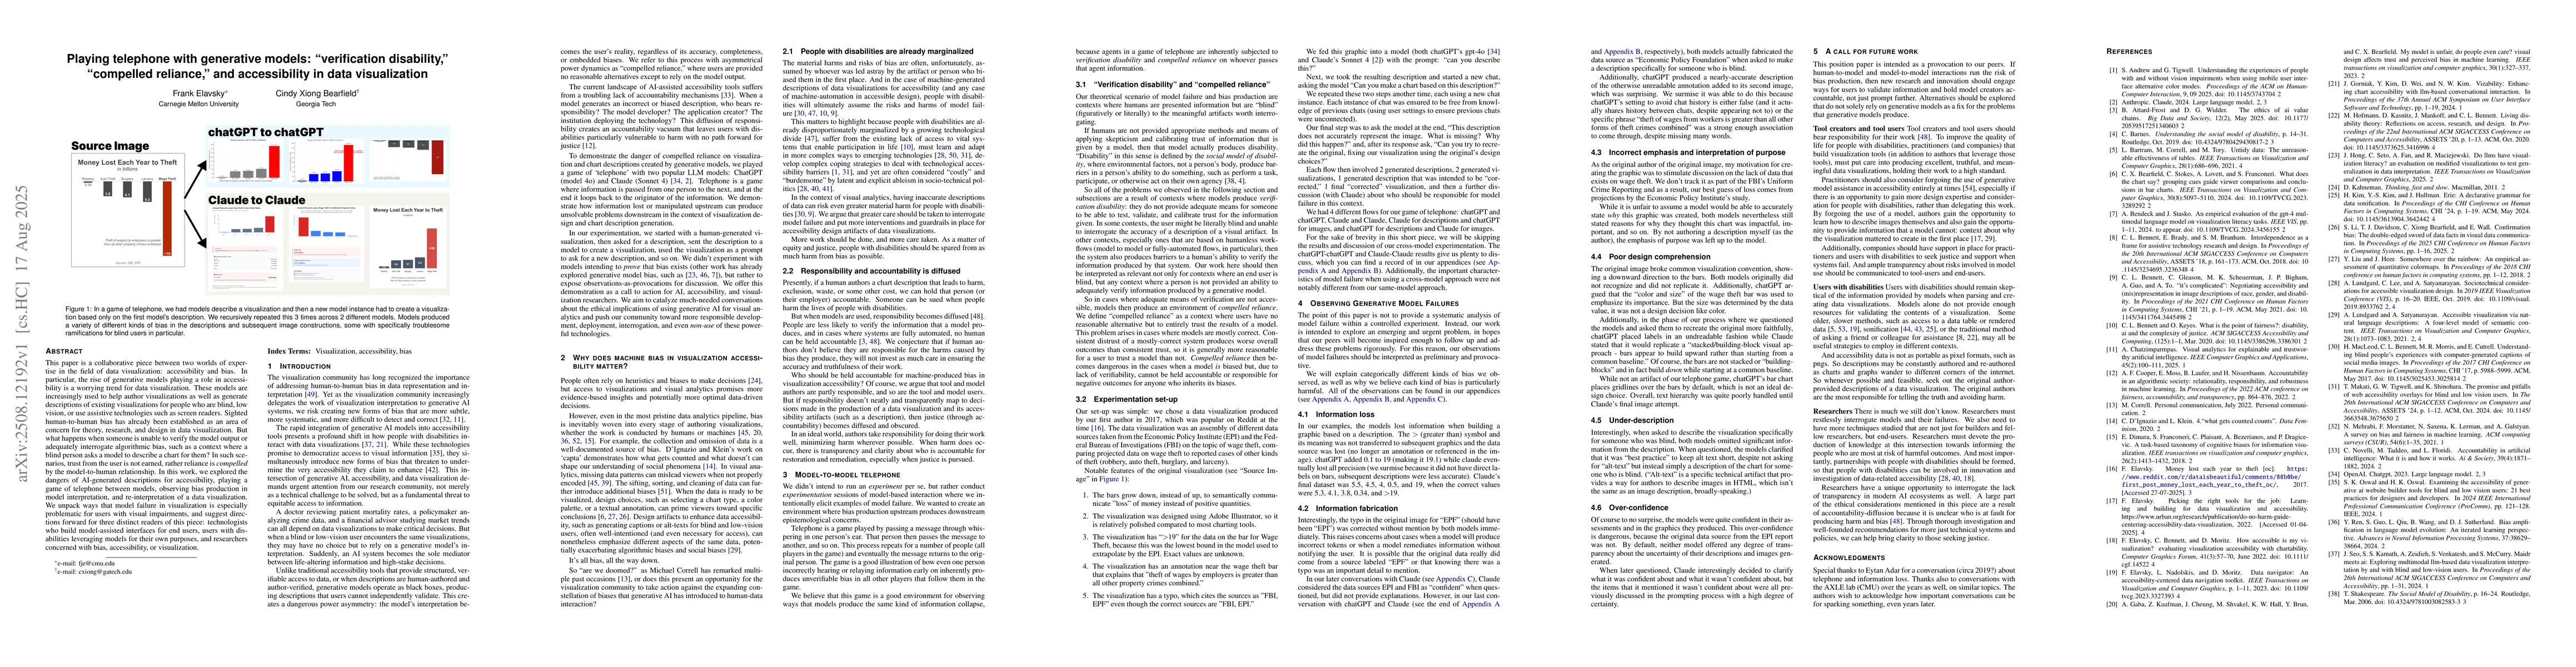
This paper is a collaborative piece between two worlds of expertise in the field of data visualization: accessibility and bias. In particular, the rise of generative models playing a role in accessibi...
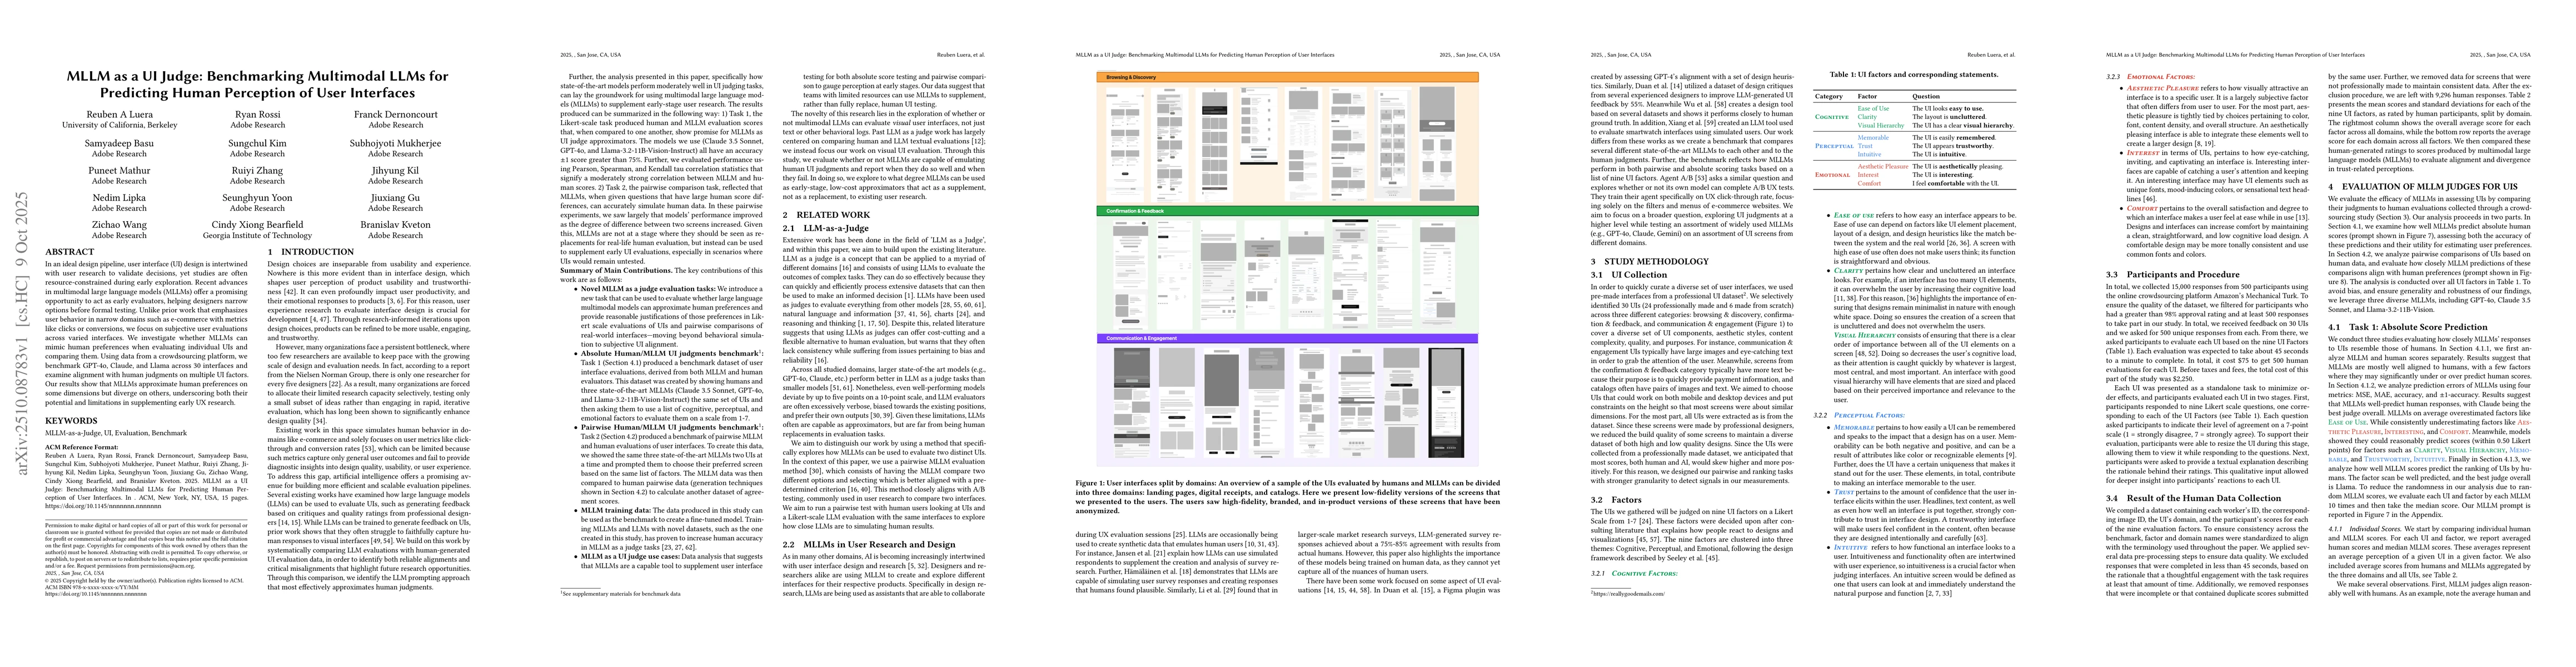
In an ideal design pipeline, user interface (UI) design is intertwined with user research to validate decisions, yet studies are often resource-constrained during early exploration. Recent advances in...
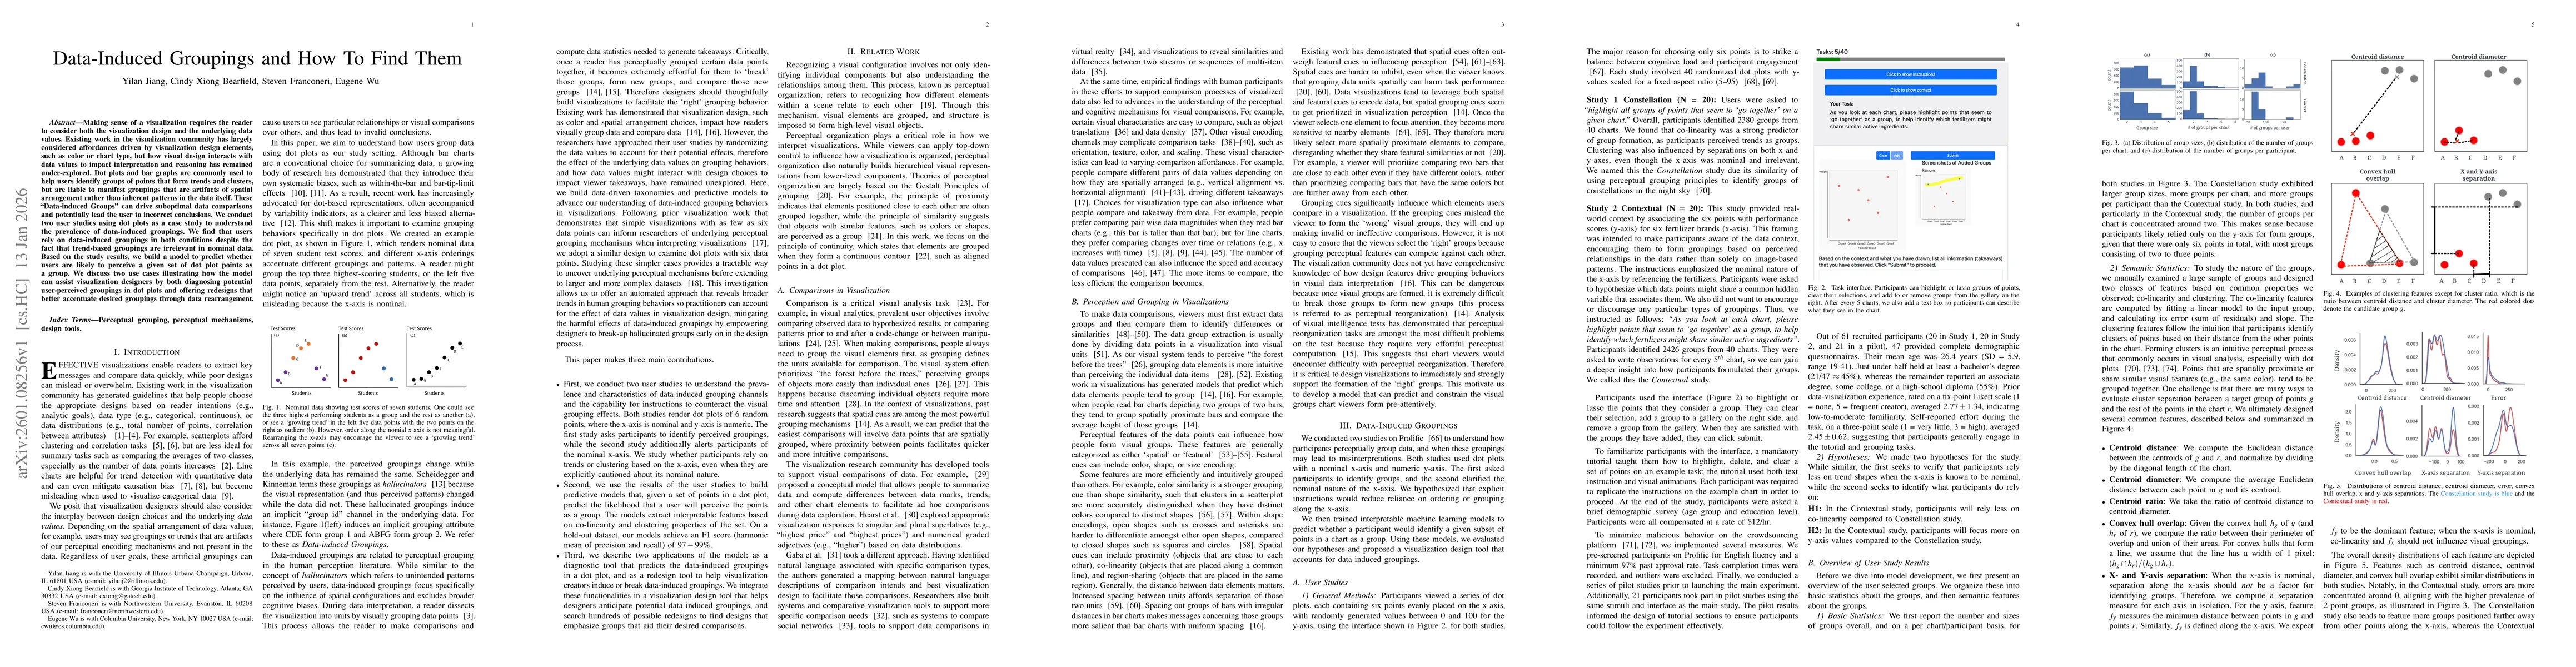
Making sense of a visualization requires the reader to consider both the visualization design and the underlying data values. Existing work in the visualization community has largely considered afford...