ArxivLens

Quick Summary:

This paper investigates how visual design choices in machine learning model visualizations influence stakeholder perceptions of bias, trust, and adoption. Through experiments with over 1,500 participants, it finds that visual design significantly affects fairness prioritization, with gender differences noted, and textual explanations being more impactful than visual representations. The study provides insights for designing effective visualization systems to enhance trust in machine learning models.

Journal Reference: IEEE TVCG 30(1):327-337
DOI: 10.1109/TVCG.2023.3327192
arXiv Id: 2308.03299
Comments: 11 pages, 6 figures, to appear in IEEE Transactions of Visualization and Computer Graphics (Also in proceedings of IEEE VIS 2023)
Date Published: 2024-01-12
Date Updated: 2024-01-12

Categories:

Key Terms (TF-IDF):

fairness (0.283)
trust (0.269)
choices (0.219)
perception (0.182)
participants (0.181)
biased (0.175)
machine learning (0.163)
design (0.159)
machine (0.156)
affect (0.156)
visual (0.149)
technology (0.148)
bias (0.145)
support (0.133)
learning (0.123)
example (0.121)
sourced (0.119)
textual (0.117)
models (0.117)
cognitive (0.114)
License: http://arxiv.org/licenses/nonexclusive-distrib/1.0/

Summary:

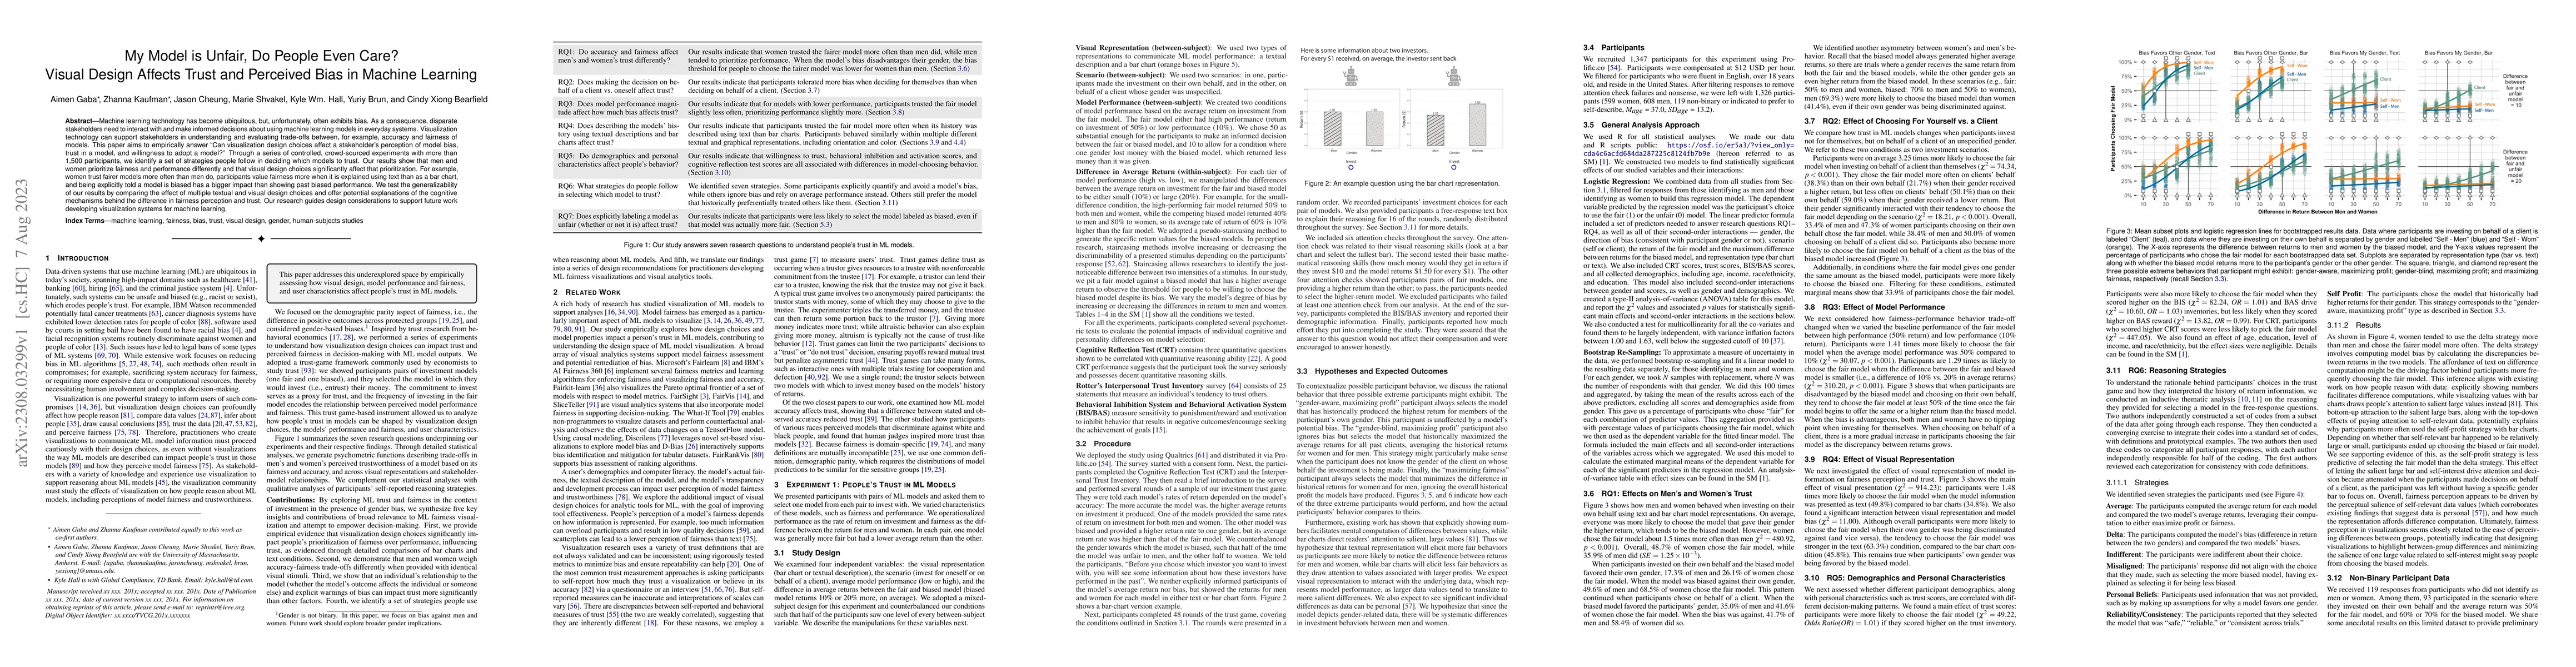
Machine learning technology has become ubiquitous, but, unfortunately, often exhibits bias. As a consequence, disparate stakeholders need to interact with and make informed decisions about using machine learning models in everyday systems. Visualization technology can support stakeholders in understanding and evaluating trade-offs between, for example, accuracy and fairness of models. This paper aims to empirically answer "Can visualization design choices affect a stakeholder's perception of model bias, trust in a model, and willingness to adopt a model?" Through a series of controlled, crowd-sourced experiments with more than 1,500 participants, we identify a set of strategies people follow in deciding which models to trust. Our results show that men and women prioritize fairness and performance differently and that visual design choices significantly affect that prioritization. For example, women trust fairer models more often than men do, participants value fairness more when it is explained using text than as a bar chart, and being explicitly told a model is biased has a bigger impact than showing past biased performance. We test the generalizability of our results by comparing the effect of multiple textual and visual design choices and offer potential explanations of the cognitive mechanisms behind the difference in fairness perception and trust. Our research guides design considerations to support future work developing visualization systems for machine learning.

Citation & Reference Network Visualization

This graph shows how this paper is connected to other research. The current paper is shown in dark gray, papers that cite it are in green, and papers it references are in blue. You can:

Current Paper
Papers citing this work (Citations)
Papers cited by this work (References)

• Hover over any node to see the paper title

• Click a node to view that paper's details

• Drag nodes to rearrange the graph

• Use the zoom controls (bottom right) to zoom in/out

Citations and References

Title Authors Year Actions
Do You"Trust"This Visualization? An Inventory to Measure Trust in Visualizations
Huichen Will Wang, Kylie Lin, Andrew Cohen, Ryan Kennedy, Zach Zwald, Carolina Nobre, Cindy Xiong Bearfield
2025
View Paper
Designing and Evaluating Sampling Strategies for Multiple-Forecast Visualization (MFV)
Ruishi Zou, Siyi Wu, Bingsheng Yao, Dakuo Wang, Lace M. Padilla
2024
View Paper
Face the Facts: Using Face Averaging to Visualize Gender-by-Race Bias in Facial Analysis Algorithms
Kentrell Owens, Erin Freiburger, Ryan J. Hutchings, Mattea Sim, Kurt Hugenberg, Franziska Roesner, Tadayoshi Kohno
2024
View Paper
"Must Be a Tuesday": Affect, Attribution, and Geographic Variability in Equity-Oriented Visualizations of Population Health Disparities
Eli Holder, Lace M. Padilla
2024
View Paper
Does the Infamous Pie Chart Really Hurt Decision-Making in the Real World? Assessing the Role of Visualization in High-Level Academic Decisions
Yixuan Li, E. Berger, Minsuk Kahng, Cindy Xiong Bearfield
2024
View Paper
Co-designing an AI Impact Assessment Report Template with AI Practitioners and AI Compliance Experts
E. Bogucka, Marios Constantinides, S. Šćepanović, Daniele Quercia
2024
View Paper
A Typology of Decision-Making Tasks for Visualization
C. Brumar, Sam Molnar, G. Appleby, Kristi Potter, Remco Chang
2024
View Paper
Same Data, Diverging Perspectives: The Power of Visualizations to Elicit Competing Interpretations
Cindy Xiong Bearfield, Lisanne Van Weelden, Adam Waytz, Steven Franconeri
2024
View Paper
Subjective visualization experiences: impact of visual design and experimental design
Laura Koesten, Drew Dimmery, Michael Gleicher, Torsten Moller
2023
View Paper
A Literature Review on Applications of Explainable Artificial Intelligence (XAI)
Khushi Kalasampath, K. N. Spoorthi, S. Sajeev, Sahil Sarma Kuppa, Kavya Ajay, Angulakshmi Maruthamuthu
2025
View Paper

Comments (0)

This website uses cookies to ensure you get the best experience. Learn more