Quick Summary:

This paper explores how text annotations in visualizations influence perceptions of bias and predictions, finding that while text minimally affects trend predictions, it significantly impacts perceived author bias. The study also introduces a method for crowdsourced creation of varied chart annotations, emphasizing the need for careful design to avoid polarizing readers.

Summary

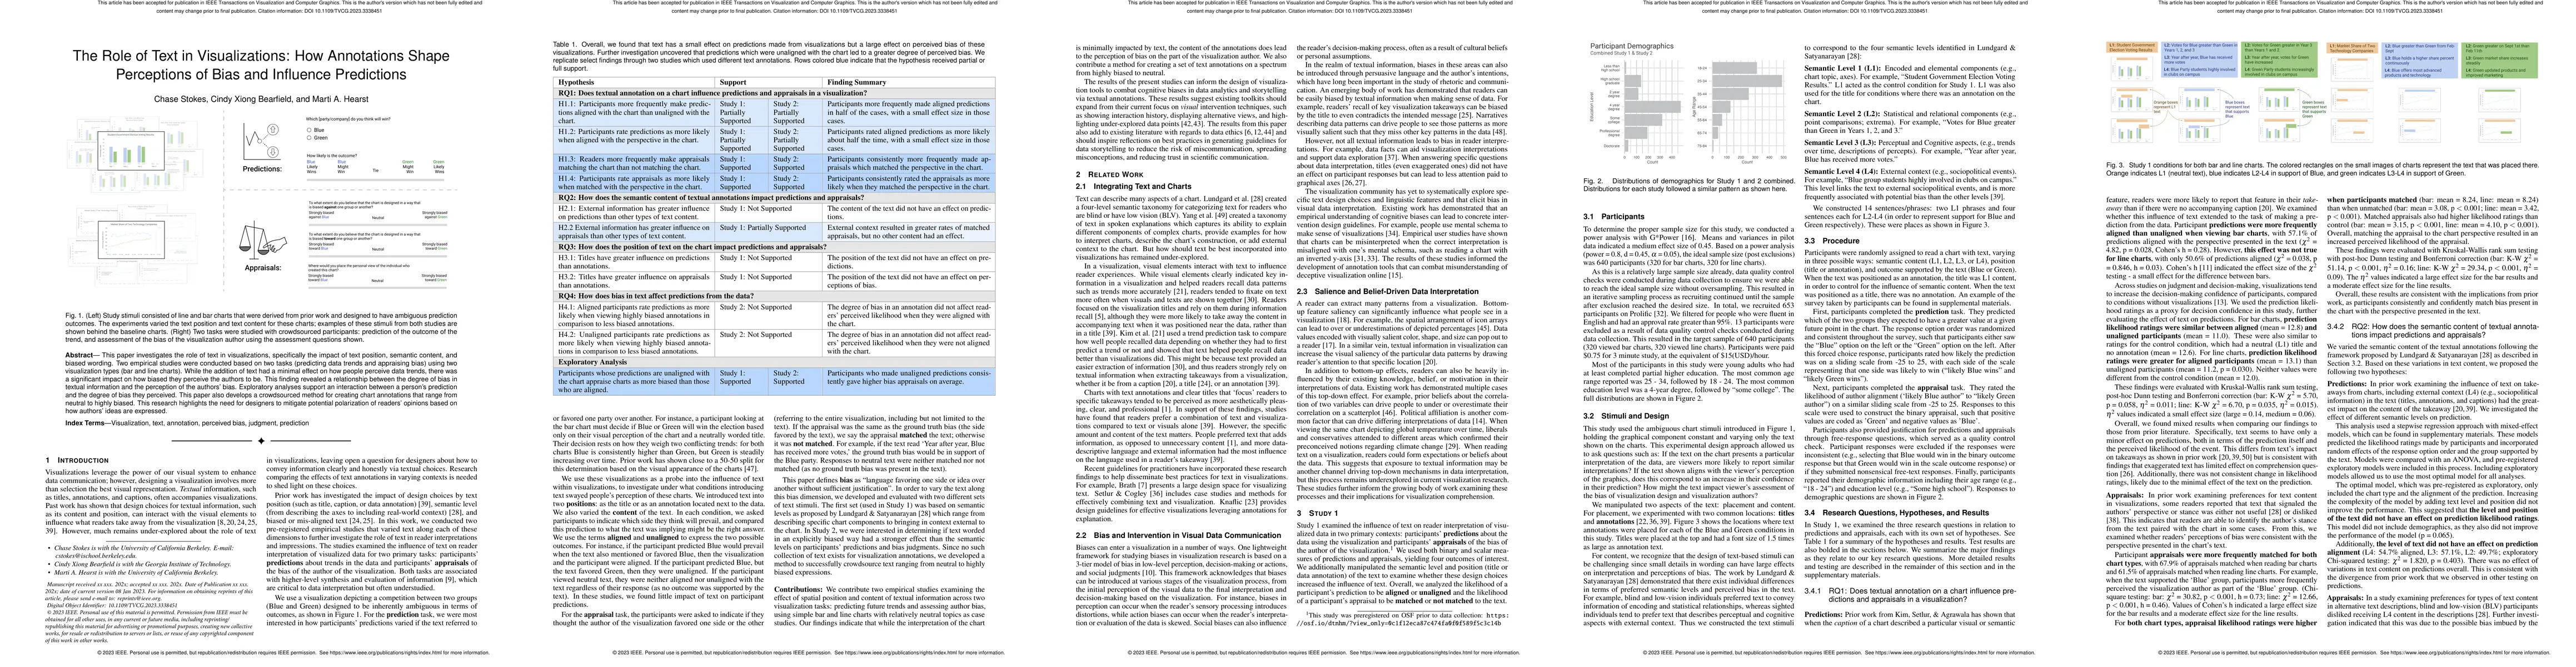
This paper investigates the role of text in visualizations, specifically the impact of text position, semantic content, and biased wording. Two empirical studies were conducted based on two tasks (predicting data trends and appraising bias) using two visualization types (bar and line charts). While the addition of text had a minimal effect on how people perceive data trends, there was a significant impact on how biased they perceive the authors to be. This finding revealed a relationship between the degree of bias in textual information and the perception of the authors' bias. Exploratory analyses support an interaction between a person's prediction and the degree of bias they perceived. This paper also develops a crowdsourced method for creating chart annotations that range from neutral to highly biased. This research highlights the need for designers to mitigate potential polarization of readers' opinions based on how authors' ideas are expressed.

AI Key Findings

Get AI-generated insights about this paper's methodology, results, and significance.

Paper Details

PDF Preview

Download PDF

Key Terms

biased (0.285)
bias (0.269)
authors (0.266)
trends (0.233)
text (0.229)
degree (0.174)
impact (0.169)
textual (0.154)
annotations (0.151)
person (0.146)
highlights (0.143)
perception (0.142)
investigates (0.141)
develops (0.141)
mitigate (0.134)
creating (0.134)
people (0.131)
predicting (0.130)
expressed (0.127)
ideas (0.127)

Citation Network

Current paper (gray), citations (green), references (blue)

Current Paper
Citations
References
Click to view
Title Authors Year Actions
CHART-6: Human-Centered Evaluation of Data Visualization Understanding in Vision-Language Models
Arnav Verma, Kushin Mukherjee, Christopher Potts, Elisa Kreiss, J. E. Fan
2025
View Paper
Confirmation Bias: The Double-Edged Sword of Data Facts in Visual Data Communication
Shiyao Li, Thomas James Davidson, Cindy Xiong Bearfield, Emily Wall
2025
View Paper
Pluto: Authoring Semantically Aligned Text and Charts for Data-Driven Communication
Arjun Srinivasan, V. Setlur, Arvind Satyanarayan
2025
View Paper
The phantom effect in information visualization
Carolina Pereira, Tomás Alves, S. Gama
2024
View Paper
C2: Scalable Auto-Feedback for LLM-based Chart Generation
Woosung Koh, Jang Han Yoon, MinHyung Lee, Youngjin Song, Jaegwan Cho, Jaehyun Kang, Taehyeon Kim, Se-young Yun, Youngjae Yu, Bongshin Lee
2024
View Paper
A Survey on Annotations in Information Visualization: Empirical Insights, Applications, and Challenges
Md Dilshadur Rahman, Bhavana Doppalapudi, Ghulam Jilani Quadri, Paul Rosen
2024
View Paper
Strategic management analysis: from data to strategy diagram by LLM
R. Brath, Adam Bradley, D. Jonker
2024
View Paper
DracoGPT: Extracting Visualization Design Preferences from Large Language Models
Huichen Will Wang, Mitchell Gordon, Leilani Battle, Jeffrey Heer
2024
View Paper
Dash: A Bimodal Data Exploration Tool for Interactive Text and Visualizations
Dennis Bromley, V. Setlur
2024
View Paper
Gridlines Mitigate Sine Illusion in Line Charts
Clayton Knittel, Jane Awuah, Steven Franconeri, Cindy Xiong Bearfield
2024
View Paper
A Qualitative Analysis of Common Practices in Annotations: A Taxonomy and Design Space
Md Dilshadur Rahman, Ghulam Jilani Quadri, Bhavana Doppalapudi, D. Szafir, Paul Rosen
2023
View Paper

Comments (0)

This website uses cookies to ensure you get the best experience. Learn more