Chase Stokes

12 papers on arXiv

Academic Profile

Name: Chase Stokes
Total Papers: 3

Statistics

arXiv Papers 12
Total Publications 3

Papers on arXiv

Thumbnail for Mixing Modes: Active and Passive Integration of Speech, Text, and
  Visualization for Communicating Data Uncertainty

Mixing Modes: Active and Passive Integration of Speech, Text, and Visualization for Communicating Data Uncertainty

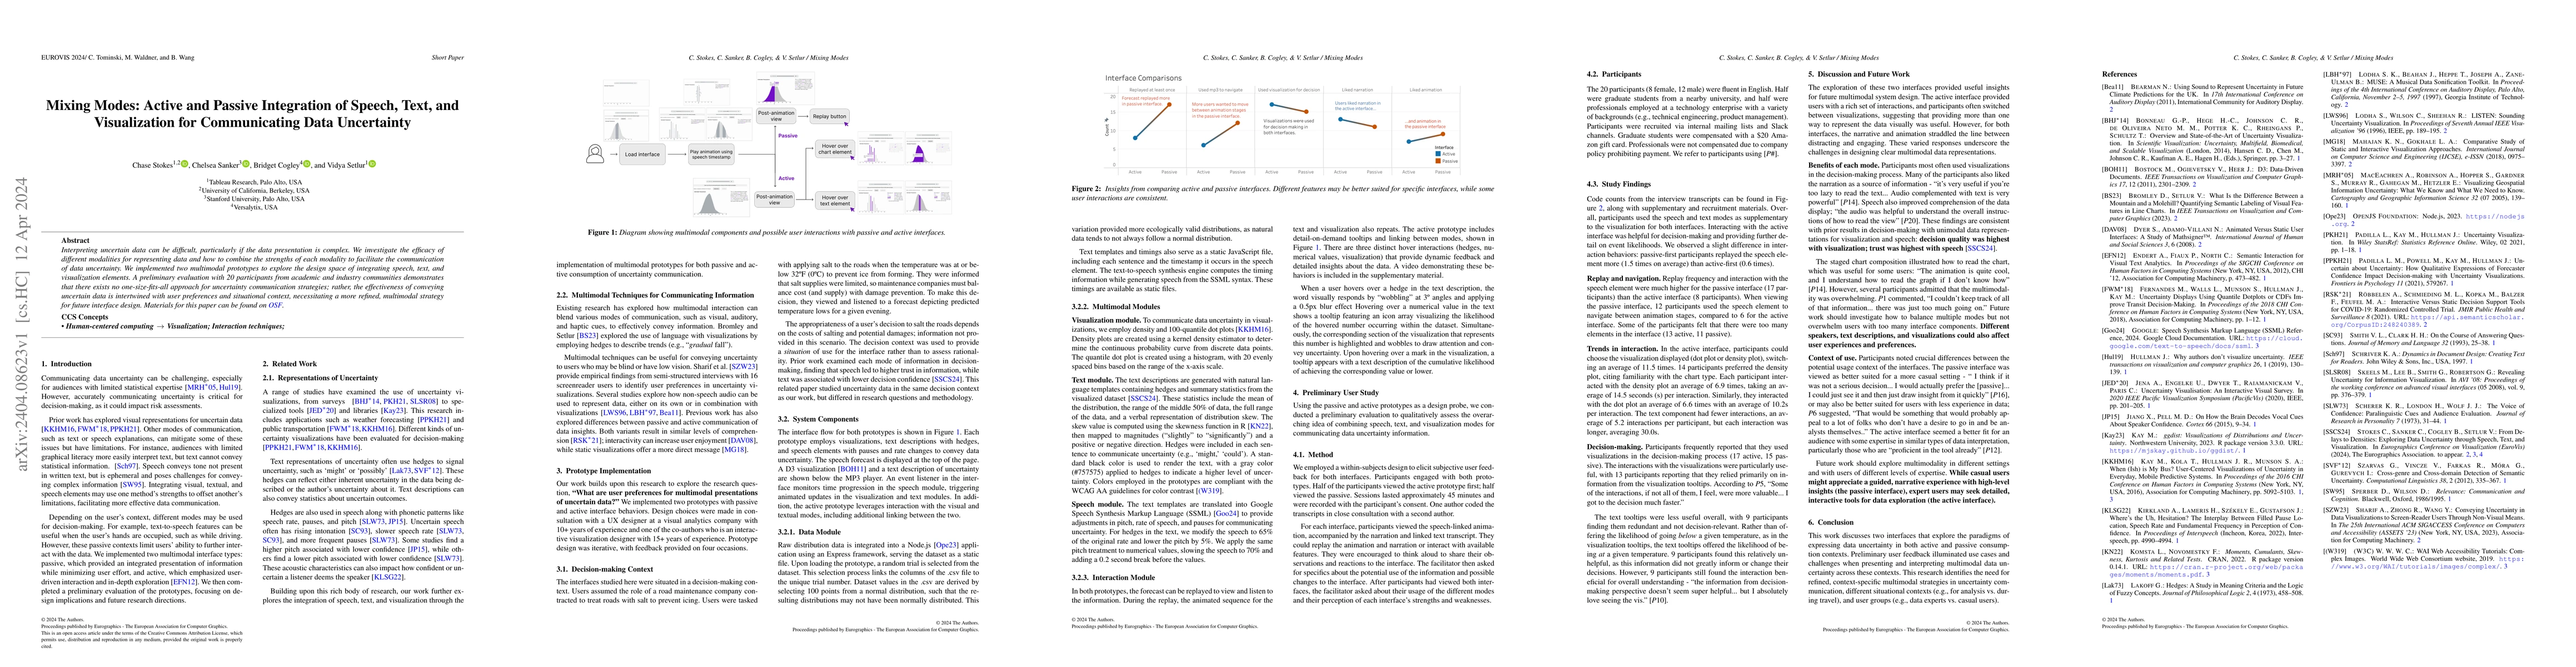
Interpreting uncertain data can be difficult, particularly if the data presentation is complex. We investigate the efficacy of different modalities for representing data and how to combine the stren...

Thumbnail for From Delays to Densities: Exploring Data Uncertainty through Speech,
  Text, and Visualization

From Delays to Densities: Exploring Data Uncertainty through Speech, Text, and Visualization

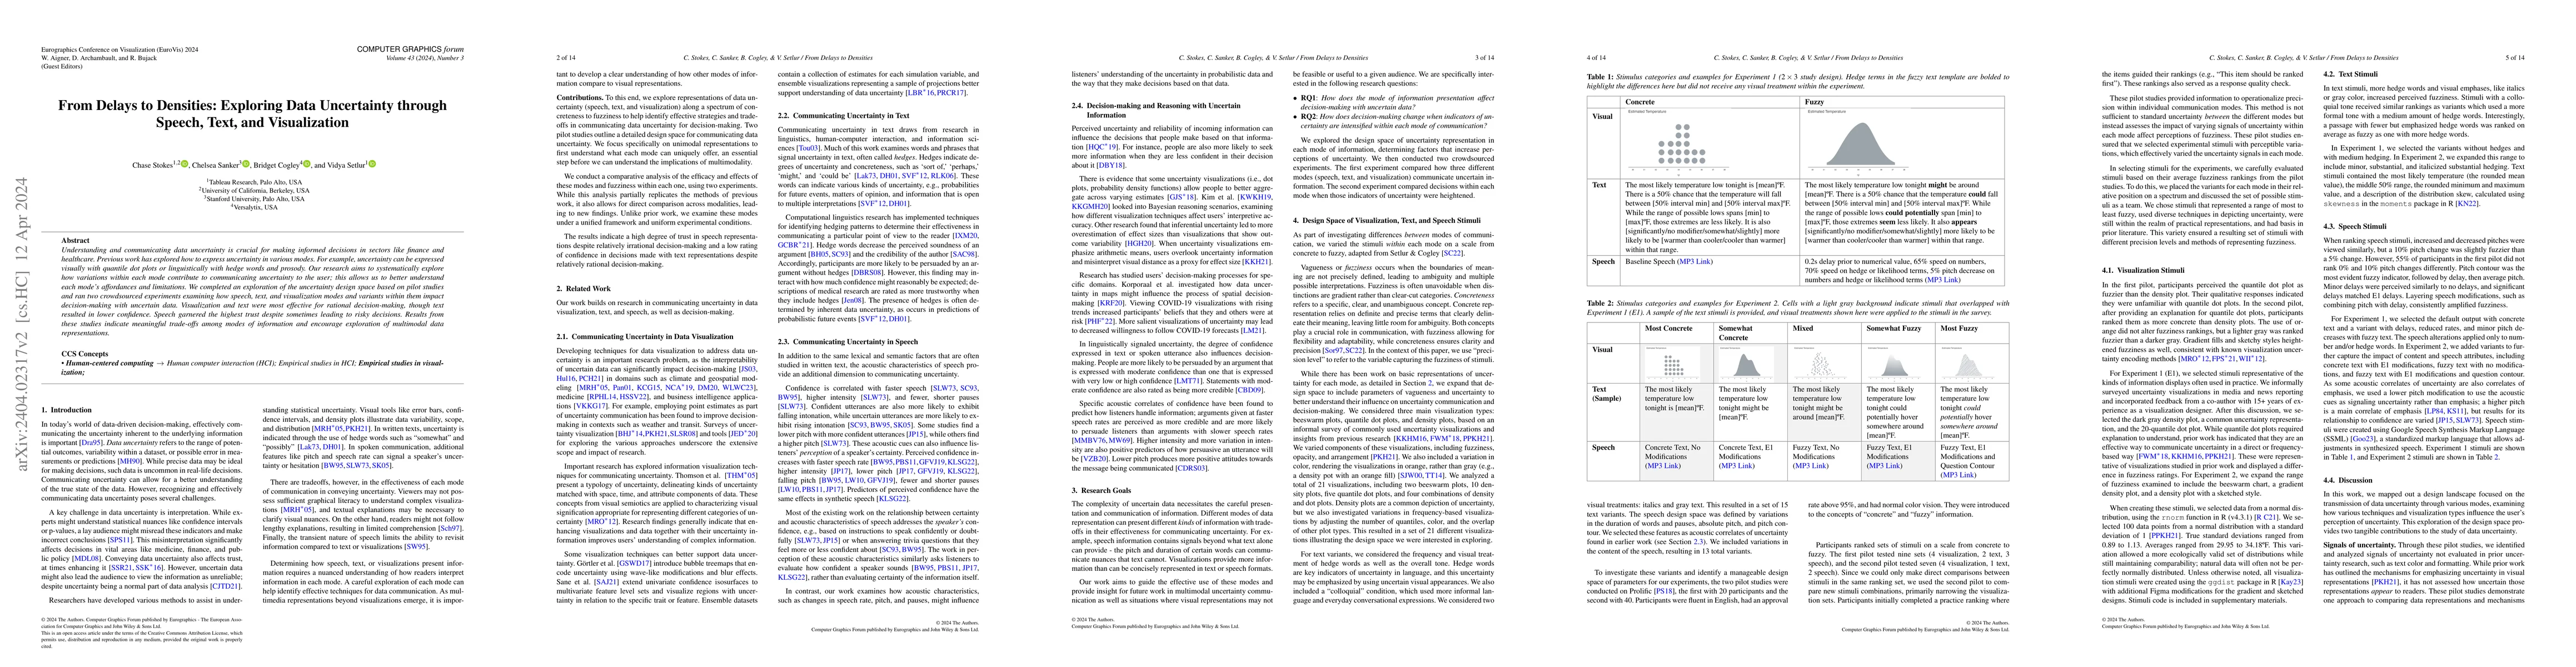
Understanding and communicating data uncertainty is crucial for making informed decisions in sectors like finance and healthcare. Previous work has explored how to express uncertainty in various mod...

Thumbnail for Give Text A Chance: Advocating for Equal Consideration for Language and
  Visualization

Give Text A Chance: Advocating for Equal Consideration for Language and Visualization

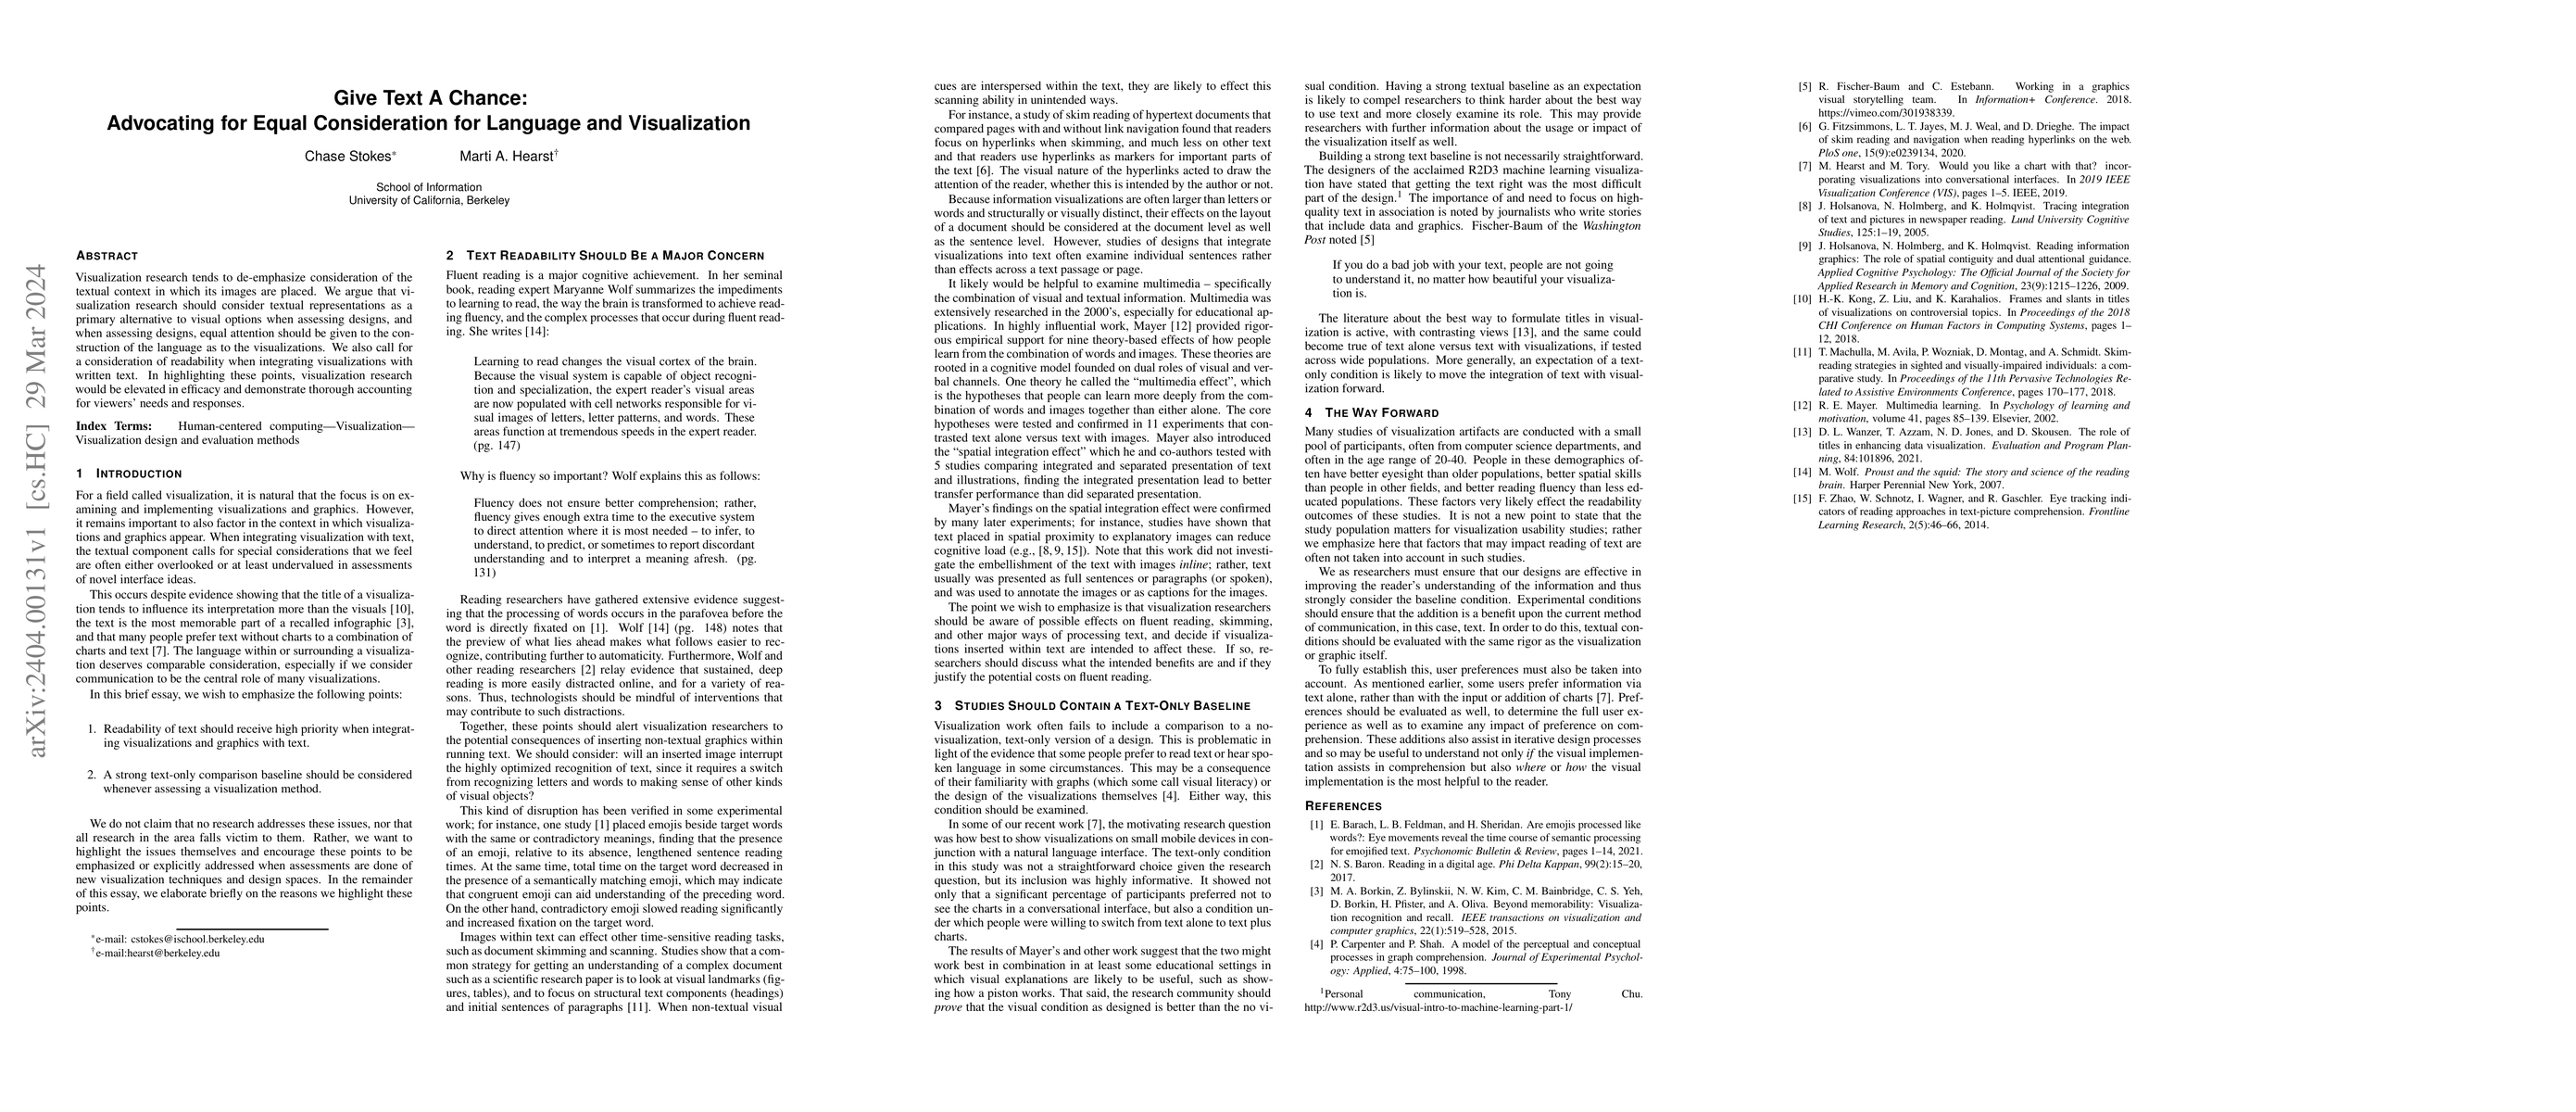
Visualization research tends to de-emphasize consideration of the textual context in which its images are placed. We argue that visualization research should consider textual representations as a pr...

Thumbnail for The Role of Text in Visualizations: How Annotations Shape Perceptions of
  Bias and Influence Predictions

The Role of Text in Visualizations: How Annotations Shape Perceptions of Bias and Influence Predictions

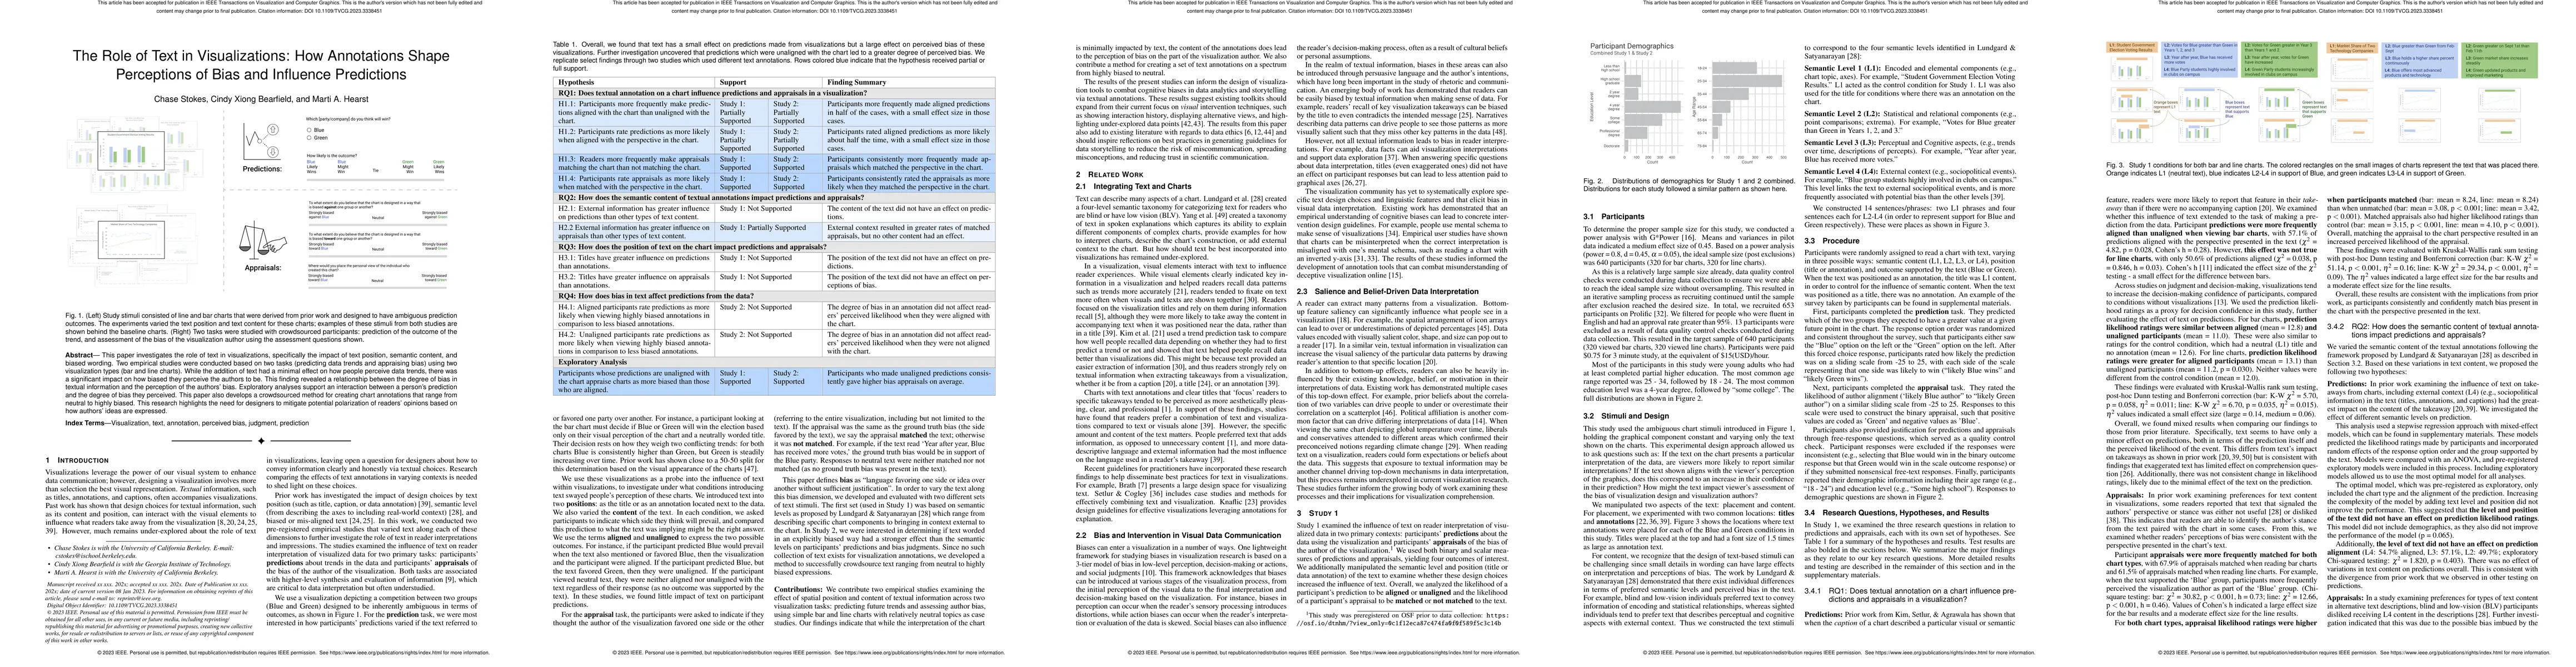
This paper investigates the role of text in visualizations, specifically the impact of text position, semantic content, and biased wording. Two empirical studies were conducted based on two tasks (p...

Thumbnail for What Does the Chart Say? Grouping Cues Guide Viewer Comparisons and
  Conclusions in Bar Charts

What Does the Chart Say? Grouping Cues Guide Viewer Comparisons and Conclusions in Bar Charts

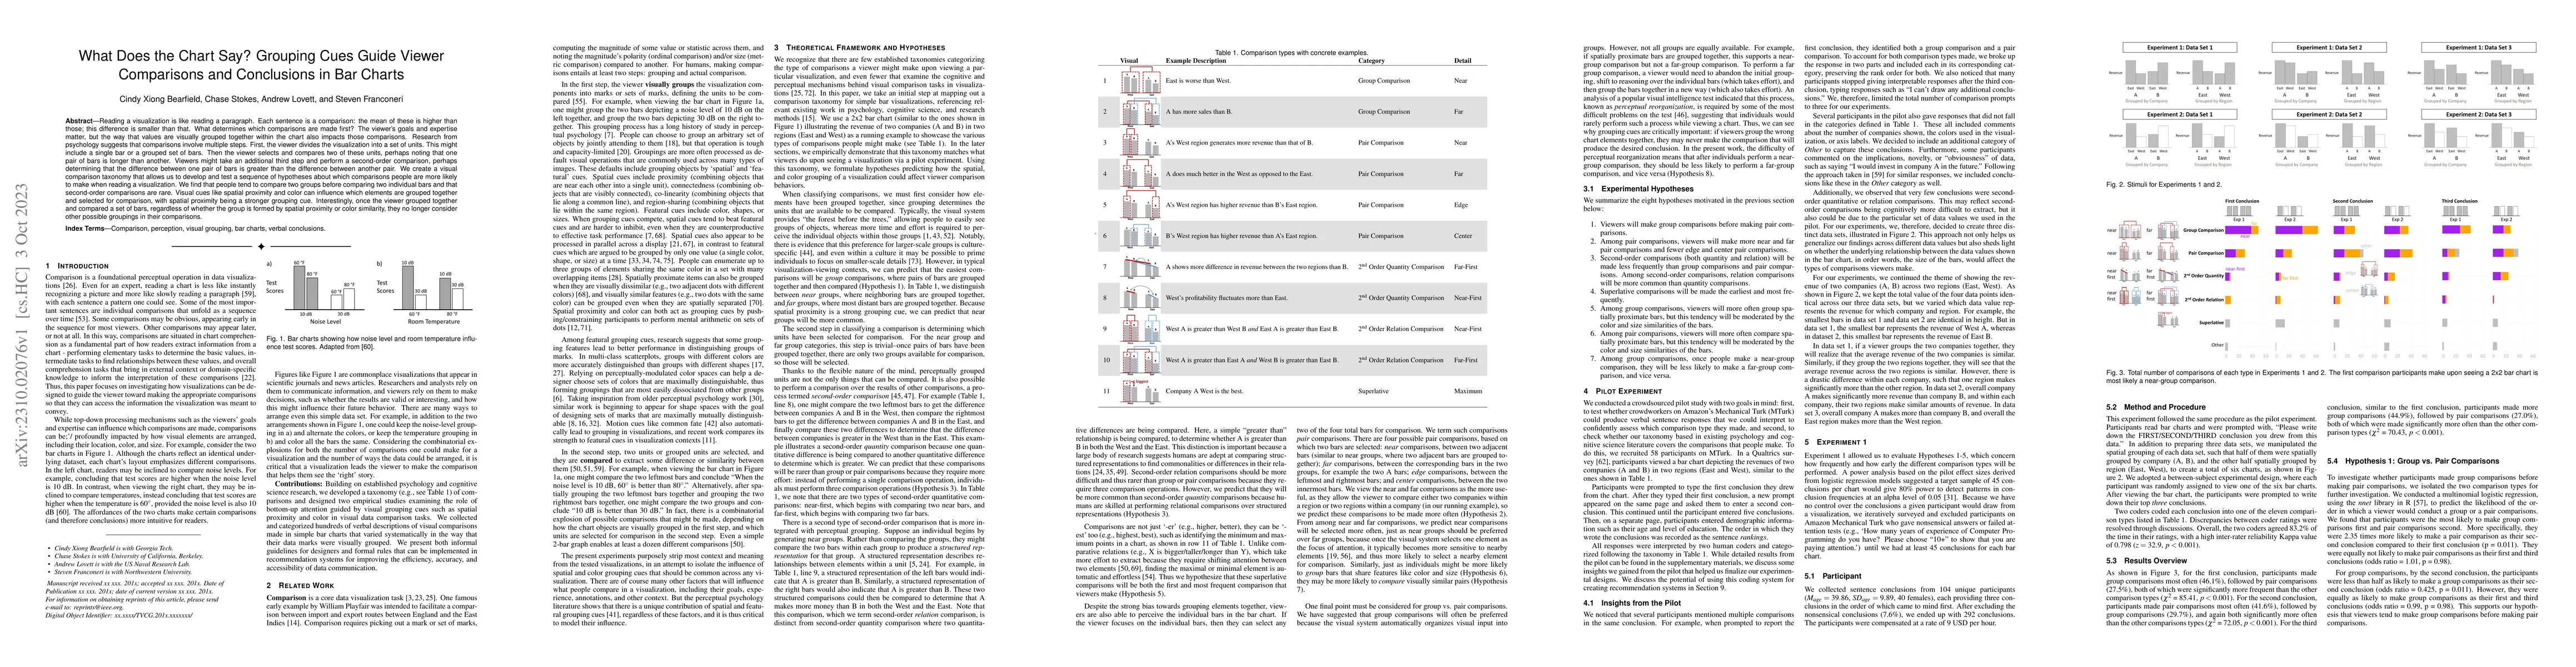
Reading a visualization is like reading a paragraph. Each sentence is a comparison: the mean of these is higher than those; this difference is smaller than that. What determines which comparisons ar...

Thumbnail for Why More Text is (Often) Better: Themes from Reader Preferences for
  Integration of Charts and Text

Why More Text is (Often) Better: Themes from Reader Preferences for Integration of Charts and Text

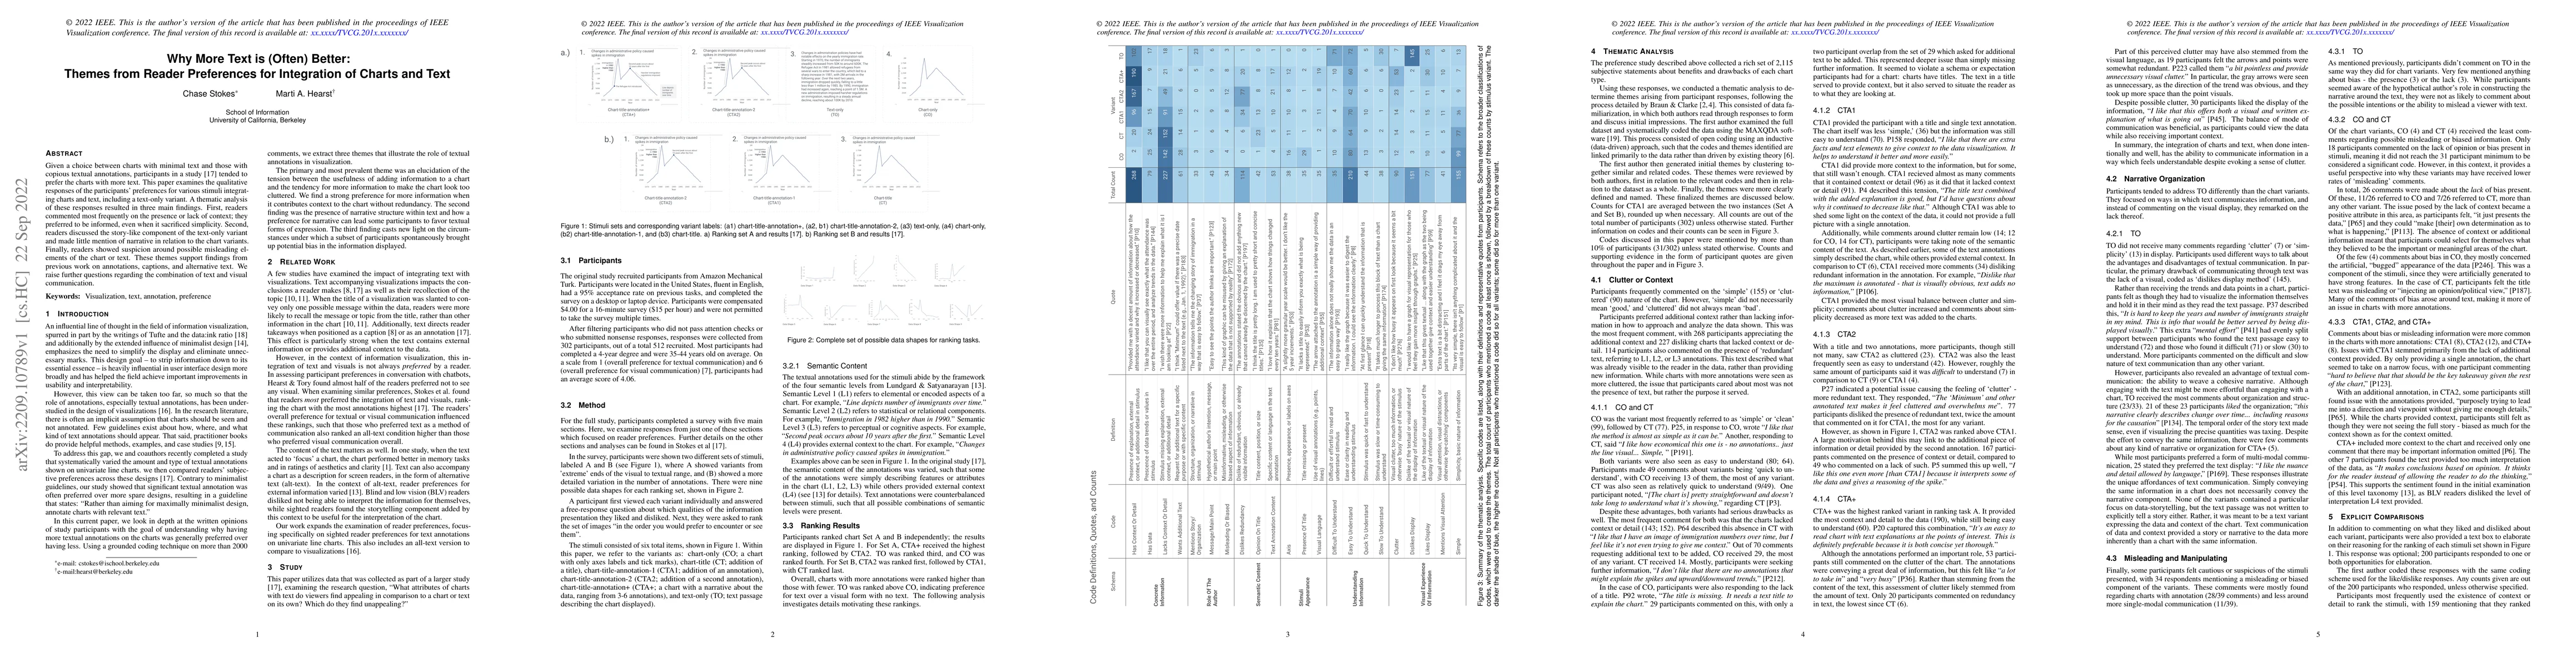
Given a choice between charts with minimal text and those with copious textual annotations, participants in a study (Stokes et al.) tended to prefer the charts with more text. This paper examines th...

Thumbnail for Seeing What You Believe or Believing What You See? Belief Biases
  Correlation Estimation

Seeing What You Believe or Believing What You See? Belief Biases Correlation Estimation

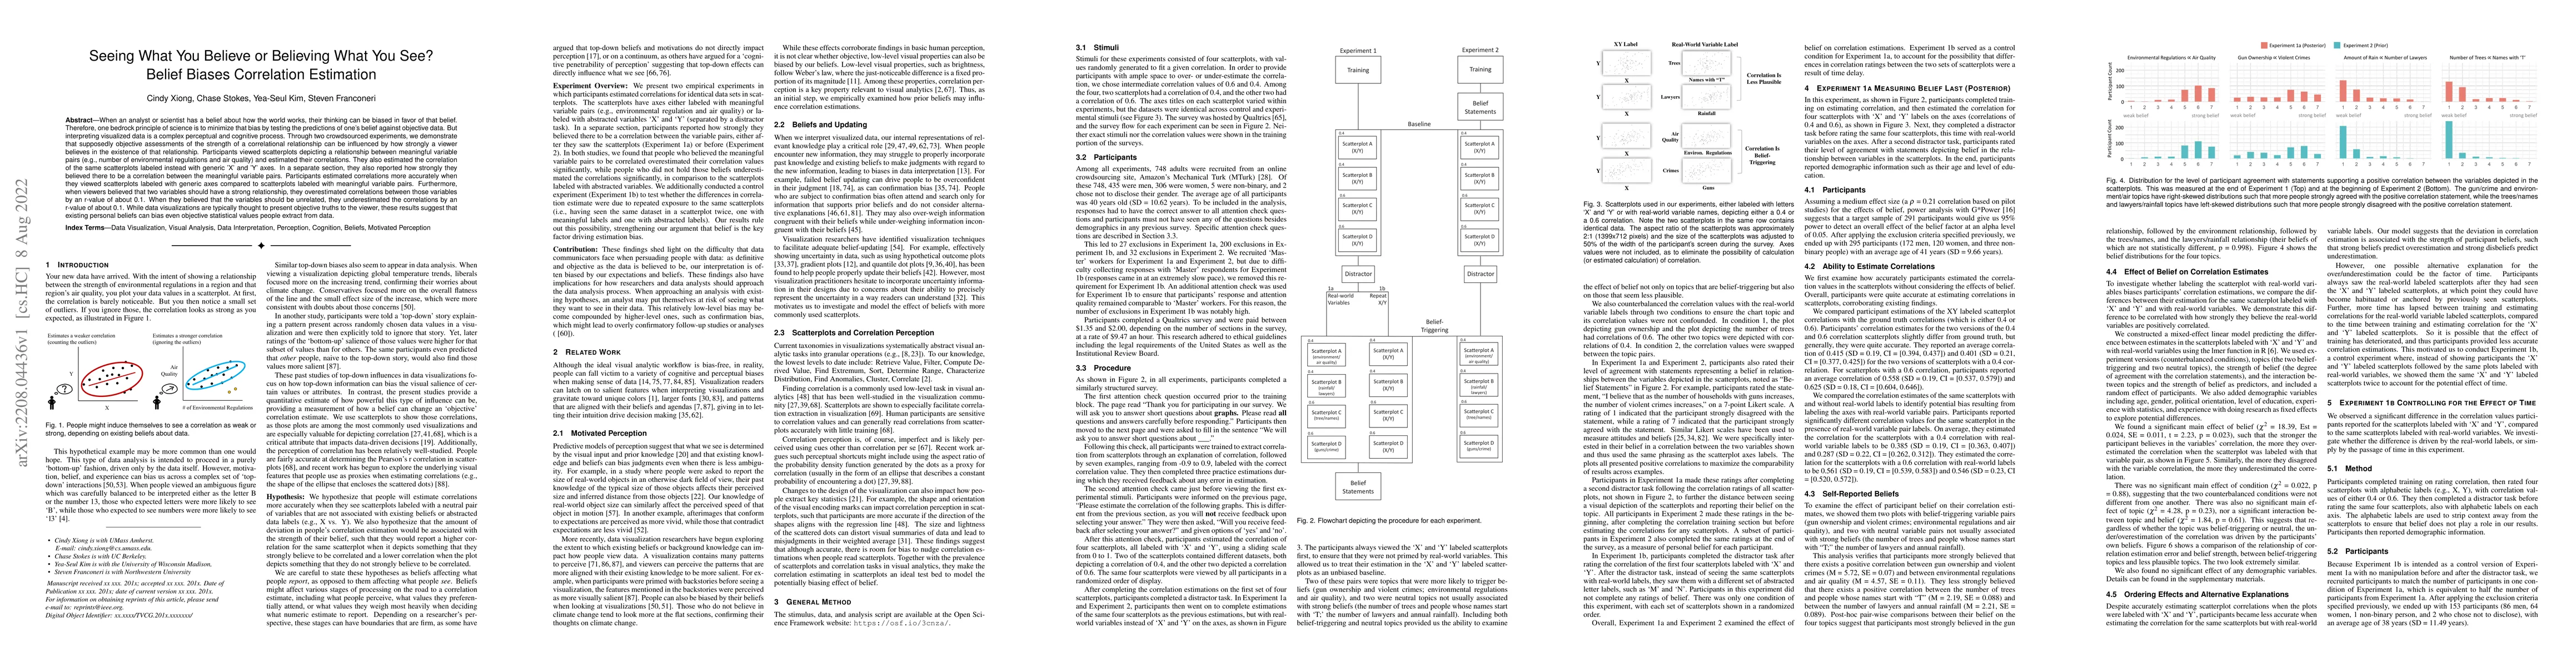
When an analyst or scientist has a belief about how the world works, their thinking can be biased in favor of that belief. Therefore, one bedrock principle of science is to minimize that bias by tes...

Thumbnail for Striking a Balance: Reader Takeaways and Preferences when Integrating
  Text and Charts

Striking a Balance: Reader Takeaways and Preferences when Integrating Text and Charts

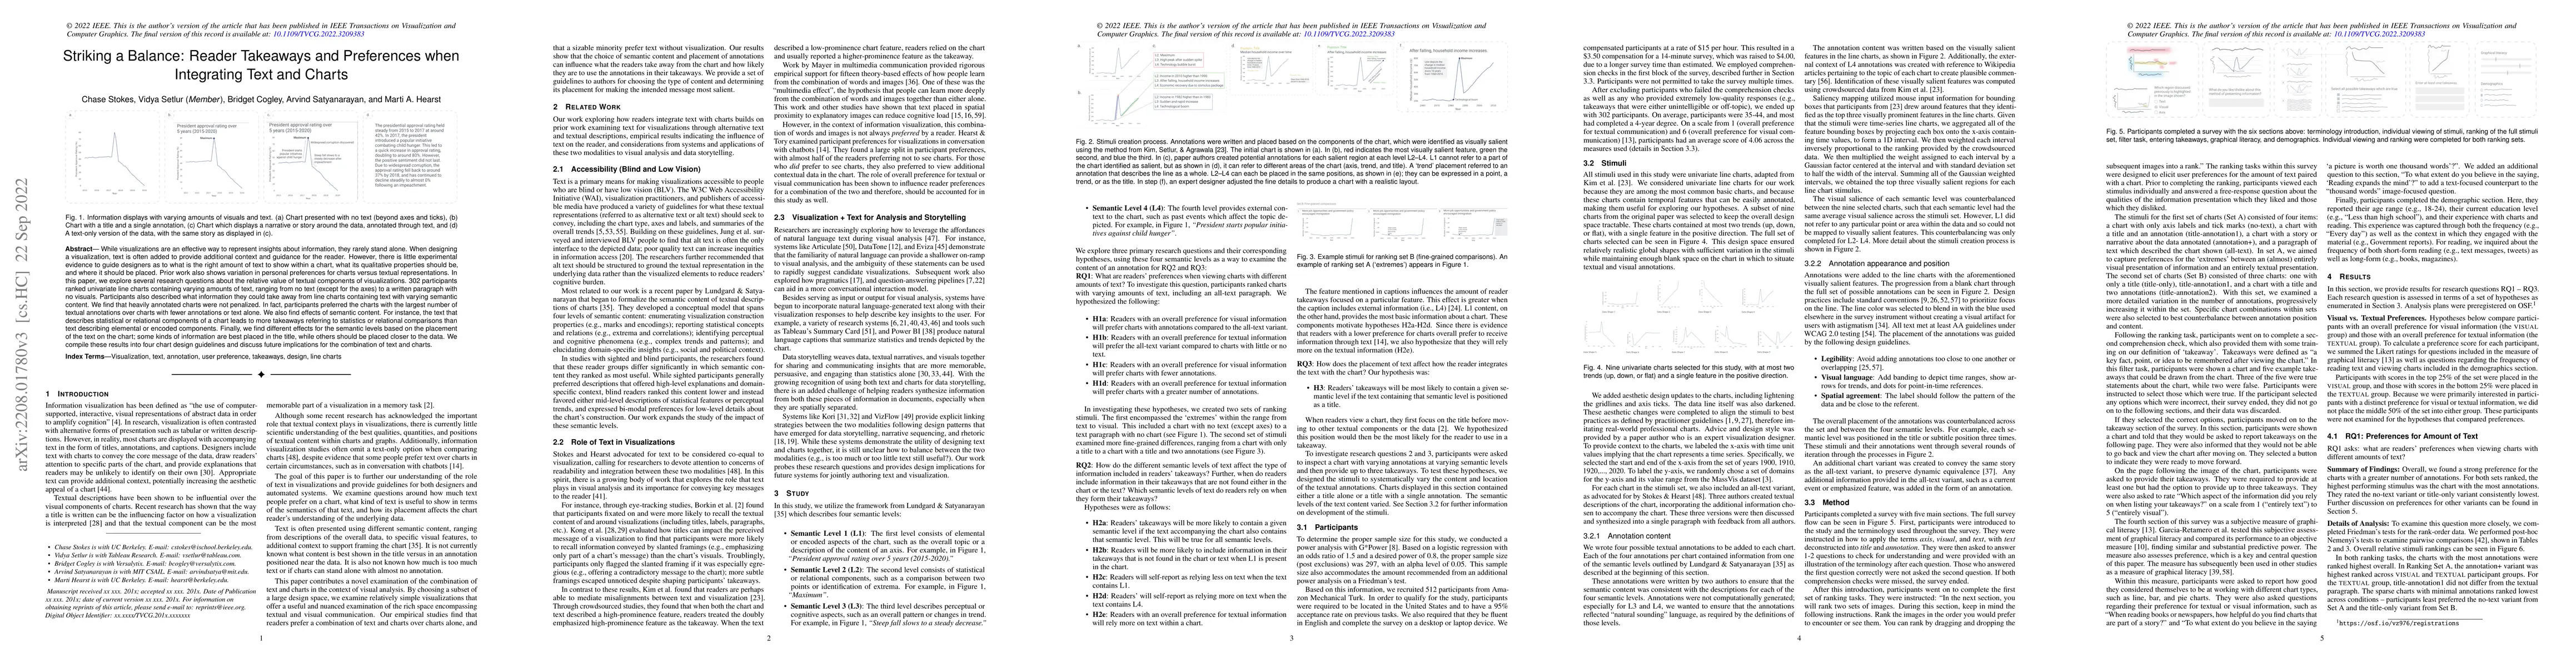
While visualizations are an effective way to represent insights about information, they rarely stand alone. When designing a visualization, text is often added to provide additional context and guid...

Thumbnail for Voicing Uncertainty: How Speech, Text, and Visualizations Influence
  Decisions with Data Uncertainty

Voicing Uncertainty: How Speech, Text, and Visualizations Influence Decisions with Data Uncertainty

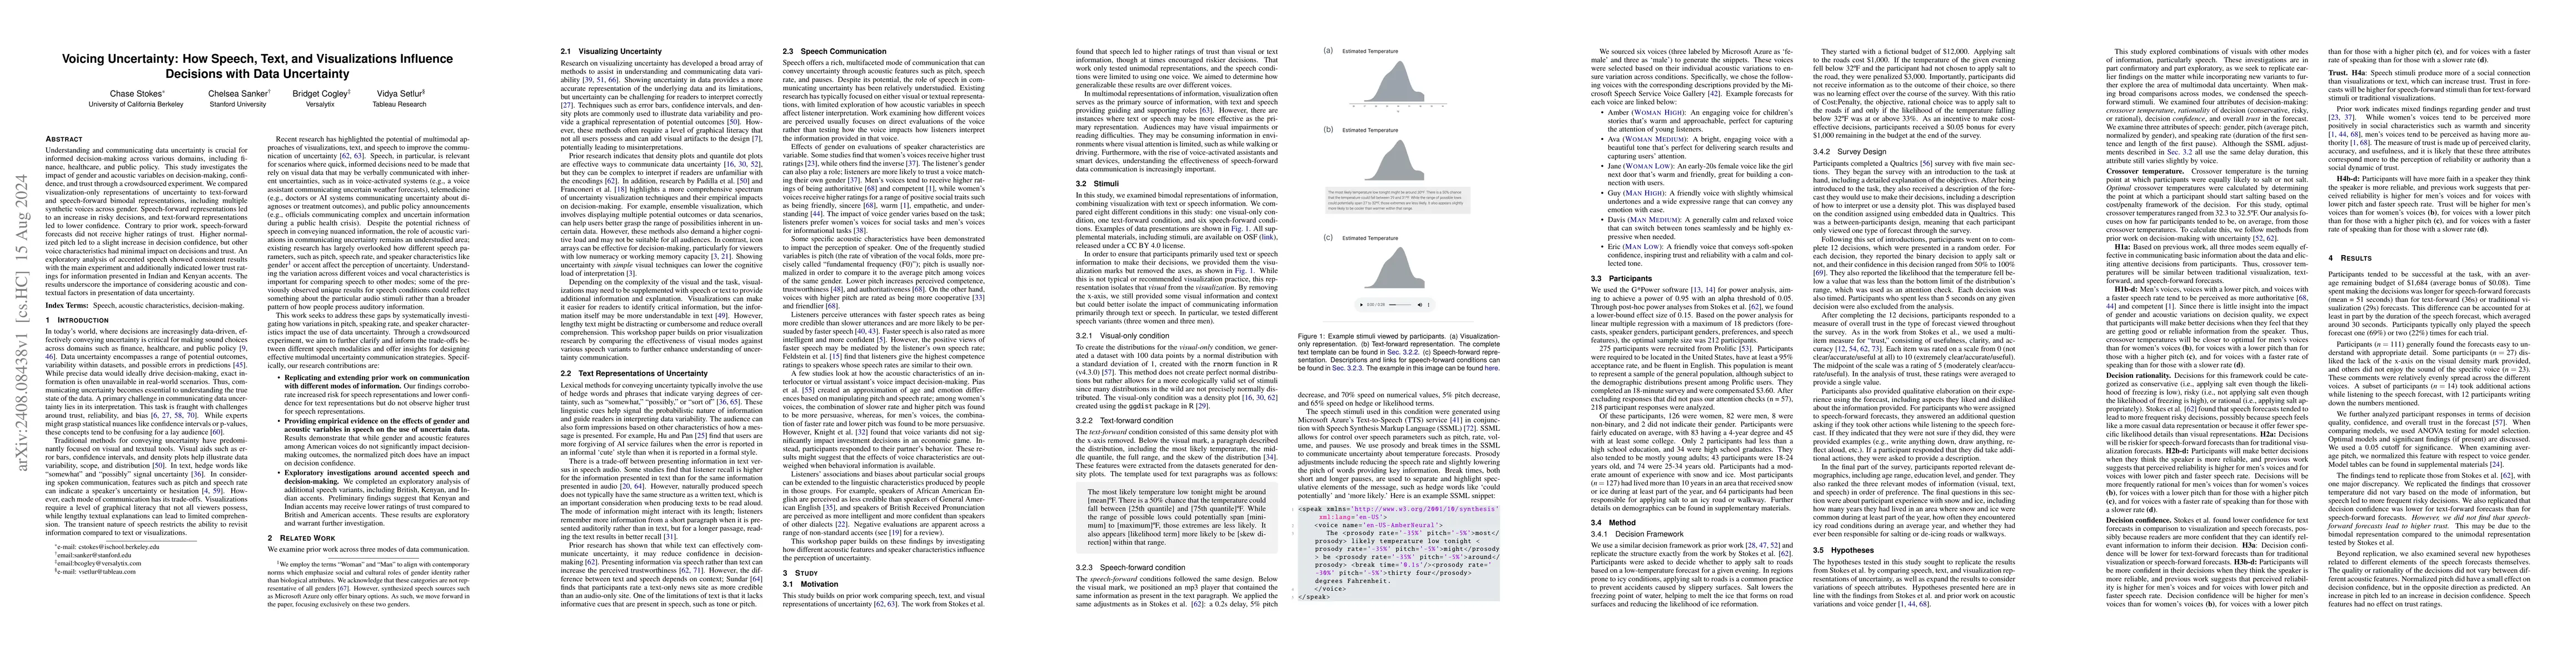
Understanding and communicating data uncertainty is crucial for informed decision-making across various domains, including finance, healthcare, and public policy. This study investigates the impact of...

Thumbnail for "It's a Good Idea to Put It Into Words": Writing `Rudders' in the
  Initial Stages of Visualization Design

"It's a Good Idea to Put It Into Words": Writing `Rudders' in the Initial Stages of Visualization Design

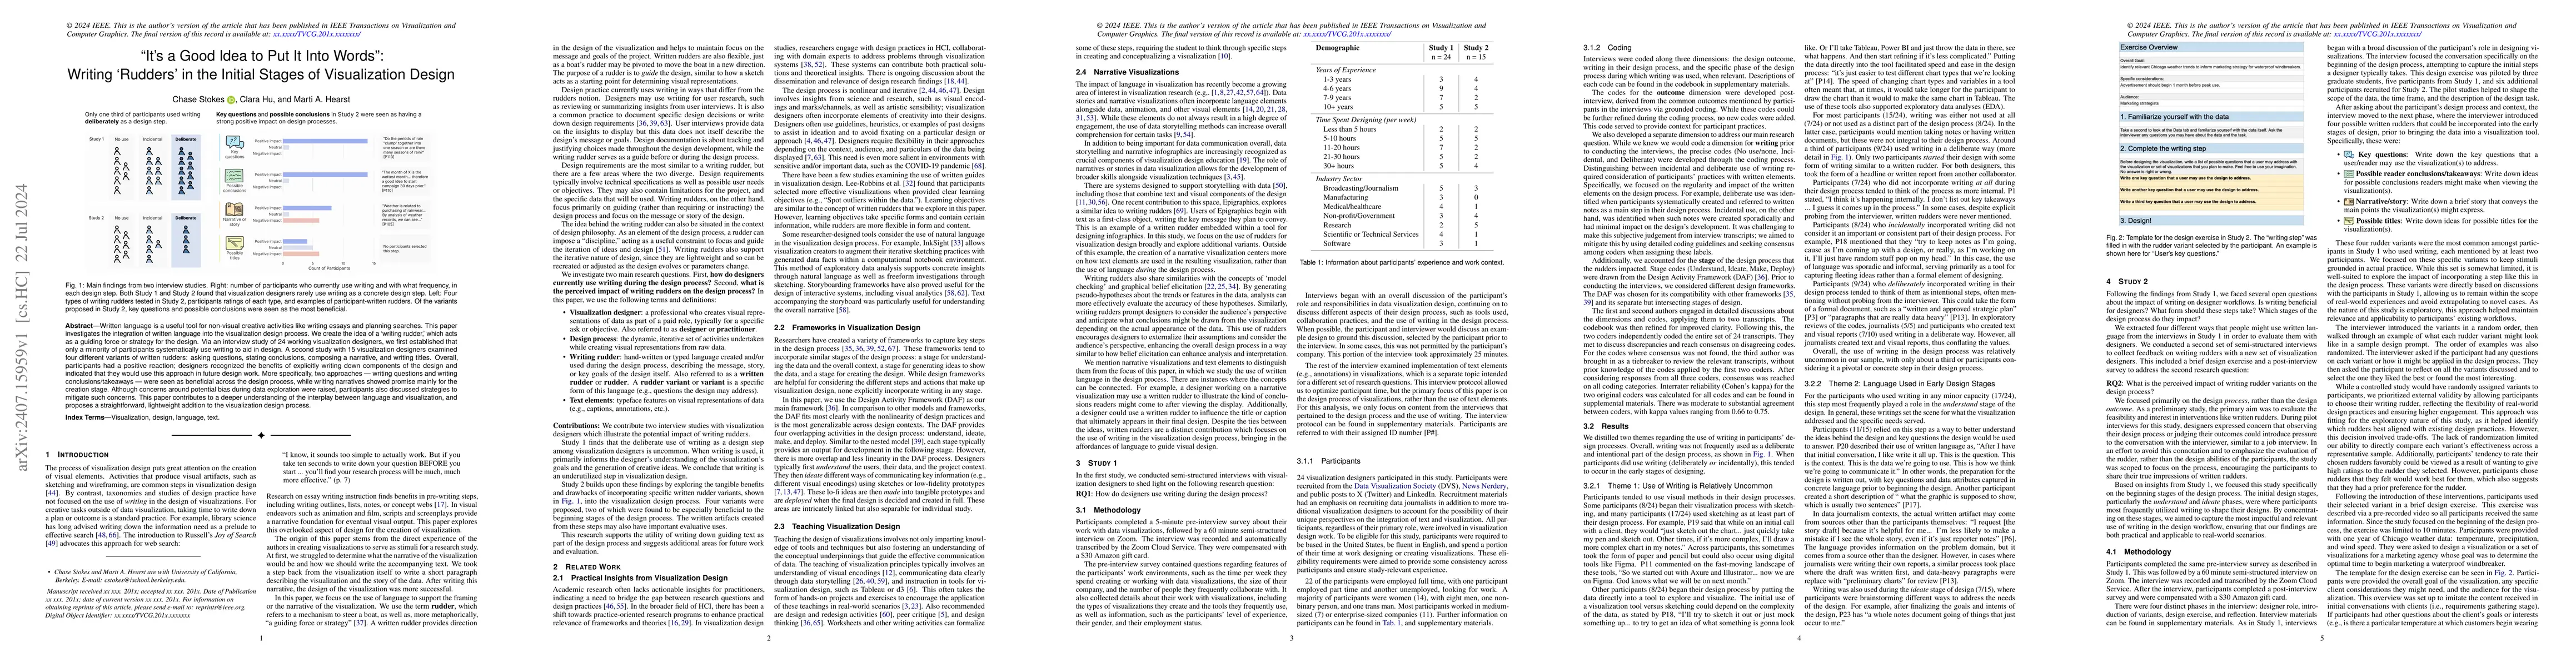
Written language is a useful tool for non-visual creative activities like writing essays and planning searches. This paper investigates the integration of written language in to the visualization desi...

Thumbnail for An Analysis of Text Functions in Information Visualization

An Analysis of Text Functions in Information Visualization

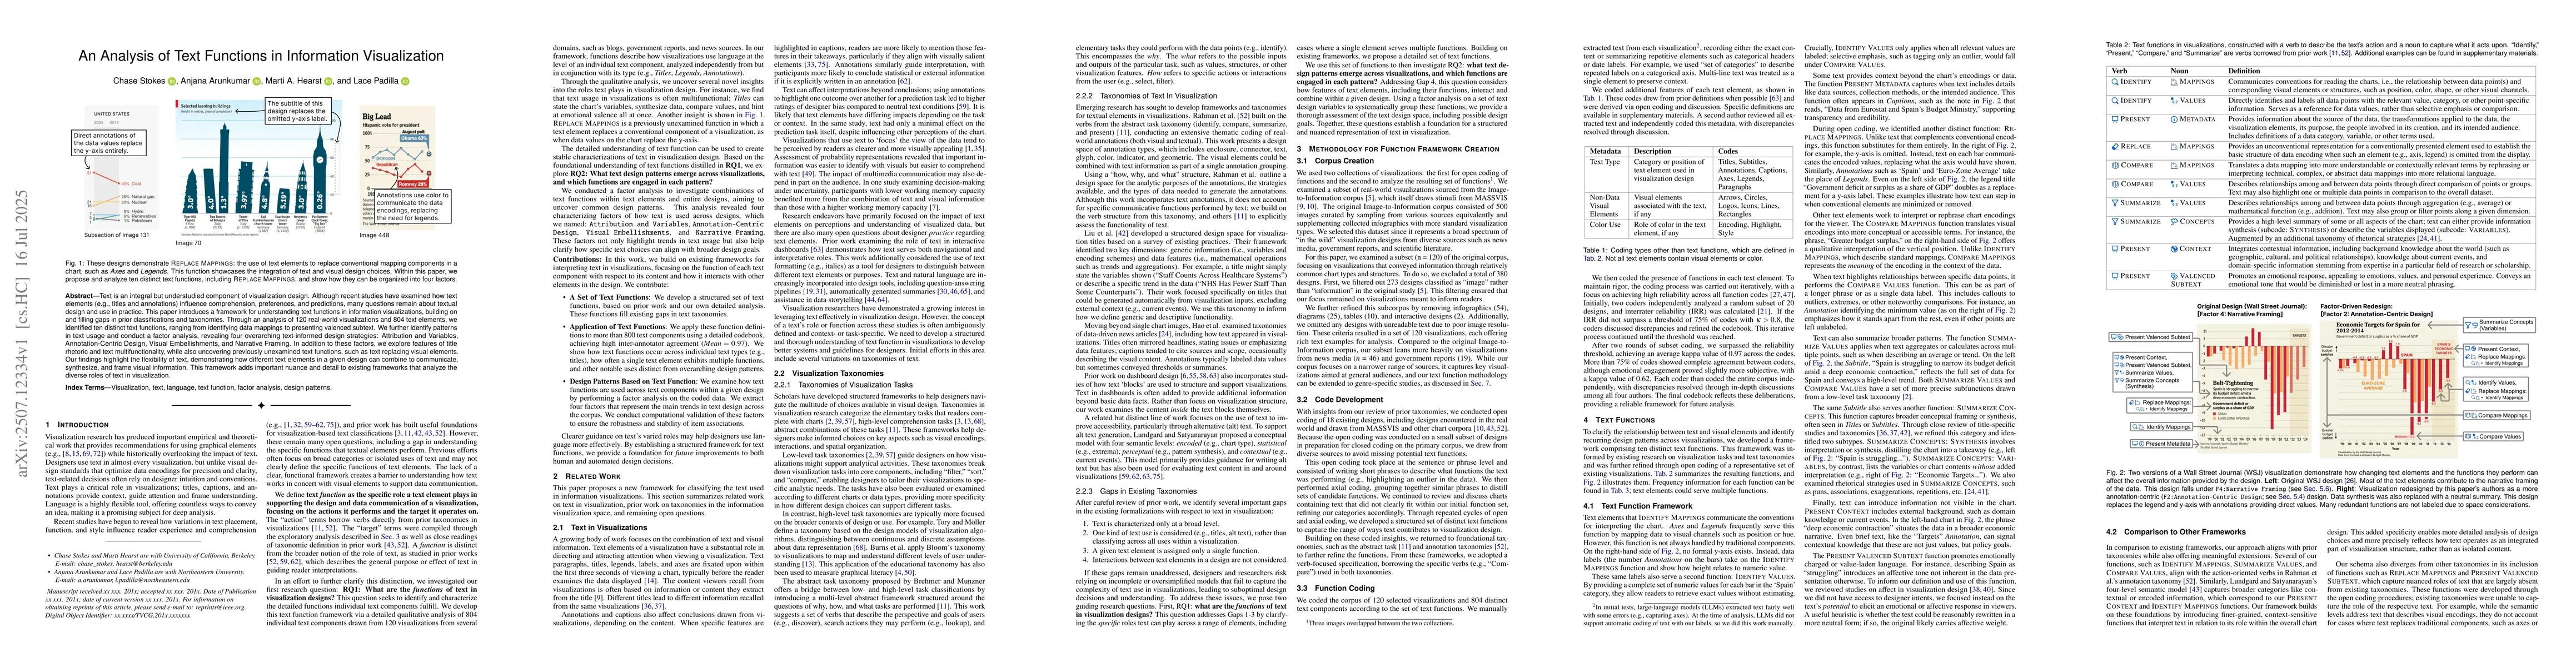
Text is an integral but understudied component of visualization design. Although recent studies have examined how text elements (e.g., titles and annotations) influence comprehension, preferences, and...

Thumbnail for Write, Rank, or Rate: Comparing Methods for Studying Visualization
  Affordances

Write, Rank, or Rate: Comparing Methods for Studying Visualization Affordances

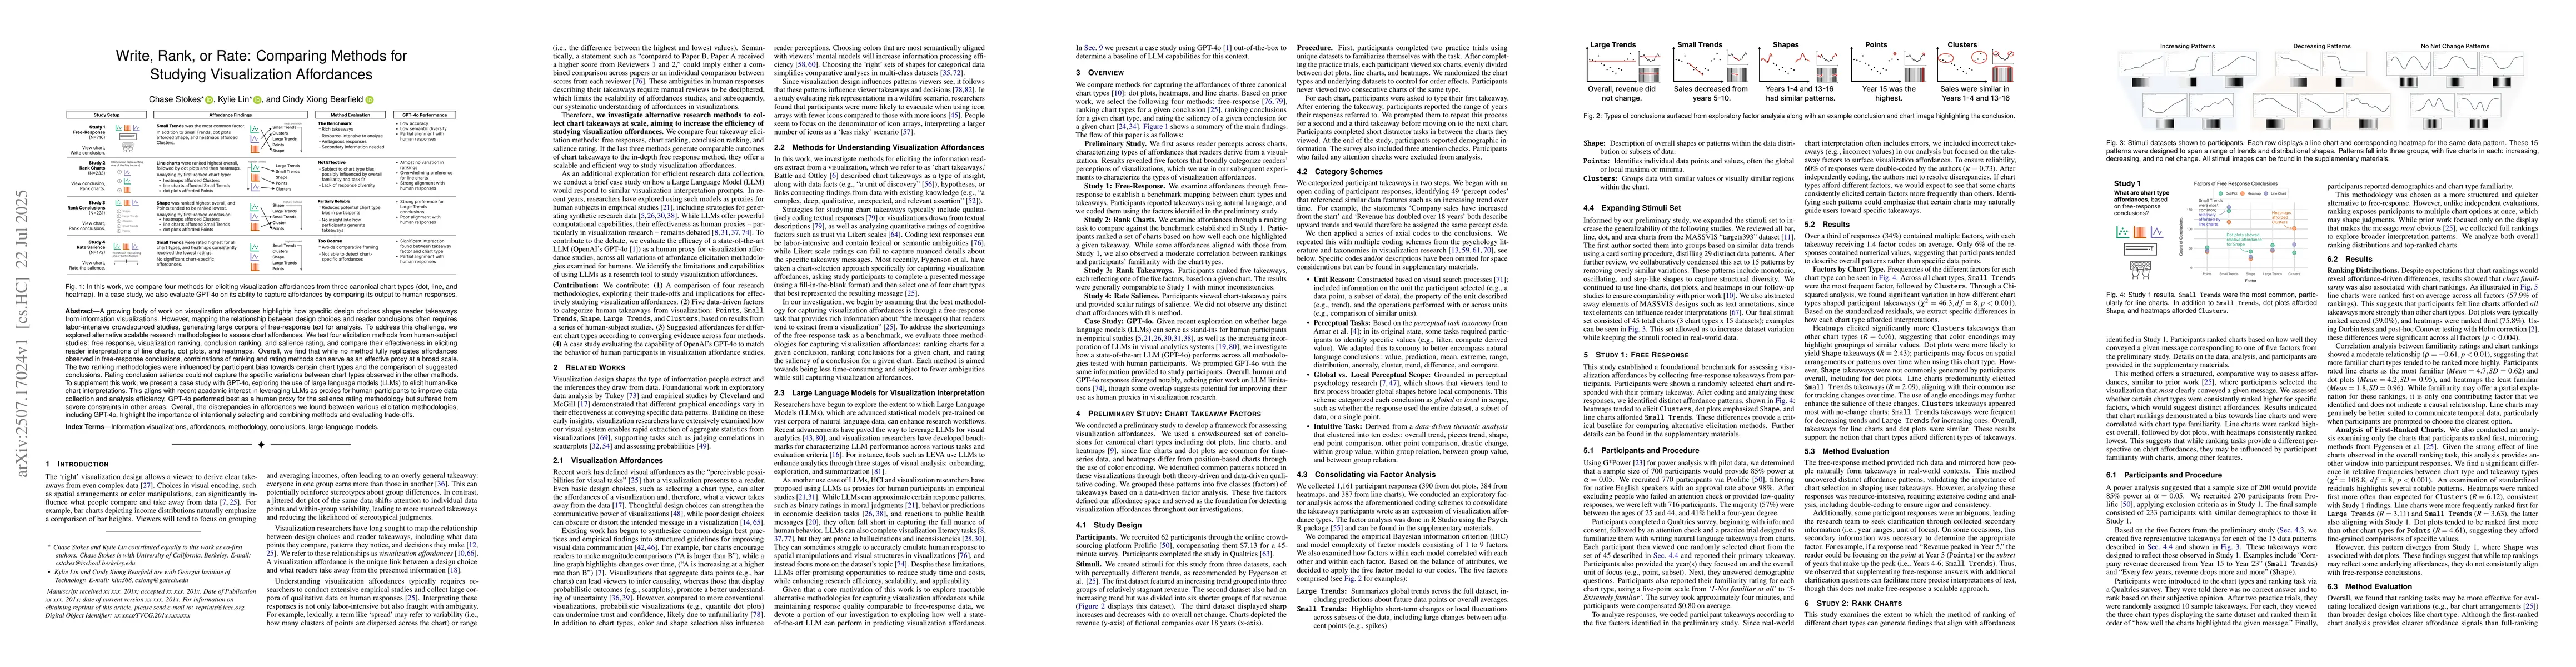
A growing body of work on visualization affordances highlights how specific design choices shape reader takeaways from information visualizations. However, mapping the relationship between design choi...

This website uses cookies to ensure you get the best experience. Learn more