This paper finds that readers prefer charts with more textual annotations over those with minimal text, emphasizing the importance of context and narrative. The study's thematic analysis reveals that readers value informative content, are drawn to the story-like quality of text-only formats, and are wary of misleading elements in visuals.
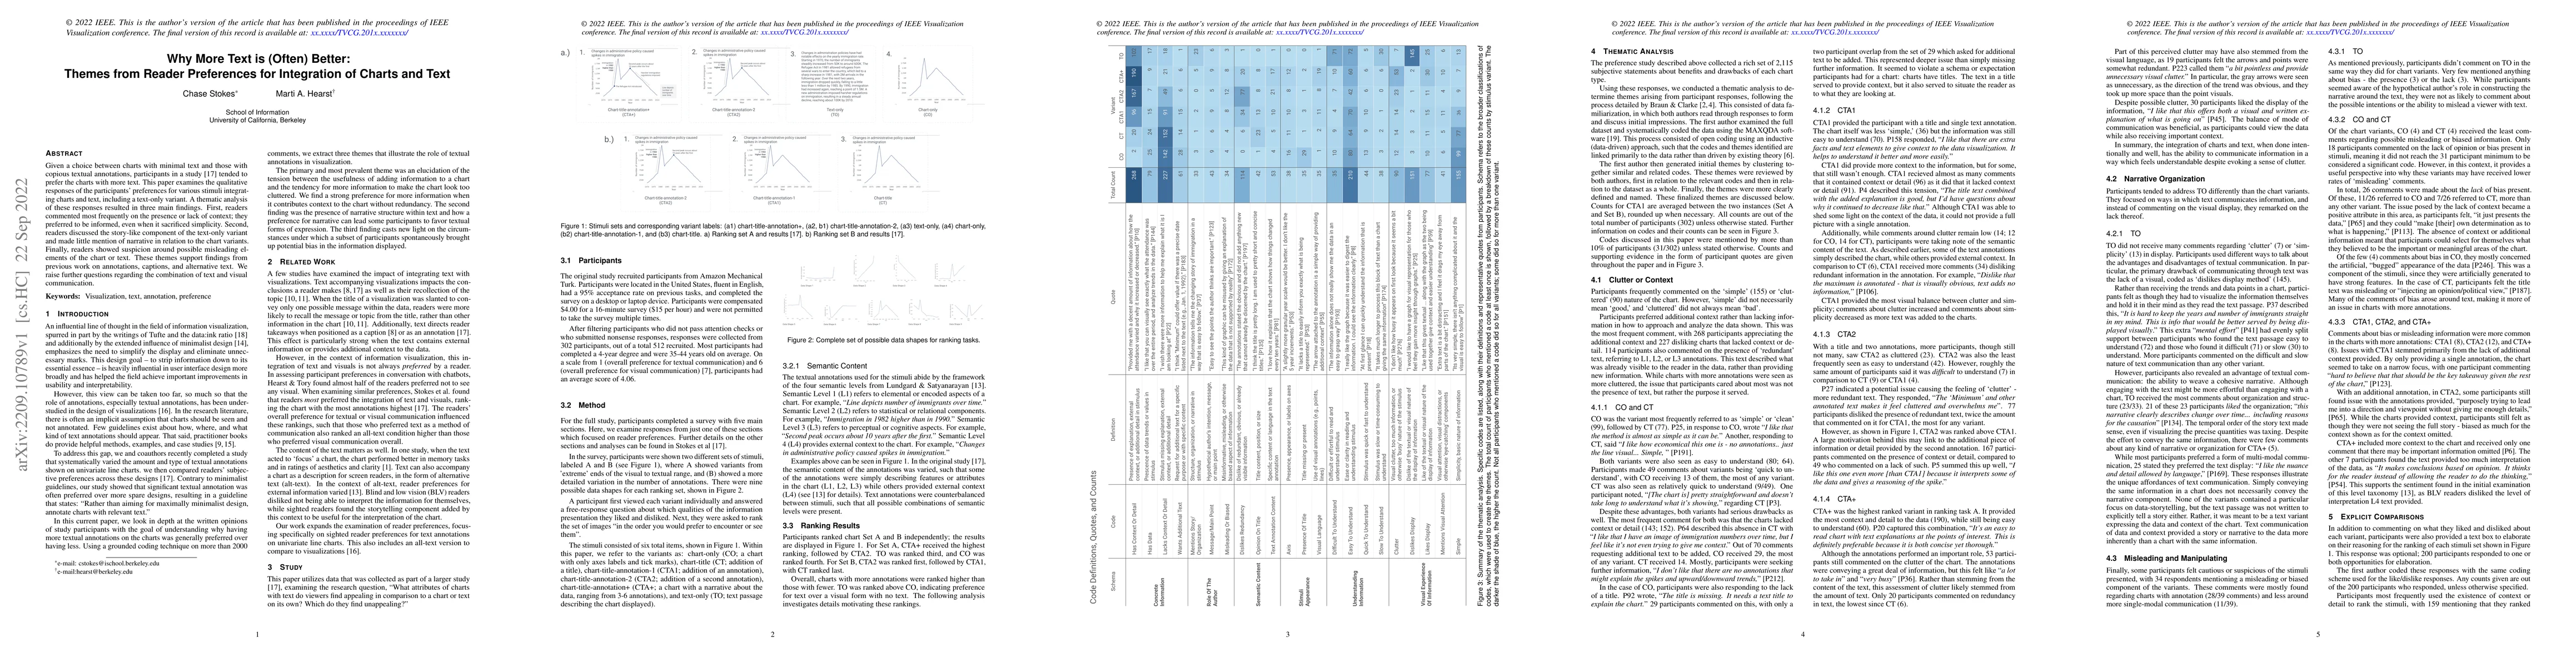
Given a choice between charts with minimal text and those with copious textual annotations, participants in a study (Stokes et al.) tended to prefer the charts with more text. This paper examines the qualitative responses of the participants' preferences for various stimuli integrating charts and text, including a text-only variant. A thematic analysis of these responses resulted in three main findings. First, readers commented most frequently on the presence or lack of context; they preferred to be informed, even when it sacrificed simplicity. Second, readers discussed the story-like component of the text-only variant and made little mention of narrative in relation to the chart variants. Finally, readers showed suspicion around possible misleading elements of the chart or text. These themes support findings from previous work on annotations, captions, and alternative text. We raise further questions regarding the combination of text and visual communication.
Get AI-generated insights about this paper's methodology, results, and significance.
Current paper (gray), citations (green), references (blue)
Arvind Satyanarayan, Vidya Setlur, Chase Stokes et al.
Chris Bryan, Lace Padilla, Anjana Arunkumar
Peng Wang, Zhibo Yang, Cong Yao et al.
Title | Authors | Year | Actions |
---|---|---|---|
"Piecing Data Connections Together Like a Puzzle": Effects of Increasing Task Complexity on the Effectiveness of Data Storytelling Enhanced Visualisations
|
M. Milesi, Paola Mejia-Domenzain, Laura Brandl, Vanessa Echeverría, Yueqiao Jin, D. Gašević, Yi-Shan Tsai, Tanja Käser, Roberto Martínez-Maldonado
|
2025
|
View Paper |
Strategic management analysis: from data to strategy diagram by LLM
|
R. Brath, Adam Bradley, D. Jonker
|
2024
|
View Paper |
Captioning Visualizations with Large Language Models (CVLLM): A Tutorial
|
G. Carenini, Jordon Johnson, Ali Salamatian
|
2024
|
View Paper |
Safeguarding human values: rethinking US law for generative AI’s societal impacts
|
Inyoung Cheong, Aylin Caliskan, Tadayoshi Kohno
|
2024
|
View Paper |
The Role of Text in Visualizations: How Annotations Shape Perceptions of Bias and Influence Predictions
|
Chase Stokes, Cindy Xiong Bearfield, Marti A. Hearst
|
2023
|
View Paper |
What Does the Chart Say? Grouping Cues Guide Viewer Comparisons and Conclusions in Bar Charts
|
Cindy Xiong Bearfield, Chase Stokes, Andrew Lovett, Steven Franconeri
|
2023
|
View Paper |
Show It or Tell It? Text, Visualization, and Their Combination
|
Marti A. Hearst
|
2023
|
View Paper |
Beyond English: Centering Multilingualism in Data Visualization
|
Noëlle Rakotondravony, Priya Dhawka, Melanie Bancilhon
|
2023
|
View Paper |
Is the U.S. Legal System Ready for AI's Challenges to Human Values?
|
Inyoung Cheong, Aylin Caliskan, Tadayoshi Kohno
|
2023
|
View Paper |
Data Stories of Water: Studying the Communicative Role of Data Visualizations within Long‐form Journalism
|
M. Garreton, F. Morini, D. Paz Moyano, G.‐C. Grün, Denis Parra, M. Dörk
|
2023
|
View Paper |
Graphologue: Exploring Large Language Model Responses with Interactive Diagrams
|
Peiling Jiang, Jude Rayan, Steven W. Dow, Haijun Xia
|
2023
|
View Paper |
Summaries as Captions: Generating Figure Captions for Scientific Documents with Automated Text Summarization
|
Huang Chieh-Yang, Ting-Yao Hsu, Ryan A. Rossi, A. Nenkova, Sungchul Kim, G. Chan, Eunyee Koh, C. Lee Giles, Ting Huang
|
2023
|
View Paper |
Comments (0)