Multivariate Data Explanation by Jumping Emerging Patterns Visualization
Publication
Metrics
AI Quick Summary
This paper introduces VAX, a Visual Analytics method that leverages Jumping Emerging Patterns to identify and interpret complex multivariate datasets, offering a more nuanced approach than existing tools by combining data variables logically to reveal intricate data patterns. The effectiveness of VAX is demonstrated through practical applications on two real-world datasets.
Paper Preview
Abstract
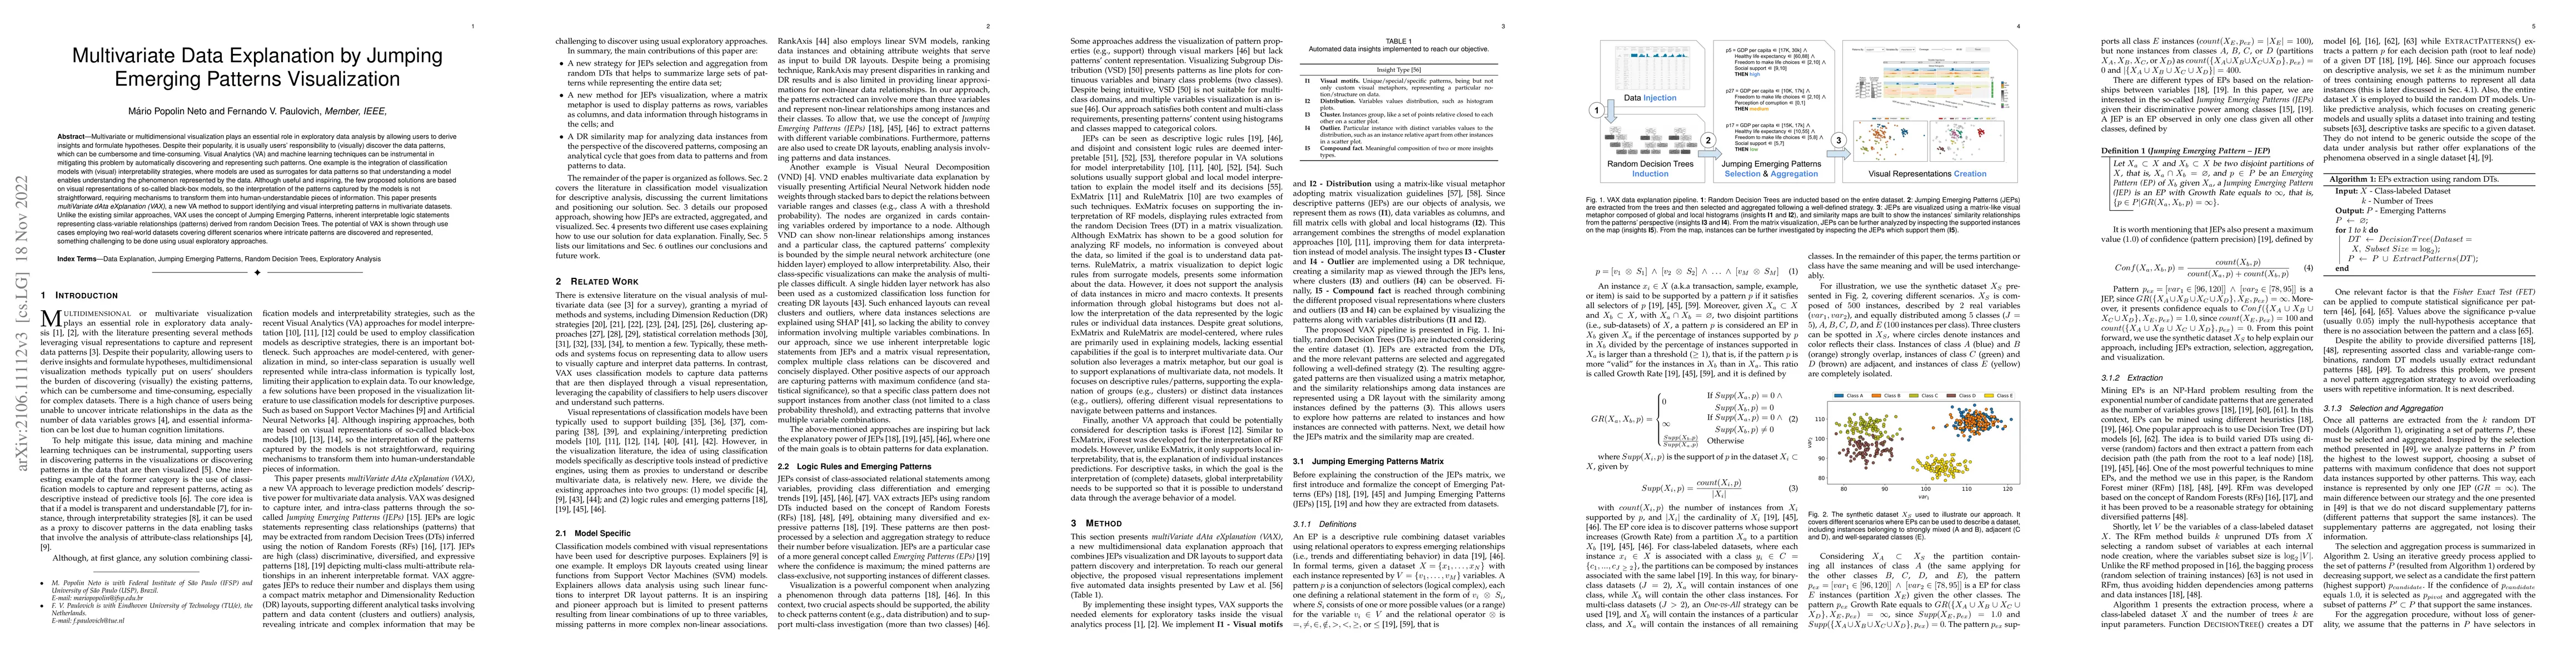
Visual Analytics (VA) tools and techniques have been instrumental in supporting users to build better classification models, interpret models' overall logic, and audit results. In a different direction, VA has recently been applied to transform classification models into descriptive mechanisms instead of predictive. The idea is to use such models as surrogates for data patterns, visualizing the model to understand the phenomenon represented by the data. Although very useful and inspiring, the few proposed approaches have opted to use low complex classification models to promote straightforward interpretation, presenting limitations to capture intricate data patterns. In this paper, we present VAX (multiVariate dAta eXplanation), a new VA method to support the identification and visual interpretation of patterns in multivariate datasets. Unlike the existing similar approaches, VAX uses the concept of Jumping Emerging Patterns to identify and aggregate several diversified patterns, producing explanations through logic combinations of data variables. The potential of VAX to interpret complex multivariate datasets is demonstrated through use cases employing two real-world datasets covering different scenarios.
AI Key Findings
Get AI-generated insights about this paper's methodology, results, significance, and more — seven facets brought into focus.
Impact
Paper Details
Authors
PDF Preview
Key Terms
Citation Network
Current paper (gray), citations (green), references (blue)
Display is limited for performance on very large graphs.
Discussion 0