This paper introduces the magnitude-shape (MS) plot, a new graphical tool for visualizing and detecting outliers in multivariate functional data by considering both magnitude and direction of deviation. The MS-plot outperforms existing methods, as demonstrated through both simulated data and practical examples.
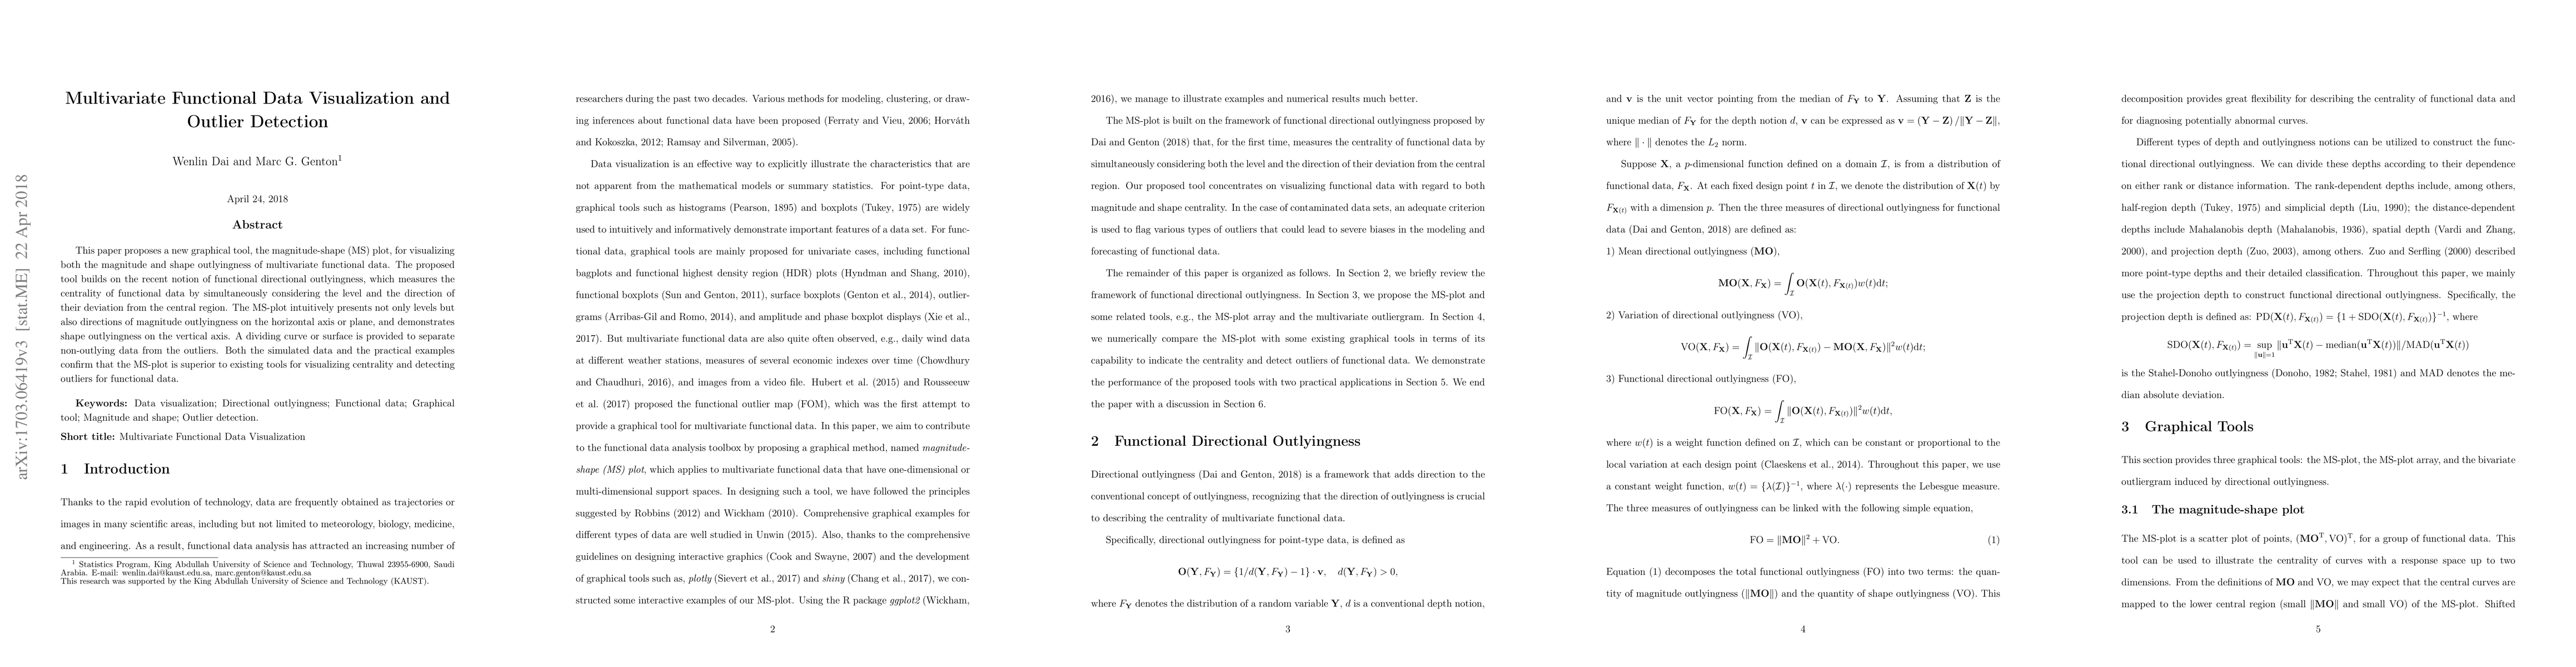
This article proposes a new graphical tool, the magnitude-shape (MS) plot, for visualizing both the magnitude and shape outlyingness of multivariate functional data. The proposed tool builds on the recent notion of functional directional outlyingness, which measures the centrality of functional data by simultaneously considering the level and the direction of their deviation from the central region. The MS-plot intuitively presents not only levels but also directions of magnitude outlyingness on the horizontal axis or plane, and demonstrates shape outlyingness on the vertical axis. A dividing curve or surface is provided to separate non-outlying data from the outliers. Both the simulated data and the practical examples confirm that the MS-plot is superior to existing tools for visualizing centrality and detecting outliers for functional data.
Get AI-generated insights about this paper's methodology, results, and significance.
Current paper (gray), citations (green), references (blue)
Ying Sun, Cristian F. Jimenez-Varon, Fouzi Harrou
Antonio Fernández Anta, Rosa E. Lillo, Marc G. Genton et al.
Title | Authors | Year | Actions |
---|---|---|---|
MANDALA—Visual Exploration of Anomalies in Industrial Multivariate Time Series Data
|
Josef Suschnigg, B. Mutlu, G. Koutroulis, H. Hussain, T. Schreck
|
2025
|
View Paper |
Repeatability index: A functional metric assessing intra-regime variability in helicopters
|
E. Villa, Jessica Leoni, Gabriele Cazzulani, Andrea Baldi, Ugo Mariani, M. Tanelli
|
2024
|
View Paper |
Exploratory functional data analysis
|
Zhuo Qu, Wenlin Dai, C. Euán, Ying Sun, M. Genton
|
2024
|
View Paper |
Functional multiple-point simulation
|
O. Ojo, M. Genton
|
2024
|
View Paper |
Functional Time Series Analysis and Visualization Based on Records
|
Israel Martínez-Hernández, M. Genton
|
2024
|
View Paper |
fsemipar: an R package for SoF semiparametric regression
|
Silvia Novo, Germán Aneiros
|
2024
|
View Paper |
Detection of Emergent Anomalous Structure in Functional Data
|
Edward Austin, I. Eckley, Lawrence Bardwell
|
2024
|
View Paper |
Personalized Imputation in metric spaces via conformal prediction: Applications in Predicting Diabetes Development with Continuous Glucose Monitoring Information
|
Marcos Matabuena, Carla D'iaz-Louzao, Rahul Ghosal, Francisco Gude
|
2024
|
View Paper |
Domain-knowledge-informed functional outlier detection for line quality control systems
|
Jong Hwan Mun, Jitae Yoo, Heesun Kim, Nayi Ryu, Sungil Kim
|
2024
|
View Paper |
Functional Data Analysis: An Introduction and Recent Developments.
|
Jan Gertheiss, D. Rügamer, Bernard X. W. Liew, Sonja Greven
|
2023
|
View Paper |
Regularized Halfspace Depth for Functional Data
|
Hyemin Yeon, Xiongtao Dai, Sara López-Pintado
|
2023
|
View Paper |
Pointwise data depth for univariate and multivariate functional outlier detection
|
C. F. Jiménez-Varón, F. Harrou, Ying Sun
|
2023
|
View Paper |
Density kernel depth for outlier detection in functional data
|
Nicolás Hernández, A. Muñoz, Gabriel Martos
|
2023
|
View Paper |
Doubly ranked tests of location for grouped functional data
|
M. Meyer
|
2023
|
View Paper |
Synergies between global low-carbon development processes and financial fluctuations from 1991–2019: a functional data analysis
|
Yuquan Liu, Chao Feng
|
2023
|
View Paper |
Identification of Predictive Anomolous Signals in the Noise of Epitaxy Process Control : Topics: APC, DM, EO, NS/NC
|
F. Bergeret, Daniel M. Pagano, Wes Smith
|
2023
|
View Paper |
Bayesian Machine Learning and Functional Data Analysis as a Two-Fold Approach for the Study of Acid Mine Drainage Events
|
Xurxo Rigueira, M. Pazo, M. Araújo, S. Gerassis, Elvira Bocos
|
2023
|
View Paper |
Multivariate functional outlier detection using the fast massive unsupervised outlier detection indices
|
O. Ojo, Antonio Fernández Anta, M. Genton, R. Lillo
|
2023
|
View Paper |
Integrating spatial dependence into functional clustering of NDVI in the Ecuadorian Andes
|
Jeysson Chuquin, Alexandra Maigua, Miguel Flores, J. Mateu, Sandra Torres, Xavier E. Zapata-Ríos
|
2023
|
View Paper |
Global Depths for Irregularly Observed Multivariate Functional Data
|
Zhuo Qu, Wenlin Dai, M. Genton
|
2022
|
View Paper |
scikit-fda: A Python Package for Functional Data Analysis
|
Carlos Ramos-Carreño, J. L. Torrecilla, Miguel Carbajo-Berrocal, P. Marcos, A. Su'arez
|
2022
|
View Paper |
scikit-fda: Computational Tools for Machine Learning with Functional Data
|
Carlos Ramos-Carreño, J. L. Torrecilla, Yujian Hong, Alberto Suárez
|
2022
|
View Paper |
Multivariate Functional Outlier Detection using the FastMUOD Indices
|
O. Ojo, Antonio Fernandez Anta, M. Genton, R. Lillo
|
2022
|
View Paper |
Robust Multivariate Functional Control Chart
|
Christian Capezza, Fabio Centofanti, A. Lepore, B. Palumbo
|
2022
|
View Paper |
Functional Data Analysis for the Detection of Outliers and Study of the Effects of the COVID-19 Pandemic on Air Quality: A Case Study in Gijón, Spain
|
Xurxo Rigueira, María Araújo, Javier Martínez, P. J. García–Nieto, Iago Ocarranza
|
2022
|
View Paper |
Robust Two-Layer Partition Clustering of Sparse Multivariate Functional Data
|
Zhuo Qu, Wenlin Dai, M. Genton
|
2022
|
View Paper |
Functional principal component analysis for identifying the child growth pattern using longitudinal birth cohort data
|
R. Karuppusami, B. Antonisamy, P. Premkumar
|
2022
|
View Paper |
Curvature and Torsion estimation of 3D functional data: A geometric approach to build the mean shape under the Frenet Serret framework
|
Juhyun Park, N. Brunel, P. Chassat
|
2022
|
View Paper |
ICS for multivariate functional anomaly detection with applications to predictive maintenance and quality control
|
A. Archimbaud, Feriel Boulfani, X. Gendre, K. Nordhausen, A. Ruiz-Gazen, Joni Virta
|
2022
|
View Paper |
A Machine-learning-Aided Visual Analysis Workflow for Investigating Air Pollution Data
|
Yun-Hsin Kuo, Takanori Fujiwara, C. Chou, Chun Chen, K. Ma
|
2022
|
View Paper |
Depthgram: Visualizing outliers in high‐dimensional functional data with application to fMRI data exploration
|
Y. Alemán‐Gómez, Ana Arribas-Gil, M. Desco, Antonio Elías, J. Romo
|
2022
|
View Paper |
Functional anomaly detection: a benchmark study
|
Guillaume Staerman, E. Adjakossa, Pavlo Mozharovskyi, V. Hofer, J. Gupta, S. Clémençon
|
2022
|
View Paper |
Is the Group Structure Important in Grouped Functional Time Series?
|
Yang Yang, H. Shang
|
2021
|
View Paper |
Comprehensive functional data analysis of China’s dynamic energy security index
|
Olusola Bamisile, O. Ojo, Nasser Yimen, H. Adun, Jian Li, S. Obiora, Qi Huang
|
2021
|
View Paper |
A geometric perspective on functional outlier detection
|
M. Herrmann, F. Scheipl
|
2021
|
View Paper |
Outlier Detection for Functional Data with R Package fdaoutlier
|
O. Ojo, R. Lillo, Antonio Fernández Anta
|
2021
|
View Paper |
On projection methods for functional time series forecasting
|
A. El'ias, Ra'ul Jim'enez, H. Shang
|
2021
|
View Paper |
Visualizing Outliers in High Dimensional Functional Data for Task fMRI data exploration
|
Y. Alemán‐Gómez, Ana Arribas-Gil, M. Desco, Antonio Elias-Fernandez, Juan Romo Medical Image Analysis Laboratory, University of Lausanne, Lausanne, Switzerland., I. Data, U. C. I. Madrid, Getafe, Spain., Biomedical Imaging, lnstrumentation Group, Hospital General Universitario Gregorio Maranon, Madrid, Departamento de Bioingenieria e Ingenieria Aeroespacial, Spain Departamento de Estadistica
|
2021
|
View Paper |
Sparse Functional Boxplots for Multivariate Curves
|
Zhuo Qu, M. Genton
|
2021
|
View Paper |
A Visual Analytics Approach for Hardware System Monitoring with Streaming Functional Data Analysis
|
Fnu Shilpika, Takanori Fujiwara, Naohisa Sakamoto, J. Nonaka, K. Ma
|
2020
|
View Paper |
A Visual Analytics Approach to Monitor Time-Series Data with Incremental and Progressive Functional Data Analysis
|
Shilpika, Takanori Fujiwara, Naohisa Sakamoto, J. Nonaka, K. Ma
|
2020
|
View Paper |
Functional Data Visualization
|
M. Genton, Ying Sun
|
2020
|
View Paper |
Localization processes for functional data analysis
|
A. El'ias, Ra'ul Jim'enez, J. Yukich
|
2020
|
View Paper |
Bivariate Functional Quantile Envelopes With Application to Radiosonde Wind Data
|
Gaurav Agarwal, Ying Sun
|
2020
|
View Paper |
Robust functional multivariate analysis of variance with environmental applications
|
Zhuo Qu, Wenlin Dai, M. Genton
|
2020
|
View Paper |
Detecting and classifying outliers in big functional data
|
O. Ojo, Antonio Fernández Anta, R. Lillo, Carlo Sguera
|
2019
|
View Paper |
Mean curvature and mean shape for multivariate functional data under Frenet-Serret framework.
|
Juhyun Park, N. Brunel
|
2019
|
View Paper |
MAHALANOBIS DISTANCE AND ITS APPLICATION FOR DETECTING MULTIVARIATE OUTLIERS
|
H. Ghorbani
|
2019
|
View Paper |
Robust Functional Regression for Outlier Detection
|
Harjit Hullait, D. Leslie, N. Pavlidis, S. King
|
2019
|
View Paper |
Functional Time Series Analysis Based on Records
|
Israel Mart'inez-Hern'andez, M. Genton
|
2019
|
View Paper |
Robust Function-on-Function Regression
|
Harjit Hullait, D. Leslie, N. Pavlidis, S. King
|
2019
|
View Paper |
Elastic Depths for Detecting Shape Anomalies in Functional Data
|
Trevor Harris, J. Tucker, Bo Li, L. Shand
|
2019
|
View Paper |
Trajectory functional boxplots
|
Zonghui Yao, Wenlin Dai, Marc G. Genton
|
2019
|
View Paper |
Comments on: Data science, big data and statistics
|
M. Genton, Ying Sun
|
2019
|
View Paper |
Comments on: Data science, big data and statistics
|
M. Genton, Ying Sun
|
2019
|
View Paper |
Discussion on the meeting on ‘Data visualization’
|
Priyantha Wijayatunga, P. Diggle, M. Baillie, M. Vandemeulebroecke, Wayne R. Jones, A. Fassò, F. Finazzi, T. King, J. Carter, A. Noble, T. Krone, Z. Fang, Peter Green, A. Atkinson, A. Corbellini, G. Morelli, N. Cressie, M. Friendly, Lasse Holmström, Raphael Huser, M. Carvalho, L. Lombardo, Christopher Jackson, J. Mateu, A. Reese, A. Zammit‐Mangion, S. Castruccio, M. Genton, Ying Sun, Jonah Gabry, Daniel P. Simpson, Aki Vehtari, M. Betancourt, A. Gelman, A. Bowman
|
2019
|
View Paper |
Functional outlier detection and taxonomy by sequential transformations
|
Wenlin Dai, T. Mrkvička, Ying Sun, M. Genton
|
2018
|
View Paper |
Independent component analysis for multivariate functional data
|
Joni Virta, Bing Li, K. Nordhausen, H. Oja
|
2017
|
View Paper |
A global test for heteroscedastic one-way FMANOVA with applications
|
Tianming Zhu, Jin-Ting Zhang, Ming-Yen Cheng
|
2024
|
View Paper |
Exploring magnitude and shape outliers of tropospheric diurnal ozone O3 using functional data analysis
|
Ros Rasyiqah Rosslan, N. Shaadan, S. M. Deni
|
2024
|
View Paper |
Reflections on the Developments of Visual Analytics Systems for the K Computer System Log Data
|
J. Nonaka, K. Fujita, T. Fujiwara, N. Sakamoto, K. Yamamoto, M. Terai, T. Tsukamoto, F. Shoji
|
2023
|
View Paper |
Outlier Detection of Air Quality for Two Indian Urban Cities Using Functional Data Analysis
|
M. Ahmad, Weihu Cheng, Zhao Xu, A. Kalam
|
2023
|
View Paper |
The Roles and Modes of Human Interactions with Automated Machine Learning Systems: A Critical Review and Perspectives
|
T. T. Khuat, D. Kedziora, Bogdan Gabrys
|
2023
|
View Paper |
K-Nearest Neighbor Method with Principal Component Analysis for Functional Nonparametric Regression
|
Shelan Saied Ismaeel, K. M. Omar, Bo Wang
|
2022
|
View Paper |
Automated data inspection in jet engines
|
Harjit Hullait
|
2020
|
View Paper |
Outlier Detection using Graphical and Nongraphical Functional Methods in Hydrology
|
I. Hussain
|
2019
|
View Paper |
Functional boxplots for multivariate curves
|
Wenlin Dai, M. Genton
|
2018
|
View Paper |
TR-IMDEA-Networks-2021-2 Outlier Detection for Functional Data with R Package fdaoutlier
|
O. Ojo, R. Lillo, Antonio Fernández Anta
|
View Paper |
Comments (0)