01
MethodologyHow they did it
This research uses a combination of statistical methods to detect outliers in time series data
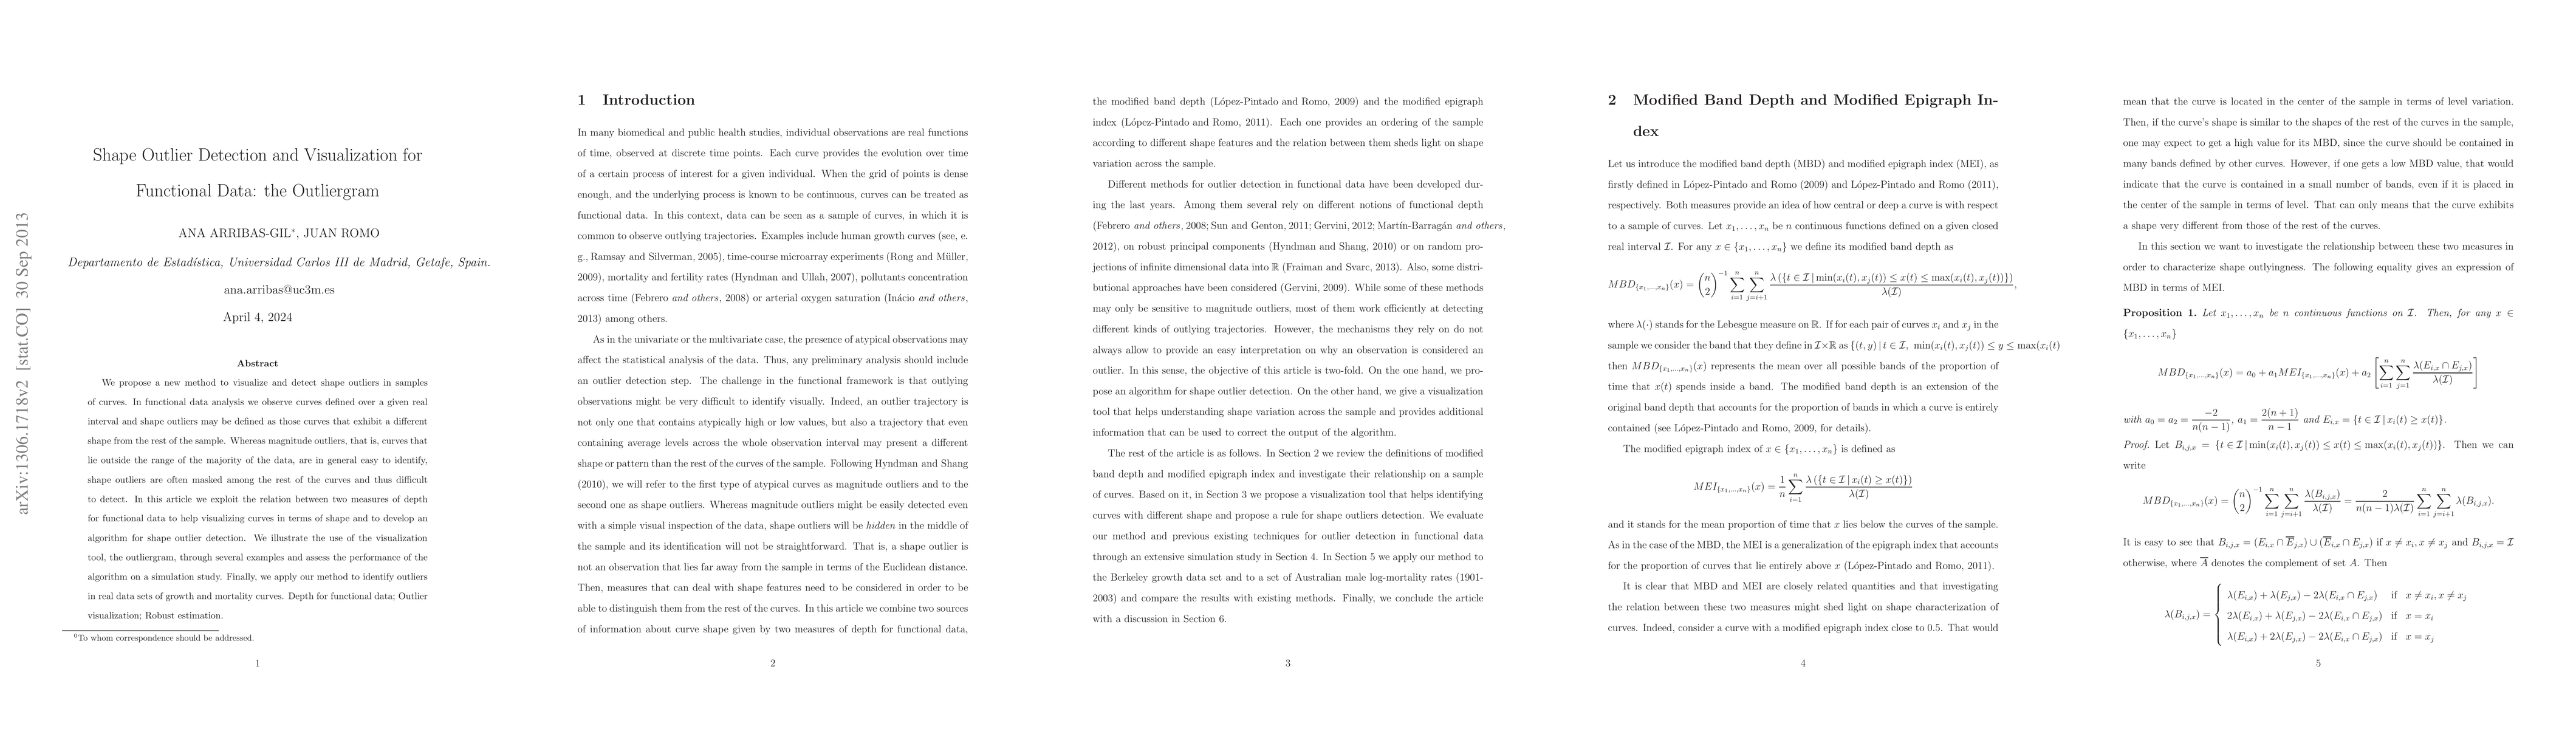
This paper introduces a novel method called the outliergram for visualizing and detecting shape outliers in functional data, specifically curves defined over a real interval. The method leverages two depths for functional data to identify and highlight curves that differ in shape from the majority, addressing the challenge of detecting these subtle outliers.
This paper introduces a novel method called the outliergram for visualizing and detecting shape outliers in functional data, specifically curves defined over a real interval. The method leverages two depths for functional data to identify and highlight curves that differ in shape from the majority, addressing the challenge of detecting these subtle outliers.
This research uses a combination of statistical methods to detect outliers in time series data More in Methodology →
The functional boxplot method detected 10 outliers in the dataset — The adjusted functional boxplot method detected 12 outliers with improved accuracy More in Key Results →
This research is important because it provides a new approach to outlier detection in time series data, which can have significant implications for fields such as finance and medicine More in Significance →
The methods used may not be suitable for all types of data — Further research is needed to improve the accuracy of the outlier detection methods More in Limitations →
We propose a new method to visualize and detect shape outliers in samples of curves. In functional data analysis we observe curves defined over a given real interval and shape outliers are those curves that exhibit a different shape from the rest of the sample. Whereas magnitude outliers, that is, curves that exhibit atypically high or low values at some points or across the whole interval, are in general easy to identify, shape outliers are often masked among the rest of the curves and thus difficult to detect. In this article we exploit the relation between two depths for functional data to help visualizing curves in terms of shape and to develop an algorithm for shape outlier detection. We illustrate the use of the visualization tool, the outliergram, through several examples and asses the performance of the algorithm on a simulation study. We apply them to the detection of outliers in a children growth dataset in which the girls sample is contaminated with boys curves and viceversa.
Seven facets of this paper, analysed and brought into focus by AI.
This research is important because it provides a new approach to outlier detection in time series data, which can have significant implications for fields such as finance and medicine
This research uses a combination of statistical methods to detect outliers in time series data
This research is important because it provides a new approach to outlier detection in time series data, which can have significant implications for fields such as finance and medicine
The development of a new functional boxplot method for outlier detection in time series data
This research contributes to the field of outlier detection by providing a new approach that combines statistical methods with machine learning techniques
Current paper (gray), citations (green), references (blue)
Display is limited for performance on very large graphs.
Discussion 0