Multivariate Time Series Forecasting with Transfer Entropy Graph
Publication
Metrics
AI Quick Summary
The paper introduces a novel deep learning model, CauGNN, that uses Neural Granger Causality graphs to capture causal relationships among variables in multivariate time series (MTS) forecasting. The model employs CNNs for feature extraction and GNNs for forecasting, achieving state-of-the-art results on real-world datasets.
Paper Preview
Abstract
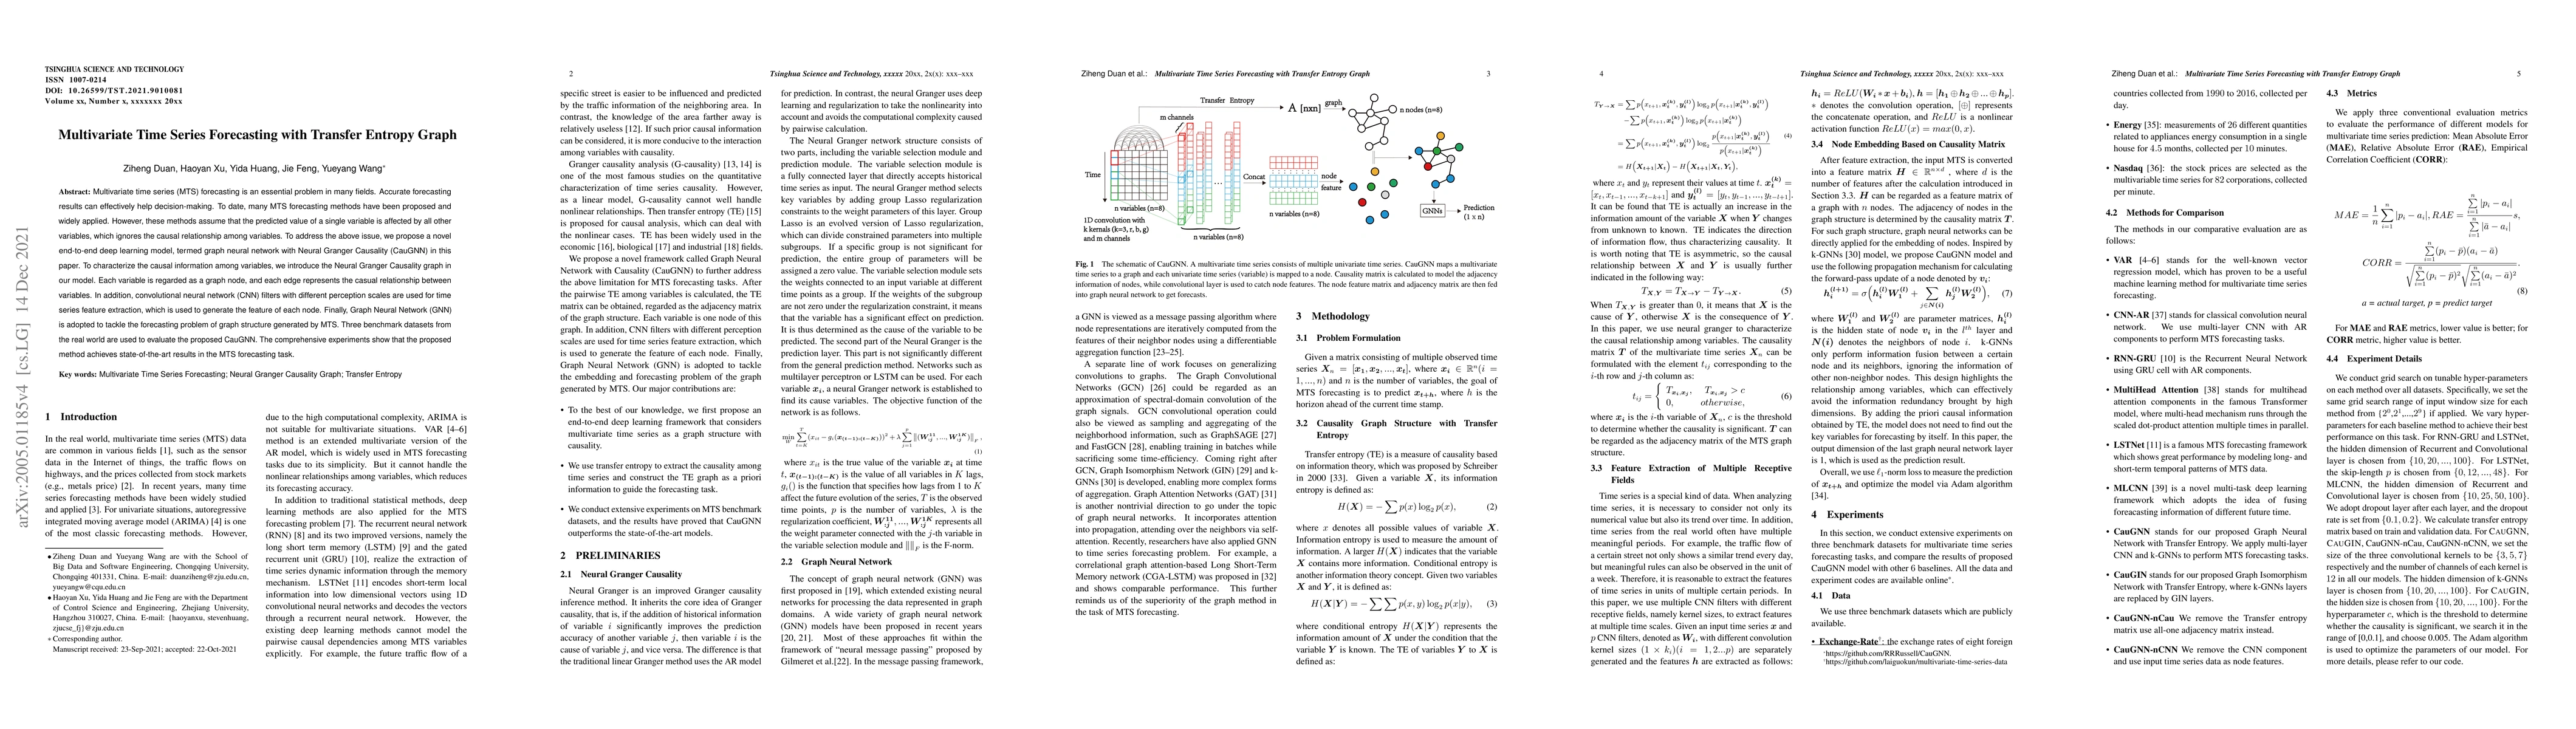
Multivariate time series (MTS) forecasting is an essential problem in many fields. Accurate forecasting results can effectively help decision-making. To date, many MTS forecasting methods have been proposed and widely applied. However, these methods assume that the predicted value of a single variable is affected by all other variables, which ignores the causal relationship among variables. To address the above issue, we propose a novel end-to-end deep learning model, termed graph neural network with Neural Granger Causality (CauGNN) in this paper. To characterize the causal information among variables, we introduce the Neural Granger Causality graph in our model. Each variable is regarded as a graph node, and each edge represents the casual relationship between variables. In addition, convolutional neural network (CNN) filters with different perception scales are used for time series feature extraction, which is used to generate the feature of each node. Finally, Graph Neural Network (GNN) is adopted to tackle the forecasting problem of graph structure generated by MTS. Three benchmark datasets from the real world are used to evaluate the proposed CauGNN. The comprehensive experiments show that the proposed method achieves state-of-the-art results in the MTS forecasting task.
AI Key Findings
Get AI-generated insights about this paper's methodology, results, significance, and more — seven facets brought into focus.
Impact
Paper Details
Authors
PDF Preview
Key Terms
Citation Network
Current paper (gray), citations (green), references (blue)
Display is limited for performance on very large graphs.
Discussion 0