Publication
Metrics
AI Quick Summary
This paper employs network-centric indicators to analyze the fragility of global financial market indices, examining correlations among 69 indices across 65 countries from 2000-2014. It finds that network measures, especially during critical market events, effectively monitor financial market fragility.
Paper Preview
Abstract
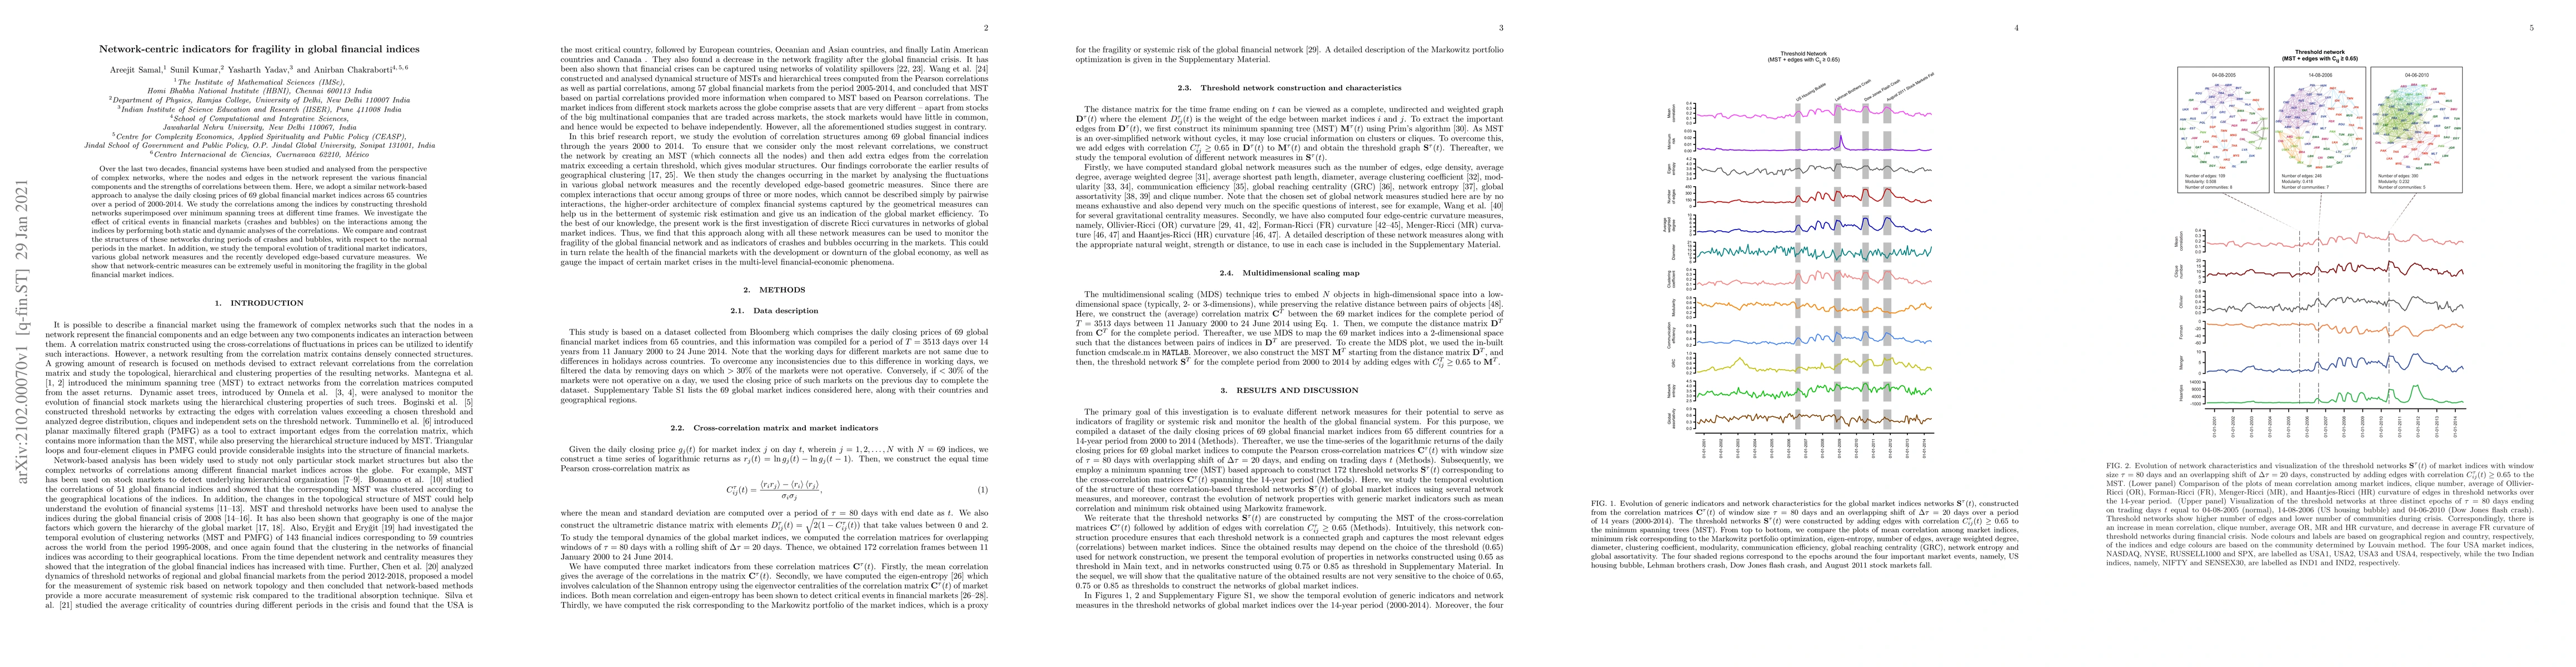
Over the last two decades, financial systems have been studied and analysed from the perspective of complex networks, where the nodes and edges in the network represent the various financial components and the strengths of correlations between them. Here, we adopt a similar network-based approach to analyse the daily closing prices of 69 global financial market indices across 65 countries over a period of 2000-2014. We study the correlations among the indices by constructing threshold networks superimposed over minimum spanning trees at different time frames. We investigate the effect of critical events in financial markets (crashes and bubbles) on the interactions among the indices by performing both static and dynamic analyses of the correlations. We compare and contrast the structures of these networks during periods of crashes and bubbles, with respect to the normal periods in the market. In addition, we study the temporal evolution of traditional market indicators, various global network measures and the recently developed edge-based curvature measures. We show that network-centric measures can be extremely useful in monitoring the fragility in the global financial market indices.
AI Key Findings
Get AI-generated insights about this paper's methodology, results, significance, and more — seven facets brought into focus.
Impact
Paper Details
Authors
PDF Preview
Key Terms
Citation Network
Current paper (gray), citations (green), references (blue)
Display is limited for performance on very large graphs.
Discussion 0