Publication
Metrics
Paper Preview
Abstract
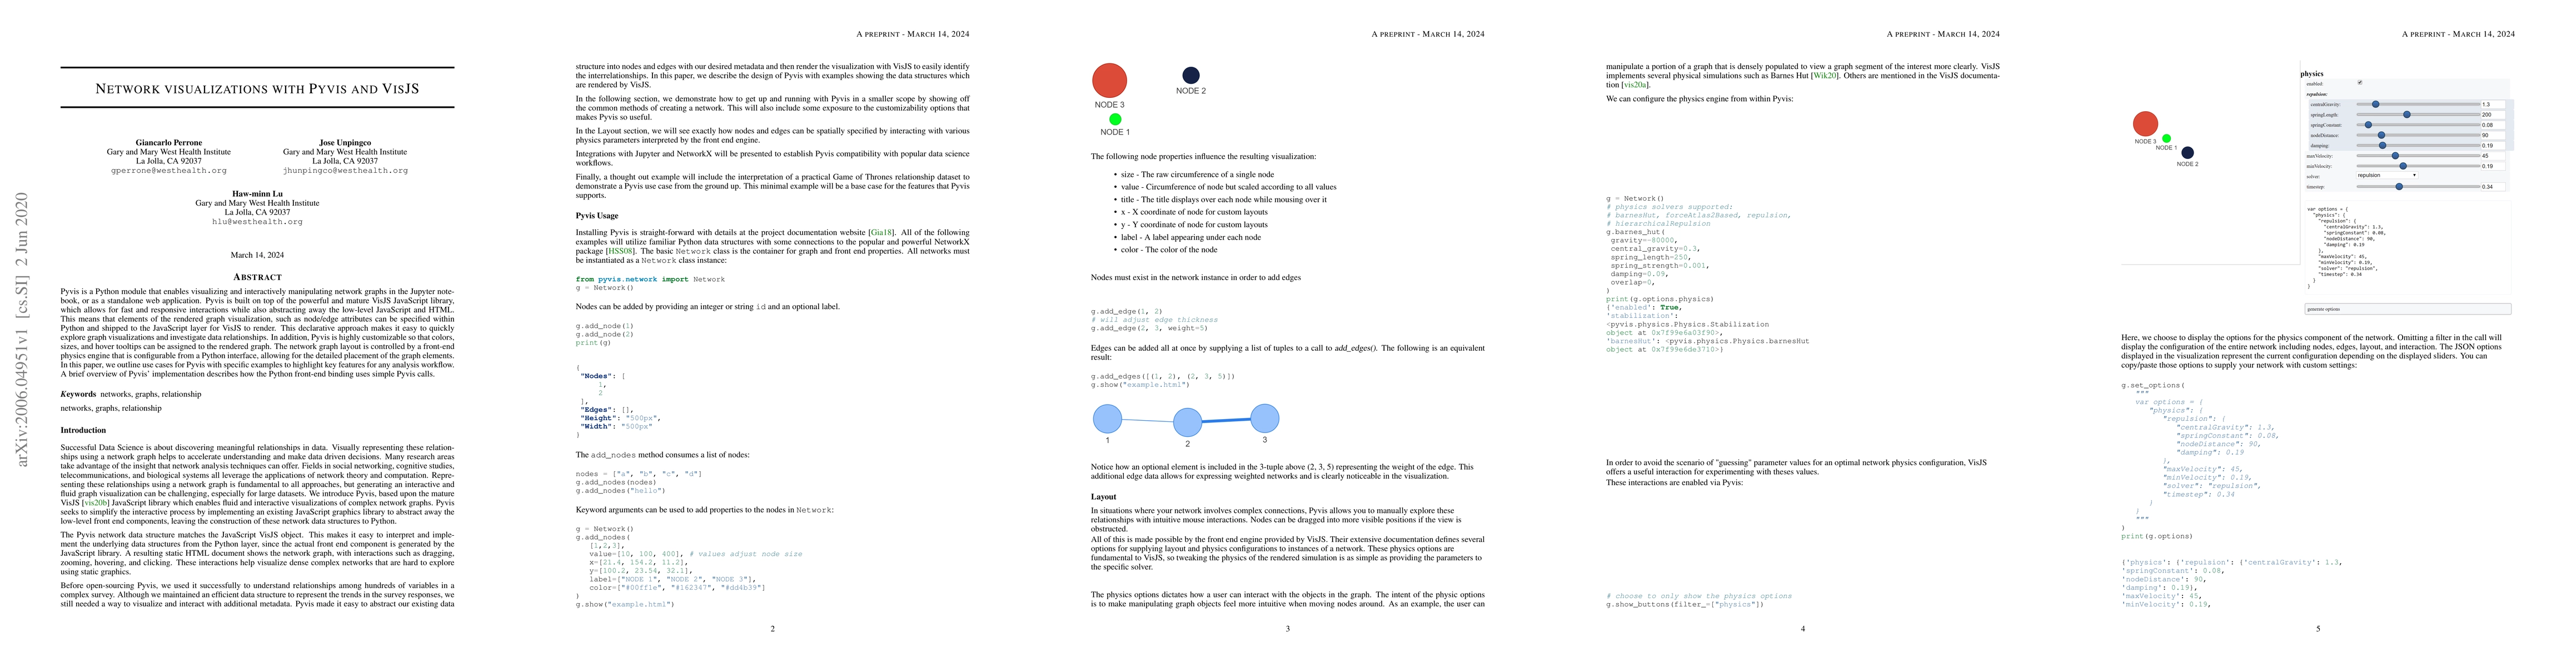
Pyvis is a Python module that enables visualizing and interactively manipulating network graphs in the Jupyter notebook, or as a standalone web application. Pyvis is built on top of the powerful and mature VisJS JavaScript library, which allows for fast and responsive interactions while also abstracting away the low-level JavaScript and HTML. This means that elements of the rendered graph visualization, such as node/edge attributes can be specified within Python and shipped to the JavaScript layer for VisJS to render. This declarative approach makes it easy to quickly explore graph visualizations and investigate data relationships. In addition, Pyvis is highly customizable so that colors, sizes, and hover tooltips can be assigned to the rendered graph. The network graph layout is controlled by a front-end physics engine that is configurable from a Python interface, allowing for the detailed placement of the graph elements. In this paper, we outline use cases for Pyvis with specific examples to highlight key features for any analysis workflow. A brief overview of Pyvis' implementation describes how the Python front-end binding uses simple Pyvis calls.
AI Key Findings
Get AI-generated insights about this paper's methodology, results, significance, and more — seven facets brought into focus.
Impact
Paper Details
Authors
PDF Preview
Key Terms
Citation Network
Current paper (gray), citations (green), references (blue)
Display is limited for performance on very large graphs.
Discussion 0