Quick Summary:

This paper introduces the Storyline with Ubiquitous Actors (SUA) model, which allows actors to simultaneously belong to multiple groups over time, breaking the traditional constraint of exclusivity. This model represents actors as trees and presents an algorithmic pipeline for its visualization, illustrated through case studies on publication data.

Summary

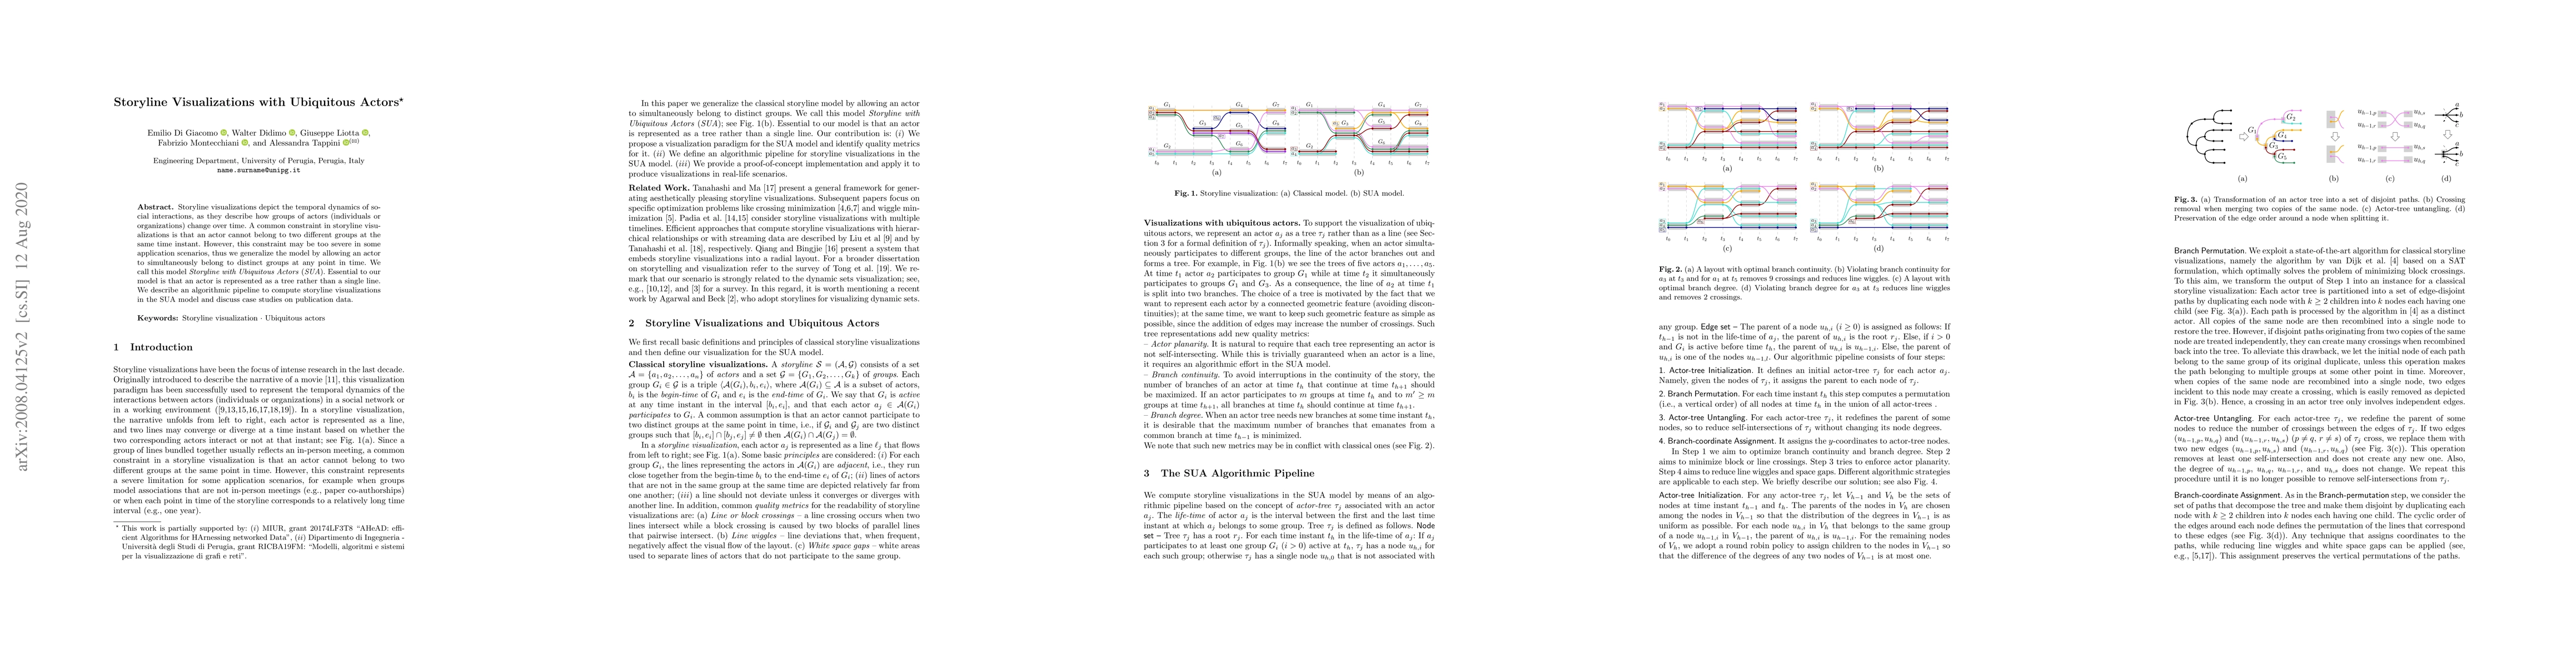
Storyline visualizations depict the temporal dynamics of social interactions, as they describe how groups of actors (individuals or organizations) change over time. A common constraint in storyline visualizations is that an actor cannot belong to two different groups at the same time instant. However, this constraint may be too severe in some application scenarios, thus we generalize the model by allowing an actor to simultaneously belong to distinct groups at any point in time. We call this model Storyline with Ubiquitous Actors (SUA). Essential to our model is that an actor is represented as a tree rather than a single line. We describe an algorithmic pipeline to compute storyline visualizations in the SUA model and discuss case studies on publication data.

AI Key Findings

Get AI-generated insights about this paper's methodology, results, and significance.

Paper Details

PDF Preview

Download PDF

Key Terms

groups (0.325)
constraint (0.302)
ubiquitous (0.216)
case studies (0.214)
algorithmic (0.209)
individuals (0.203)
pipeline (0.199)
represented (0.186)
time (0.184)
model (0.182)
tree (0.181)
social (0.177)
generalize (0.176)
temporal (0.166)
allowing (0.164)
distinct (0.164)
simultaneously (0.160)
essential (0.159)
change (0.158)
scenarios (0.157)
Title Authors Year Actions
Stratiline: A visualization system based on stratified storyline
Mingdong Zhang, Li Chen, Junhai Yong
2025
View Paper
Revisiting ILP Models for Exact Crossing Minimization in Storyline Drawings
Alexander Dobler, M. Jünger, Paul J. Jünger, Julian Meffert, P. Mutzel, M. Nöllenburg
2024
View Paper
SpreadLine: Visualizing Egocentric Dynamic Influence
Yun-Hsin Kuo, Dongyu Liu, Kwan-Liu Ma
2024
View Paper
Evaluating Graph Layout Algorithms: A Systematic Review of Methods and Best Practices
Sara Di Bartolomeo, Tarik Crnovrsanin, David Saffo, Eduardo Puerta, Connor Wilson, Cody Dunne
2024
View Paper
Clover Connections: Visualising Character Dynamics in Novels for Non-Experts
Natalie House, Andrew Johnston
2023
View Paper
E2Storyline: Visualizing the Relationship with Triplet Entities and Event Discovery
Yunchao Wang, Guodao Sun, Zihao Zhu, Tong Li, Ling Chen, Ronghua Liang
2023
View Paper
Crossing Minimization in Time Interval Storylines
Alexander Dobler, M. Nöllenburg, Daniel Stojanovic, Anaïs Villedieu, J. Wulms
2023
View Paper
Geo-Storylines: Integrating Maps into Storyline Visualizations
Golina Hulstein, Vanessa Peña Araya, A. Bezerianos
2022
View Paper
How Does Automation Shape the Process of Narrative Visualization: A Survey of Tools
Qing Chen, Shixiong Cao, Jiazhe Wang, Nan Cao
2022
View Paper
Storylines with a Protagonist
Tim Hegemann, Alexander Wolff
2024
View Paper
The worst graph layout algorithm ever
Sara Di Bartolomeo, Matěj Lang, Cody Dunne
2022
View Paper
On Block Crossing Optimal Drawings of Storylines
Peter Markfelder, Dr. Alexander Wol, Dr. Thomas van Dijk
2021
View Paper
ON INFORMATICS VISUALIZATION
Zainal Abidin, Rinaldi Munir, Saiful Akbar, Rila Mandala, D. H. Widyantoro, Marcus F. Gideon, Joe Wu, Agripina P. Rahmanto, Lukhi A. Nugroho, Takeshi Kamura, Ricky K. Suwardi, Tarun Kona, Markis Kido, Koo Kien Keat, Gabriela, Stoeva Jones, Rafli Jansen
View Paper
Metaphorical metro maps: design challenges
H. Haverkort
View Paper

Comments (0)

This website uses cookies to ensure you get the best experience. Learn more