01
MethodologyHow they did it
The research uses a combination of graph theory and dynamic programming to solve the storyline problem.
This paper investigates the problem of minimizing crossings in storyline visualizations where characters are represented by $x$-monotone curves. It establishes tight bounds for a restricted case where interactions form a tree, showing $O(n\log n)$ crossings are sufficient and necessary. It also proves that minimizing crossings is fixed-parameter tractable when parameterized by the number of characters.
This paper investigates the problem of minimizing crossings in storyline visualizations where characters are represented by $x$-monotone curves. It establishes tight bounds for a restricted case where interactions form a tree, showing $O(n\log n)$ crossings are sufficient and necessary. It also proves that minimizing crossings is fixed-parameter tractable when parameterized by the number of characters.
The research uses a combination of graph theory and dynamic programming to solve the storyline problem. More in Methodology →
Main finding 1: The storyline problem can be reduced to finding a shortest path in an augmented graph. — Main finding 2: A dynamic programming approach can be used to compute the minimum number of crossings in O(k!2m) time. More in Key Results →
The research has implications for visual analysis and optimization of dynamic graphs, with potential applications in fields such as computer vision and data science. More in Significance →
Limitation 1: The algorithm assumes a fixed ordering of events, which may not always be possible or desirable. — Limitation 2: The problem is NP-complete for general cases, making it challenging to find exact solutions. More in Limitations →
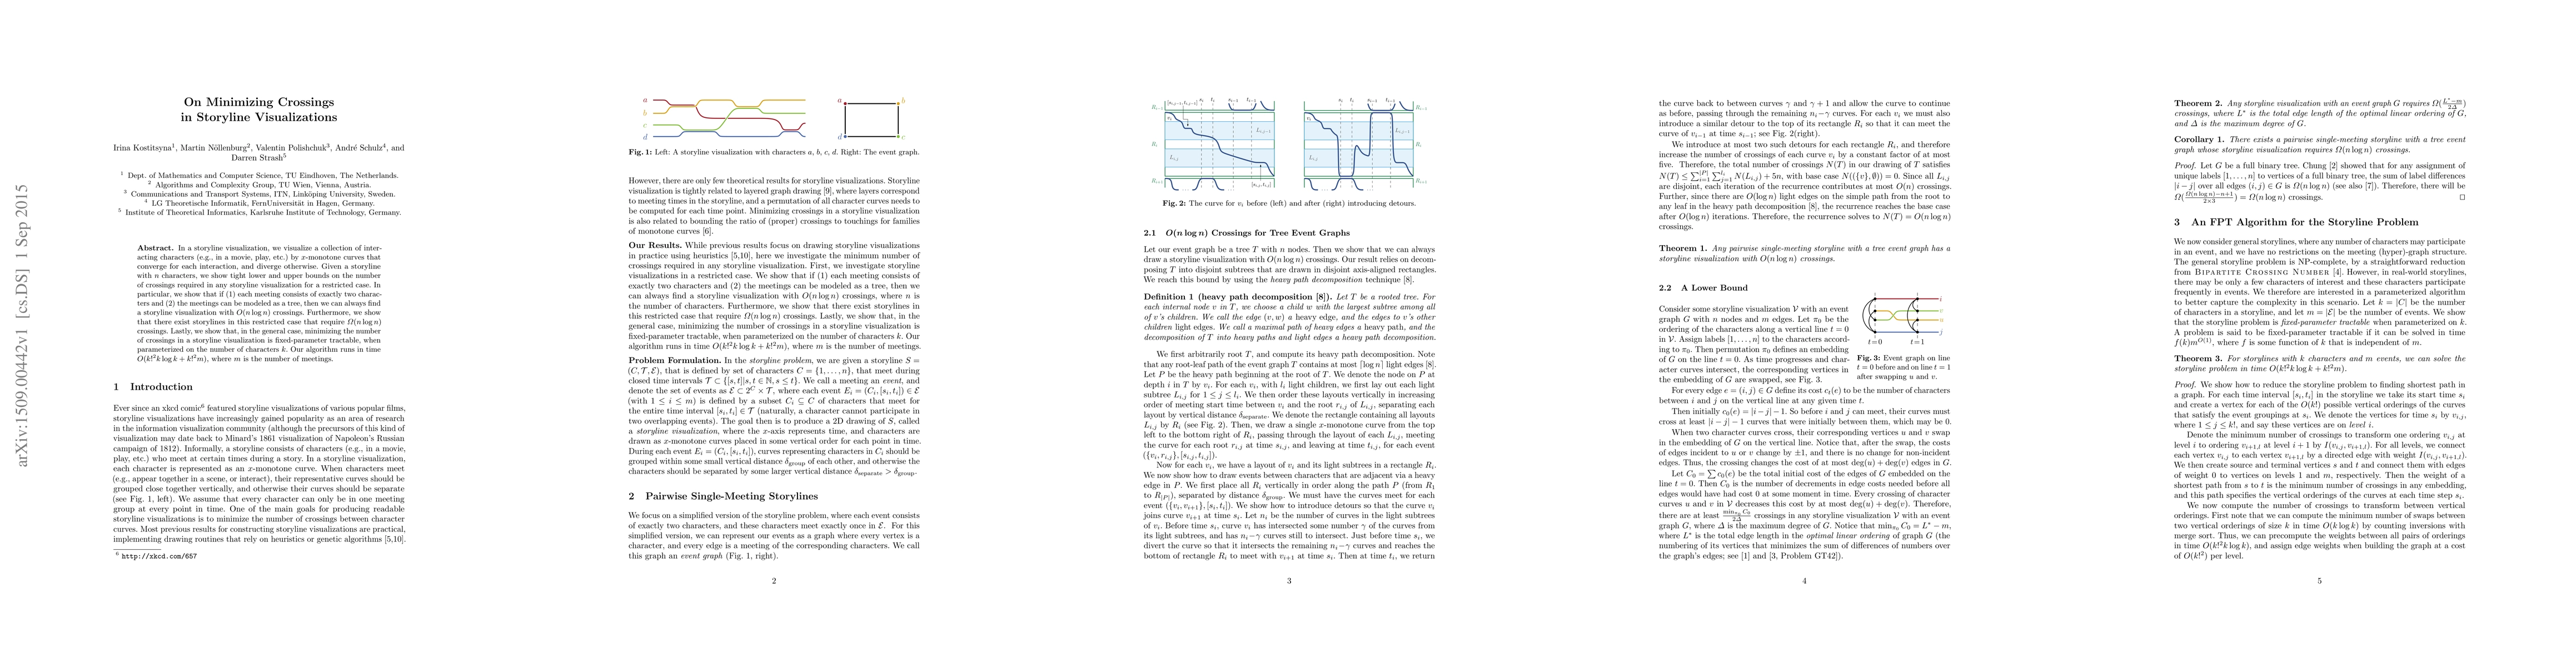
In a storyline visualization, we visualize a collection of interacting characters (e.g., in a movie, play, etc.) by $x$-monotone curves that converge for each interaction, and diverge otherwise. Given a storyline with $n$ characters, we show tight lower and upper bounds on the number of crossings required in any storyline visualization for a restricted case. In particular, we show that if (1) each meeting consists of exactly two characters and (2) the meetings can be modeled as a tree, then we can always find a storyline visualization with $O(n\log n)$ crossings. Furthermore, we show that there exist storylines in this restricted case that require $\Omega(n\log n)$ crossings. Lastly, we show that, in the general case, minimizing the number of crossings in a storyline visualization is fixed-parameter tractable, when parameterized on the number of characters $k$. Our algorithm runs in time $O(k!^2k\log k + k!^2m)$, where $m$ is the number of meetings.
Seven facets of this paper, analysed and brought into focus by AI.
The research has implications for visual analysis and optimization of dynamic graphs, with potential applications in fields such as computer vision and data science.
The research uses a combination of graph theory and dynamic programming to solve the storyline problem.
The research has implications for visual analysis and optimization of dynamic graphs, with potential applications in fields such as computer vision and data science.
The research introduces a new approach to solving the storyline problem using graph theory and dynamic programming, with potential for improved efficiency and scalability.
The work presents a novel application of graph theory and dynamic programming to the storyline problem, offering a fresh perspective on a well-known optimization challenge.
Current paper (gray), citations (green), references (blue)
Display is limited for performance on very large graphs.
Discussion 0