New Collectivity Measures for Financial Covariances and Correlations
Publication
Metrics
AI Quick Summary
This paper introduces new measures to quantify collectivity in financial covariances and correlations, revealing coherent motions in industrial sectors. It identifies significant collectivity signals around major financial events, such as the Lehman Brothers crash, and observes shifts in market trends linked to higher sector collectivity values.
Paper Preview
Abstract
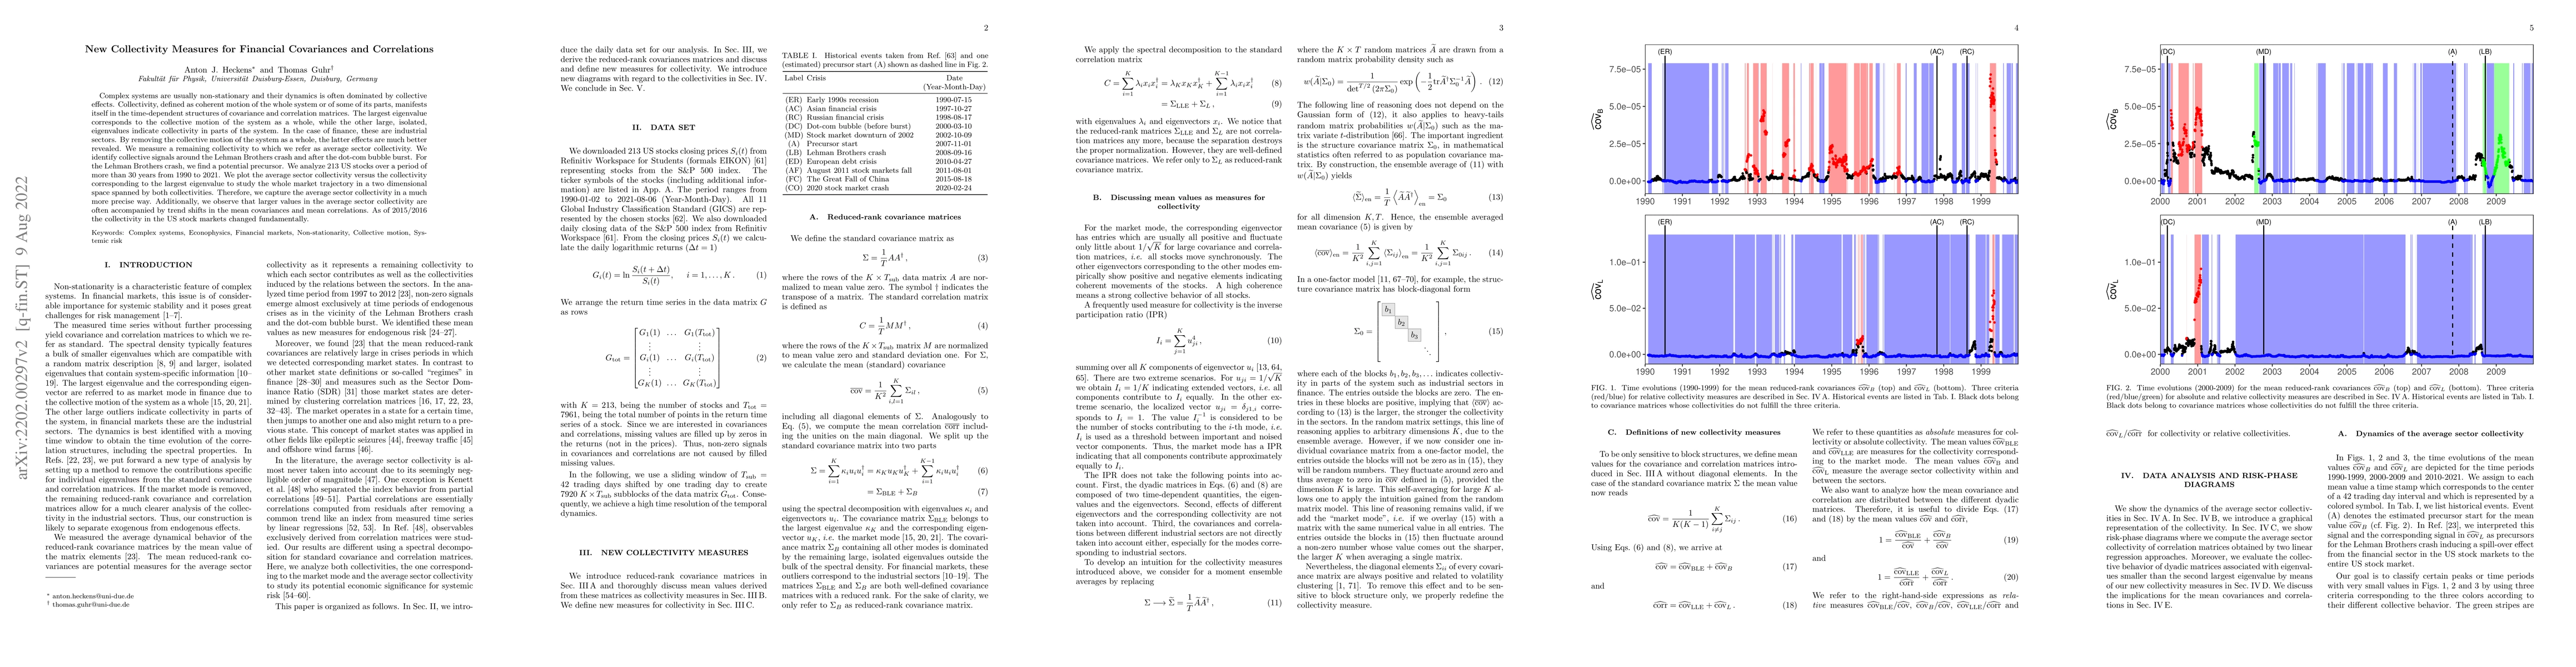
Complex systems are usually non-stationary and their dynamics is often dominated by collective effects. Collectivity, defined as coherent motion of the whole system or of some of its parts, manifests itself in the time-dependent structures of covariance and correlation matrices. The largest eigenvalue corresponds to the collective motion of the system as a whole, while the other large, isolated, eigenvalues indicate collectivity in parts of the system. In the case of finance, these are industrial sectors. By removing the collective motion of the system as a whole, the latter effects are much better revealed. We measure a remaining collectivity to which we refer as average sector collectivity. We identify collective signals around the Lehman Brothers crash and after the dot-com bubble burst. For the Lehman Brothers crash, we find a potential precursor. We analyze 213 US stocks over a period of more than 30 years from 1990 to 2021. We plot the average sector collectivity versus the collectivity corresponding to the largest eigenvalue to study the whole market trajectory in a two dimensional space spanned by both collectivities. Therefore, we capture the average sector collectivity in a much more precise way. Additionally, we observe that larger values in the average sector collectivity are often accompanied by trend shifts in the mean covariances and mean correlations. As of 2015/2016 the collectivity in the US stock markets changed fundamentally.
AI Key Findings
Get AI-generated insights about this paper's methodology, results, significance, and more — seven facets brought into focus.
Impact
Paper Details
Authors
PDF Preview
Key Terms
Citation Network
Current paper (gray), citations (green), references (blue)
Display is limited for performance on very large graphs.
Discussion 0