NOVA: A Practical Method for Creating Notebook-Ready Visual Analytics
Publication
Metrics
AI Quick Summary
NOVA is a practical method for integrating web-based visual analytics tools into computational notebooks, facilitating seamless data science workflows. It enables data scientists to adopt visual analytics without disrupting their existing notebook-based processes.
Paper Preview
Abstract
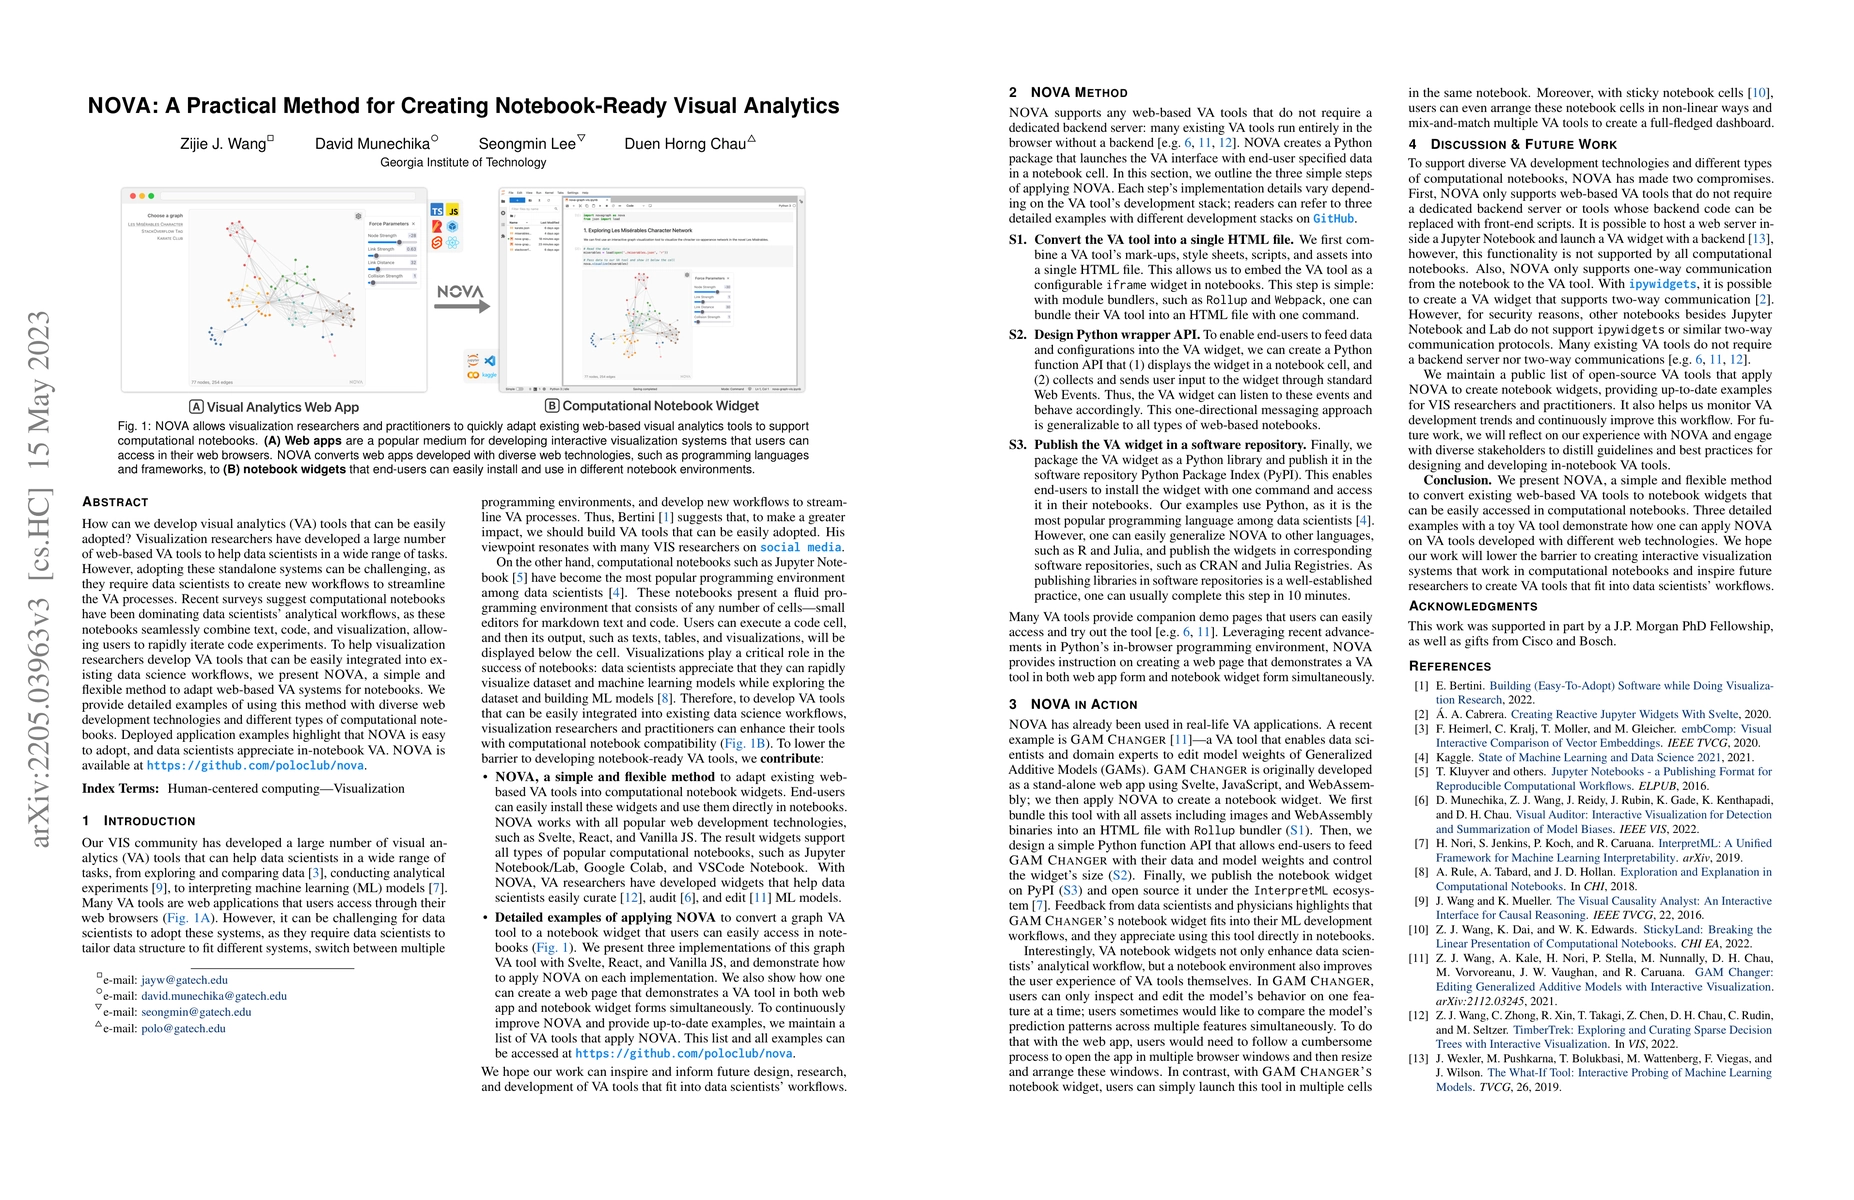
How can we develop visual analytics (VA) tools that can be easily adopted? Visualization researchers have developed a large number of web-based VA tools to help data scientists in a wide range of tasks. However, adopting these standalone systems can be challenging, as they require data scientists to create new workflows to streamline the VA processes. Recent surveys suggest computational notebooks have been dominating data scientists' analytical workflows, as these notebooks seamlessly combine text, code, and visualization, allowing users to rapidly iterate code experiments. To help visualization researchers develop VA tools that can be easily integrated into existing data science workflows, we present NOVA, a simple and flexible method to adapt web-based VA systems for notebooks. We provide detailed examples of using this method with diverse web development technologies and different types of computational notebooks. Deployed application examples highlight that NOVA is easy to adopt, and data scientists appreciate in-notebook VA. NOVA is available at https://github.com/poloclub/nova.
AI Key Findings
Get AI-generated insights about this paper's methodology, results, significance, and more — seven facets brought into focus.
Impact
Paper Details
Authors
PDF Preview
Key Terms
Citation Network
Current paper (gray), citations (green), references (blue)
Display is limited for performance on very large graphs.
Discussion 0