Publication
Metrics
Paper Preview
Abstract
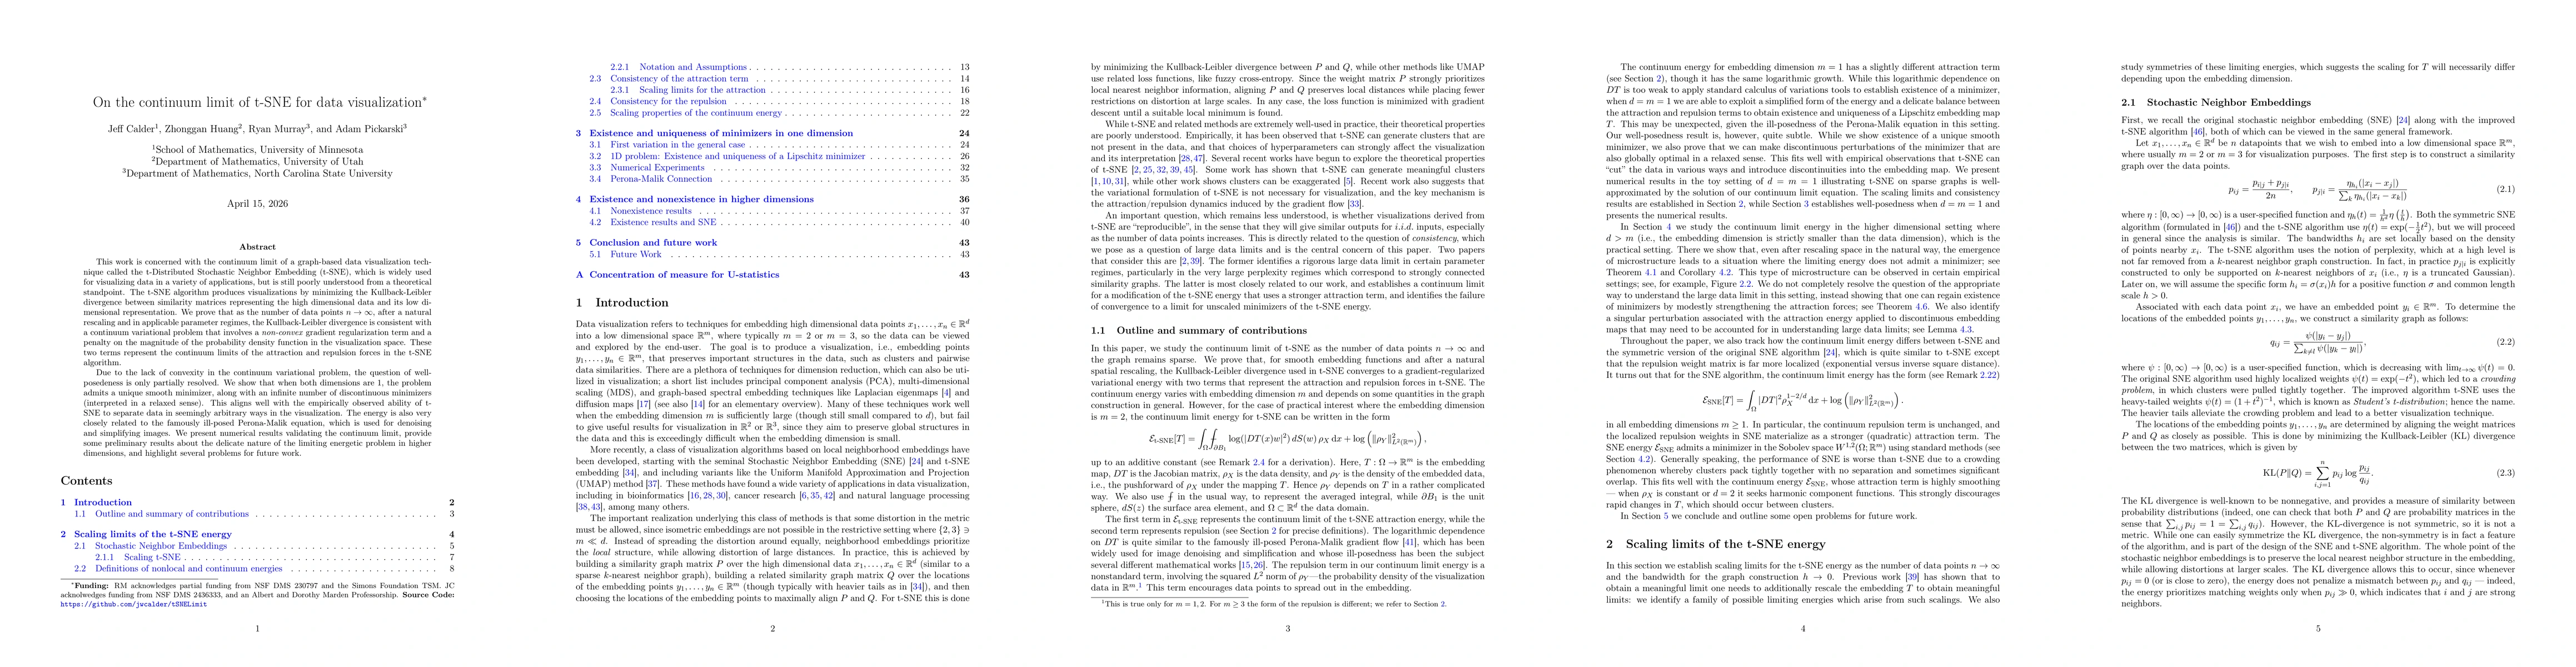
This work is concerned with the continuum limit of a graph-based data visualization technique called the t-Distributed Stochastic Neighbor Embedding (t-SNE), which is widely used for visualizing data in a variety of applications, but is still poorly understood from a theoretical standpoint. The t-SNE algorithm produces visualizations by minimizing the Kullback-Leibler divergence between similarity matrices representing the high dimensional data and its low dimensional representation. We prove that as the number of data points $n \to \infty$, after a natural rescaling and in applicable parameter regimes, the Kullback-Leibler divergence is consistent as the number of data points $n \to \infty$ and the similarity graph remains sparse with a continuum variational problem that involves a non-convex gradient regularization term and a penalty on the magnitude of the probability density function in the visualization space. These two terms represent the continuum limits of the attraction and repulsion forces in the t-SNE algorithm. Due to the lack of convexity in the continuum variational problem, the question of well-posedeness is only partially resolved. We show that when both dimensions are $1$, the problem admits a unique smooth minimizer, along with an infinite number of discontinuous minimizers (interpreted in a relaxed sense). This aligns well with the empirically observed ability of t-SNE to separate data in seemingly arbitrary ways in the visualization. The energy is also very closely related to the famously ill-posed Perona-Malik equation, which is used for denoising and simplifying images. We present numerical results validating the continuum limit, provide some preliminary results about the delicate nature of the limiting energetic problem in higher dimensions, and highlight several problems for future work.
AI Key Findings
Get AI-generated insights about this paper's methodology, results, significance, and more — seven facets brought into focus.
Discussion 0